Coastal Hazards in Canada Les dangers pour les côtes au Canada - Canadian Society for Civil ...
←
→
Transcription du contenu de la page
Si votre navigateur ne rend pas la page correctement, lisez s'il vous plaît le contenu de la page ci-dessous

Coastal Hazards in Canada
          Les dangers pour
       les côtes au Canada

              Summer / ÉtÉ
                      2010   27.3
SNC Lavalin AD

A proven business formula. Use our online
tools and streamline your workload. Consult
with our experts from the onset of your projects
and obtain results that measure up to your
expectations.

For more information, contact Stéphane Roy, Eng.,
at 1-877-499-6049 or online at
www.canam-steeljoist.ws/contactus-engineering

Canam, customized solutions
at your service!

                A division of Canam Group           w w w. c a n a m . w s / e n g i n e e r s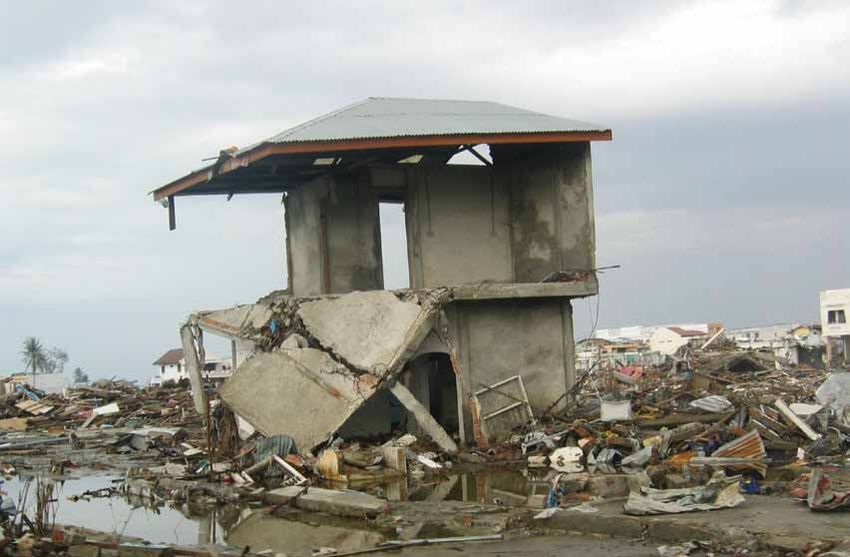
features
     page 8
     Pollution in the Nearshore Regions of the Great Lakes
     page 11
     Tsunami Loading of Near-Shoreline Infrastructure
8    page 14
     Storm Surges in Canada
     page 18
     Tsunami Risk and Vulnerability for Canada

     columns
     4    from the editors / mot des rédacteurs
     6    presidential perspective / perspective présidentielle
     21   the definition of infrastructure / la définition des infrastructures
     22   history notes / notes historiques
     24   international affairs / affaires internationales
     26   csce national honours and awards call for nominations /

11
          appel—distinctions honorifiques nationales scgc
     27   csce annual conference winnipeg 2010 winners student awards /
          winnipeg 2010 congrès annuel scgc gagnants prix étudiants
     28   membership matters / question d’appartenance
     31   spotlight on members / membres en vedette
     32   engineering a sustainable world winnipeg 2010 /
          winnipeg 2010 solutions de génie pour un monde durable
     34   lifelong learning / l’éducation permanente
     34   coming events / calendrier des activités

14
From the editors / Mot des rédacte urs
louise newman louise @csce .ca
Guest Editor: Dr. Ioan NISTOR P.Eng., Associate Professor, Universit y of O ttawa /
ing., Professeur agrégé, Universit é d’Ottawa
27.3
Coastal Hazards in Canada Les dangers pour les côtes au
Q
The Canadian Civil Engineer (CCE) ISSN 9825-7515
uickly glancing at the map of Canada
U
is published five times per year by the Canadian
Society for Civil Engineering (CSCE). Canada, one can easily notice its n rapide coup d’œil sur la carte
L’Ingénieur civil canadien (ICC) ISSN 9825-7515 extensive and intricate coastline, géographique du Canada suf-
est publié cinq fois par année par la Société which, at 242,043 kilometres, is the lon- fit pour constater que nous avons
canadienne de génie civil (SCGC).
gest in the world. Besides being bordered beaucoup de rivages, et des rivages com-
CSCE / SCGC by three of the largest planetary oceans plexes : 242 043 kilomètres de rivages, en
4920 de Maisonneuve W., Suite 201
Montréal, QC H3Z 1N1
(Atlantic, Arctic and Pacific), Canada has fait, ce qui représente un record! En plus
Tel: 514-933-2634 Fax: 514-933-3504 innumerable freshwater lakes, which add d’avoir comme limites naturelles trois des
E-mail: info@csce.ca significant length to its maritime coastlines. plus grands océans de la planète (Atlantique,
www.csce.ca
It is impressive that more than 72% of Arctique et Pacifique), le Canada possède
CSCE Office / Office de la SCGC Canada’s population lives in close proximity un nombre incalculable de lacs d’eau douce,
President / Président
Vic Perry, P.Eng., FCSCE (Calgary, AB) to a large body of fresh or sea water! A sig- ce qui ajoute à la longueur totale de ses rives.
President Elect / Président désigné
nificant proportion of Canada’s population Plus de 72 % de la population du Canada
Randy Pickle, P.Eng., FCSCE (Oshawa, ON) (more then 22%) lives along the coastlines vit à proximité d’un vaste plan d’eau, qu’elle
of the Great Lakes, which represent the soit douce ou salée! Une importante fraction
CCE Board / Conseil de l’ICC
CSCE Publications Committee Chair world’s largest body of fresh water. de la population du Canada (plus de 22 %)
Présidente, Comité des publications de la SCGC The particular proximity of the oceans vit le long des rives des Grands Lacs, qui
Dagmar Svecova, Ph.D., MCSCE (Winnipeg, MB)
translates into an increased risk for coastal constituent le plus important réservoir d’eau
CCE Editor / Rédactrice de l’ICC
Louise Newman (Montréal, QC)
hazards for communities located in such douce au monde.
areas. While coastal hazards can occur La proximité des océans signifie un risque
Editorial Committee Members / Membres du comité éditorial
David Lau, P.Eng., FCSCE (Ottawa, ON) under various forms, Canada’s potential accru de dangers côtiers pour ces commu-
O. Burkan Isgor, Ph.D., P.Eng., MCSCE (Ottawa, ON) coastal hazards include some of the most nautés. Même si les dangers côtiers peu-
Caterina Valeo, Ph.D., P.Eng. (Calgary, AB)
destructive ones: tsunamis, hurricanes and vent prendre diverses formes, les dangers
Annual Subscription Rates / Abonnement annuel storm surges, as well coastal pollution due côtiers propres au Canada sont parmi les
Canada & U.S.A. $35.00 to accidental or systematic discharge of pol- plus destructeurs. Ce sont les inondations
other countries / autres pays $45.00
single copy / au numéro $7.50 luting agents. While some of these hazards causées par les tsunamis, les orages et les
agency discount / rabais aux distributeurs 10% may occur at infrequent or long intervals ouragans, ainsi que la pollution des côtes
Design / Production of time, their devastating impacts are sig- attribuable à l’écoulement accidentel ou
AN Design Communications (Ottawa, ON) nificant and can heavily impact the coastal systémique de polluants. Bien que certains
613-744-0444
www.an-design.ca
communities. de ces dangers puissent se présenter à des
This issue briefly introduces and dis- intervalles longs ou peu fréquents, leurs
Advertising / Publicité cusses some of these coastal hazards, which effets dévastateurs sont importants et peu-
Dovetail Communications Inc.
T: 905-886-6640 may affect both the maritime and inland vent affecter lourdement les communautés
F: 905-886-6615 Canadian coastlines. At the same time, riveraines.
Janet Jeffery 905-886-6641 ext. 329
E: jjeffery@dvtail.com
some of the aspects related to the impact of Le présent numéro traite de certains de
the tsunami coastal inundation on infra- ces dangers côtiers susceptibles d’affecter les
The opinions expressed in the papers are solely those of the structure located in the vicinity of the coast- rives des océans et des lacs d’eau douce. On
authors and the Canadian Society for Civil Engineering is
not responsible for the statements made in this publication. line in tsunami-prone areas, such as along mentionne également certains aspects reliés
the western seaboard of British Columbia, à l’impact d’un tsunami sur les rives des
Les opinions exprimées dans les articles sont la seule
responsabilité de leurs auteurs et la Société canadienne de are also presented. In spite of their rare communautés exposées, comme le long de
génie civil n’engage pas sa responsabilité dans les propos occurrence, tsunami waves represent a sig- la côte Ouest de la Colombie-Britannique.
exprimés. nificant threat for western North America Malgré qu’il s’agisse d’un phénomène rare,
All commentaries and questions about this publication given the major recorded tsunamis in the les vagues de tsunami constituent une
should be forwarded to the Editor: Pacific Ocean. Considering that major cities menace réelle dans l’Ouest de l’Amérique du
Pour vos commentaires ou de plus amples informations,
contacte la rédactrice : are located along this coastline, and the les- Nord, compte tenu des importants tsuna-
Louise Newman, louise@csce.ca 514-933-2634 ext. 23 sons learned following the December 2004 mis qui surviennent dans l’océan Pacifique.
Return Address / Adresse de retour : Indian Ocean Tsunami, it is imperative that Comme d’importantes villes sont situées sur
The Canadian Society for Civil Engineering engineers become aware of the possible dev- ces rivages, et à la suite des leçons servies par
La Société canadienne de génie civil
4920 de Maisonneuve W., Suite 201 astating effects of such natural phenomena le tsunami dans l’océan Indien en décembre
Montréal, QC H3Z 1N1 on infrastructure located in coastal areas. 2004, il est nécessaire que les ingénieurs
continued on page 5 suite à la page 5
continued from page 4
We wish to extend our warm thanks to THE STRENGTH BEHIND LA FORCE D’UNE
the engineers and scientists who contrib- A UNITED VOICE VOIX UNIE
uted to this issue. The authors welcome and
invite your comments and feedback. n
• Networking source • Endroit pour tisser des réseaux
• Annual Conferences • Congrès annuels
• Continuing education opportunities • Activités de formation continue
• Publications • Publications
suite de la page 4 • National lecture tours • Tournées nationales de conférences
soient sensibilisés aux effets dévastateurs • International programs • Programmes internationaux
possibles de ces phénomènes naturels sur les • Awards • Prix et autres distinctions
infrastructures situées en régions côtières. • Personal benefits that save • Avantages personnels qui vous écono-
Nous remercions les ingénieurs et les you money misent de l’argent
scientifiques qui ont contribué à ce numéro
et nous serons heureux de recevoir vos Membership in the CSCE demonstrates a Appartenir à la SCGC, c’est s’engager envers
commentaires. n personal commitment to the profession, both la profession, au niveau local et au niveau
locally and nationally. It also offers vari- national. C’est aussi une occasion de profiter
ous personal benefits and reduced fees on des avantages et des tarifs spéciaux pour parti-
attendance at all professional activities and ciper aux activités professionnelles et aux con-
conferences sponsored by the CSCE. grès et conférences commandités par la SCGC.
For more information on the benefits of Pour plus de renseignements sur les avantages
CSCE membership, please e-mail us at offerts par la SCGC, faites-nous parvenir un
membership@csce.ca or call us at courriel à l’adresse membership@csce.ca ou
514-933-2634 or visit www.csce.ca appelez-nous au 514-933-2634 ou consultez
le site web www.csce.ca
É T É 2 0 1 0 • l ’ i n g é n i e u r C I V I L c a n a d i e n • 5
Presidential Perspective / perspective pré sidentielle
    V.H. (Vic) Perry        FEC, FCSCE, MASC., P.E ng. / FEC, FSCGC, MASC., ing.

I
      t is a great honour and privilege to be                        I received common responses to all ques-     ecological footprint, for example, is huge.
      asked by one’s peers to serve as presi-                    tions, such as: (i) Civil Engineers plan,        If everyone on earth consumed as many
      dent of such a great organization as                       design, build and maintain infrastructure;       resources and generated as much waste as
the CSCE. With everyone’s assistance, dur-                       (ii) The CSF is providing “Sustainable”          we do, we’d need the equivalent of nearly
ing my term as president, we will move the                       Infrastructure; (iii) The brand is a bunch of    five more planets in order to be sustainable!
CSCE and our profession towards a higher                         old grey haired guys; and (iv) CSCE needs        There is only one planet that is reasonably
level of involvement and recognition—a                           to take a leadership role through advocacy       accessible today, so it is imperative that we
recognition that civil engineers, as keepers                     and by raising the profile of civil engineers.   use it wisely and sparingly, unlike we cur-
of the infrastructure, play an important role                        We are facing interesting and challenging    rently do. The ‘big box’ movement, which
in society’s quality of life.                                    times as civil engineers.                        drives down prices and feeds consumerism,
   During the past year as your SVP, I com-                          Challenge I: Rapidly Increasing Demand       creates over consumption of large quantities
mitted my time to travelling from St. John’s,                    —Each day more than a quarter of a mil-          of global resources. While lower prices help
NL to Victoria, BC and meeting with as                           lion children are born, with a net effect of     the less privileged, it also facilitates over
many CSCE members and non-members as                             increasing the earth’s population to 7 bil-      consumption by enabling the purchase of
possible. I wanted to find out why CSCE’s                        lion by 2020, even if birth rates continue to    ‘wants’ rather than ‘needs’.
membership has been flat for the past many                       decline at current rates. That is the equiva-       Challenge III: Rapid Deterioration
years and how CSCE could become more                             lent of adding the population of another         of Existing Infrastructure—Our current
relevant to a larger base of potential mem-                      China by 2020. The current population,           infrastructure is deteriorating faster than
bers, particularly younger members who                           as well as all those new children, deserves      we are repairing it. In North America today,
are the future of our Society. The purpose                       to have clean water, food and shelter—a          there are more than 150,000 bridges that are
of my travel was to ask four very important                      standard of living we take for granted in        structurally deficient or functionally obso-
questions: (i) What is the business of civil                     North America. This standard of living or        lete and more than 3,000 new bridges are
engineers? (ii) What is the Critical Success                     quality of life is only made possible through    added each year. The American Society of
Factor (CSF) for civil engineering in the                        our infrastructure—the networks that             Civil Engineers’ 2009 Report for America’s
22nd century? (iii) What can CSCE do                             allow the movement of goods and people.          Infrastructure gave an overall D+ rating to
to address the CSF? and, (iv) What does                          Increasing population requires expansion         America’s infrastructure, with an estimated
the CSCE brand mean to you vis-à-vis                             and/or improvements in the infrastructure.       $2.2 trillion investment required to bring it
Engineers Without Borders.                                           Challenge II: Large North American           to an acceptable level. In Canada the NRC
                                                                 Ecological Footprint—North Americans’            in 1999 stated that 38% of our infrastruc-
                                                                                                                  ture is rated as poor or critical with respect
                                                                                                                  to condition or meeting demand.
                                                                                                                     Challenge IV: Financing—Today,
   SUSTAINABILITY: NEW PERSPECTIVES                                                                               municipal, state, provincial and federal gov-
                                                                                                                  ernments globally, with few exceptions, do
    FOR MANAGING INFRASTRUCTURE                                                                                   not have the money to upgrade and expand
      Doing what is effective vs doing what is expedient                                                          the infrastructure to meet the current or
                                                                                                                  future needs of society. Raising taxes or
    R.V. Anderson Associates Limited presents a webcast discussion featuring Reg                                  reallocating current tax dollars does not
    Andres and Hans Arisz of R.V. Anderson Associates Limited together with Bill                                  appear to be on the government’s agenda
    Wallace, sustainability expert of Wallace Futures Group and Murray Jamer, Director
                                                                                                                  nor is it the political will.
    of Engineering and Public Works at the City of Fredericton.
                                                                                                                     It is clear the “status quo” is unaccept-
    This special presentation provides new perspectives for the connection between                                able. We must change and sooner rather
    global sustainability and infrastructure management. It also addresses approaches                             than latter. Civil Engineers have a critical
    to sustainability and the many challenges faced by infrastructure managers today.                             role to play in meeting these challenges.
    A recording of this presentation is available at:                                                             CSCE has a role to play in assisting civil
    www.rvanderson.com/SustainableInfrastructureManagement                                                        engineers to meet the challenges.
                                                                                                                     I believe that as civil engineers our busi-
                                                                                                                  ness is infrastructure (soft & hard aspects)
             R.V. Anderson                                                                                        and that the most critical aspect of our busi-
             Associates Limited                                                                                   ness going forward is to ensure the infra-
              engineering · environment · infrastructure
                                                                                                                  structure is sustainable and that CSCE’s
   416 497 8600                     www.rvanderson.com                                                            role should be to assist civil engineers in
                                                                                                                  continued on page 7

6 • C a n a d i a n C I V I L  E n g i n e e r •  s u m m e r 2 0 1 0
                                                                            Canadian Civil Engineer
                                                                                    4.875” x 3.625”
C
’est un grand honneur et un grand actuelle, ainsi que tous ces enfants à venir, Défi numéro IV : le financement—En
privilège que d’être invité par ses méritent de jouir d’un air pur, de nourriture ce moment, les gouvernements municipaux,
pairs à présider un organisme aussi et d’un toit adéquat, ce qui représente un provinciaux et fédéral ne disposent pas, à
important que la SCGC. Avec l’aide de niveau de vie que nous considérons comme quelques exceptions près, de l’argent néces-
tous, au cours de mon mandat, nous confé normal en Amérique du Nord. Ce niveau saire pour améliorer et augmenter les infra-
rerons à la SCGC et à la profession un plus de vie, cette qualité de vie, est rendue pos- structures de façon à combler les besoins
grand niveau de participation et de recon- sible par nos infrastructures, ces réseaux qui futurs de la société. La hausse des impôts
naissance, cette reconnaissance qui fait que permettent la circulation des biens et des ou la redistribution des recettes fiscales
les ingénieurs civils, à titre de gardiens des personnes. La croissance des populations actuelles ne semble pas être une priorité des
infrastructures, jouent un rôle important exige que les infrastructures soient dévelop- gouvernements.
pour la qualité de la vie de la société. pées et améliorées. Il est évident que le statu quo est inac-
À titre de premier vice-président, au cours Défi numéro II : l’importante ceptable. Nous devons changer les choses,
de la dernière année, j’ai voyagé de St-John’s e mpreinte écologique de l’Amérique et le plus vite sera le mieux. Les ingénieurs
à Victoria, rencontrant le plus de mem- du Nord—L’empreinte écologique de civils ont un rôle capital à jouer pour relever
bres et de non-membres possible. Je voulais l’Amérique du Nord est énorme. Si toute ces défis. La SCGC a un rôle à jouer pour
savoir pourquoi nos effectifs étaient restés la population du monde consommait aider les ingénieurs civils à relever ces défis.
au même niveau au cours des dernières autant de ressources et créait autant de Je crois qu’à titre d’ingénieurs civils,
années et comment la SCGC pourrait deve- déchets que nous, il nous faudrait au moins notre boulot est centré sur les infrastruc-
nir plus pertinente pour attirer plus de l’équivalent de cinq autres planètes afin tures, et le principal facteur critique de
membres, surtout de jeunes membres capa- d’assurer notre durabilité! Comme il n’y a succès consiste à garantir que les infra-
bles d’assurer l’avenir de notre société. Le présentement qu’une seule planète qui soit structures seront durables. Le rôle de la
but de mes déplacements était de vous poser raisonnablement accessible à l’être humain SCGC est donc d’aider l’ingénieur civil à
quatre questions importantes : (i) Quel est pour l’instant, il est essentiel que nous devenir un chef de file dans le domaine.
le travail de l’ingénieur civil? (ii) Quel est le l’exploitions avec intelligence et parcimonie, De là, le slogan « Leadership en matière
facteur critique de succès pour le génie civil et non comme nous le faisons présentement. d’infrastructures durables ». Je crois vrai-
au 22e siècle? (iii) Que peut faire la SCGC Le mouvement des grandes surfaces, qui ment que cette perspective incitera les
pour tenir compte de ce facteur critique coupe les prix, crée aussi une surconsomma- jeunes ingénieurs civils à se joindre à la
de succès, et (iv) Que signifie pour vous la tion d’importantes quantités de ressources SCGC.
marque SCGC par rapport à Ingénieurs de la planète. Même si la chute des prix Mon objectif à titre de président pour la
sans frontières. aide les moins privilégiés d’entre nous, elle prochaine année est de mettre en œuvre un
Toutes ces questions m’ont valu des facilite quand même la surconsommation en plan qui permettra à la SCGC d’atteindre
réponses assez constantes, qui sont les permettant aux gens d’acheter tout ce qu’ils cet objectif de « leadership en matière
suivantes : (i) L’ingénieur civil planifie, veulent plutôt que ce dont ils ont besoin d’ infrastructures durables ».
conçoit, construit et assure l’entretien des Défi numéro III : la détérioration La SCGC est un organisme de bénévoles,
infrastructures; (ii) Le facteur critique de rapide des infrastructures existantes— et nous comptons sur l’aide et la contribu-
succès consiste à offrir des infrastructures Nos infrastructures actuelles se détériorent tion de tous et chacun.
« durables »; (iii) La marque SCGC évoque plus vite que nous pouvons les réparer. Je vous remercie de la confiance que
une bande de vieilles têtes grisonnantes; et En Amérique du Nord, en ce moment, il vousm’accordez. n
(iv) La SCGC doit devenir un chef de file en y a plus de 150 000 ponts dont la struc-
faisant valoir les intérêts des ingénieurs et en ture est déficiente ou fonctionnellement continued from page 6
assurant le rayonnement de la profession. désuète, et ce chiffre grossit de 3 000 ponts this task by taking a leadership role, hence
En tant qu’ingénieurs civils, nous avons à chaque année. Dans un document publié “Leadership in Sustainable Infrastructure”.
des défis importants à relever. en 2009 sur l’état des infrastructures des I also believe that this vision will excite
Défi numéro I : une demande qui aug- USA, l’American Society of Civil Engineers young engineers to join CSCE.
mente rapidement—À chaque jour, plus a évalué à D+ l’état général des infra- My objective as president over the next
d’un quart de million d’enfants naissent, structures aux USA, ajoutant qu’il faudrait year is to put in place a road map to put
ce qui portera la population mondiale à investir environ 2,2 milliards de dollars CSCE on the road towards this vision—
7 milliards de personnes en 2020, même si pour les ramener à un niveau acceptable. “Leadership in Sustainable Infrastructure”.
le taux de natalité continue de diminuer au Au Canada, le CNR a affirmé, en 1999, que CSCE is a volunteer organization and I
rythme actuel. Cette augmentation équi 38 % de nos infrastructures étaient dans un will be asking for everyone’s input and help.
vaut à ajouter, d’ici 2020, une population état mauvais ou critique, compte tenu de la Thank you again, for entrusting me with
égale à celle de la Chine! La population demande. the role of president. n
É T É 2 0 1 0 • l ’ i n g é n i e u r C I V I L c a n a d i e n • 7
Pollution in the Nearshore
                                                                 Regions of the Great Lakes

Ram Yerubandi         PhD
Research Scientist and Adjunct Professor
National Water Research Institute, Canada Centre
for Inland Water, Environment Canada, Burlington, ON

Susan B. Watson         PhD
Research Scientist
Environment Canada, Water Science and Technology, National
Water Research Institute, Burlington, ON

                                                                 Introduction
                                                                 The Laurentian Great Lakes of North           associated with agricultural, industrial and
                                                                 America (Superior, Michigan, Huron, Erie      municipal activities. This has resulted in
                                                                 and Ontario) and their connecting chan-       cultural eutrophication, algal blooms and
                                                                 nels form the largest fresh surface water     increased levels of anthropogenic pollut-
                                                                 system on earth. They hold approximately      ants, toxins and pathogens (IJC, 1980).
                                                                 20% of global fresh water, which provides     Because of this widespread deterioration, by
                                                                 drinking water to over 15 million Canadian    the latter part of the last century an inter-
                                                                 and US consumers. In the last two centu-      national remediation effort was initiated
                                                                 ries, the Great Lakes basin has experienced   under the Canada-US Great Lakes Water
                                                                 exponential increase in human settlement      Quality Agreement (GLWQA) (Plate 1). As
                                                                 and basin development. The Lakes have         part of this programme, the International
                                                                 undergone radical changes as a result of      Joint Commission (IJC) identified 42 areas
                                                                 dredging, diversion and damming, ero-         of concern (AOCs). Remedial action plans
                                                                 sion and the development of a major lake-     (RAPs) were developed for each AOC to
                                                                 wide ocean-linked shipping route. Climate     reduce impairments to acceptable target
                                                                 change has modified ice cover, hydrological   levels.
                                                                 and thermal energy budgets. Considerable         The Laurentian Great Lakes represent
                                                                 water pollution in the Great Lakes basin      systems dominated by their coastal nature.
                                                                 arises from point and non-point sources       The nearshore waters of the Great Lakes

8 • C a n a d i a n C I V I L  E n g i n e e r •  s u m m e r 2 0 1 0
basin are exploited directly by humans for
many uses; notably for drinking water, to               Great Lakes                                                                    Blooms
                                                                                                                                       Taste-odour
disperse pollutants and wastewater, for                                                                                                Toxins
industrial processes. Most pollutants that                                                                                             CLIMATE CHANGE
reach Great Lakes nearshore waters enter                                                                                                     Pharmaceuticals
from the land via tributaries, shoreline                                                                                                  Endocrine Disruptors
                                                                                                                                                  Aquaculture
discharges, or as surface runoff. Pollutant
                                                                                                                                    Combined Sewar Overflows
concentrations can be higher near tributary                                                                                            Non-point Source Input
mouths and discharge sites until they are                                                                                              Water Level Regulation
diluted with the nearshore waters and ulti-                                                                                           Glyphosate & Pesticides

                                                                                                                                                                  Basin population & development
                                                                                                                                                                              Cumulative impacts
mately with the larger volumes of cleaner                                                                                              Fish Habitat Disruption
                                                                                                                                      Waterfront Development
offshore water. Several physical factors com-
bine to make the coastal systems complex                                                                                                   phytoplankton
                                                                                                                                           zooplankton
and unique in their hydrodynamics, and the
                                                                                                                    Invasive Species       fish
associated physical transport and dispersal                                                                                                mussels
processes of the coastal flow field are equally                                                             Blooms
                                                                                                                                           benthos
                                                                                                                                           fish
complex (Rao and Schwab, 2007). Physical                                                                    Anoxia
transport processes are often the dominant                                                                  Taste-odour
                                                         contaminants, eutrophication                       Phosphorus
factor in mediating geochemical and bio-
logical processes in this environment.                 1920                                  1960        1970          1980        1990         2000
                                                       Great Lake Water Quality Agreement & Lakewide Restoration
Contaminant transport from
point sources                                     Plate 1: Timeline of water quality concerns in the Great Lakes.
The difficulty of predicting the discharges
into coastal waters often lead to either
over or under-estimation of their impacts.        area, extending, at most, a few kilometres                        these areas have become increasingly pol-
Domestic or industrial sewage is quite            offshore. Improvements in water purifica-                         luted with high bacterial levels and mats
buoyant in the lake water column and forms        tion and sewage treatment technology have,                        of decaying algae, rendering them unfit,
a turbulent plume. Coastal currents exist         to some degree, offset the deleterious effects                    and in some areas, unsafe, for recreational
over a wide range of length and time scales       of increased development. However, current                        use. In response to the increasing concern
such as wave and wind-driven currents,            treatment technology seems to be nearing                          with this issue, several studies are now
and large-scale mean circulation. Although        its practical design limit, while the demand                      evaluating the levels of microbial pollution
these spatial and temporal variations in          for clean water and the need for suitable                         at many beaches in the Great Lakes in the
coastal currents, especially their oscillatory    waste disposal facilities continue to rise at                     United States and Canada, and their links
behavior, can result in a highly disper-          an ever-increasing rate. Excessive loadings                       to sources such as storm water outfalls
sive environment, these complexities often        of phosphorus, ammonia, and suspended                             and tributary discharges. In Lake Ontario,
lead to worst case assumptions which lead         solids from sewage treatment plants, bacte-                       a network of government-funded interdis-
to overly conservative predictions. Often         rial contamination from Combined Sewer                            ciplinary source water protection studies
currents parallel to the coast or moving          Overflows (CSO) and storm runoffs con-                            are also undertaking an extensive evalua-
from open waters into coastal waters are          tribute to the problems of nearshore water                        tion of water quality and levels of water-
significant sources of nutrients. We need         clarity and poor water quality. Modeled                           borne pathogens such as Cryptosporidium,
long-term records of these currents and           predictions of the fate and transport of                          Giardia, campylobacter and enteric viruses
corresponding spatial and temporal patterns       contaminants in Lake Ontario have been                            at drinking water intakes and beaches.
in temperature, contaminants, nutrients,          assessed by utilizing a combination of physi-
and biota in order to relate these variations     cal limnological data and different types                         Invasive species
to the effects of climatic variability and        of transport models. These studies showed                         Nearshore waters provide habitat for a
coastal pollution sources. We also need           that because of the variability of winds, the                     growing number of non-indigenous species
better models of coastal waters to synthe-        transient properties of coastal currents are                      (NIS) introduced to the Great Lakes, which
size our knowledge and test mechanisms            often of greater importance in dispersing                         are dramatically affecting the ecology of
and process controls. In one such example,        the material than the steady state for con-                       these ecosystems with major socioeconomic
in the western end of Lake Ontario, urban         stant wind.                                                       impacts. In particular, the dreissenid mus-
communities of over 5 million residents rely                                                                        sels, introduced from ballast water in the
on this waterbody almost exclusively for          Microbial pollution in the                                        1980s, have rapidly colonized shorelines in
both water supply and wastewater disposal.        nearshore                                                         extensive, dense beds. Dense mussel encrus-
Water intakes and wastewater discharges           Many Great Lakes beaches are used exten-                          tation causes major fouling issues with
alike are typically installed alongshore from     sively for recreation from June through                           shoreline and navigation structures, drink-
each other in a narrow band of the inshore        August. Over the past decade, many of                             ing and coolant water intakes. Aggressive

                                                                                                            É T É 2 0 1 0 •  l ’ i n g é n i e u r C I V I L  c a n a d i e n • 9
tonic toxic cyanobacteria, but can involve a References
variety of species of both cyanobacteria and Hotto, A.M., Satchwell, M.F., and Boyer,
algae, and are particularly problematic in G.L. 2007. Molecular characterization
coastal areas. Impacts can include: risks to of potential microcystin-producing cya-
human and animal health via toxins, car- nobacteria in Lake Ontario embayments
cinogens, teratogens, or irritants in drink- and nearshore waters. Appl. Environ.
ing water; other drinking water impairment Microbiol. 73: 4570–4578.
(taste & odour, aesthetics); fouling of water International Joint Commission (IJC)
intakes, fish nets and shoreline; bacterial (1980). Phosphorus Management for
growth in rotting mats (including poten- the Great Lakes. Final Report to the
tial pathogens, e.g., E. coli); beach closures Great Lakes Water Quality Board and
(affecting recreation and tourism); tainting Great Lakes Science Advisory Board,
of fish, shellfish, and processed food (harm- Phosphorus Management Strategies Task
ing commercial and recreational fisheries Force, Windsor, ON, Canada, pp. 129.
and other food industries); food web integ- Rao, Y.R., Skafel, M.G., Howell, T., and
rity and structure, and environmental deg- Murthy, R.C. 2003. Physical Processes
radation such as anoxia. Sporadic outbreaks Controlling Taste and Odor Episodes in
Plate 2: Cyanobacteria bloom in Hamilton Harbour
(source: City of Hamilton Public Health Services).
of high toxin levels have been reported Lake Ontario Drinking Water. J. Great
in Microcystis blooms in nearshore areas Lakes Res. 29:70–78.
(Watson et al., 2005, Hotto et al., 2007). Rao, Y.R., and Schwab, D.J. 2007.
filter feeding by these organisms on plank- Data collected by larger Ontario municipal Transport and mixing between the
ton and other suspended materials from water treatment plants show episodes of coastal and offshore waters in the Great
the water column produces major shifts in elevated toxin levels in raw water, which Lakes: a review, J. Great Lakes Res. 33,
planktonic food web structure, redirects are adequately removed by the advanced 202–218.
the inshore-offshore exchange of nutrients treatment processes. However, a potential Watson, S.B., Millard, S., and Burley,
to the nearshore zones, and increases water risk exists for smaller utilities and private M. 2005. Taste—odour and toxins
transparency and the illuminated coastal users with more rudimentary removal in the Bay of Quinte. Project Quinte
lake-bottom area which supports plant and technology. AOCs such as the Bay of Monitoring Report #16, Bay of Quinte
algal growth. The mussels also facilitate Quinte, Hamilton Harbour and Rochester R AP Restoration Council/Project
benthic growth by providing substrate Embayment show periods of severe impair- Quinte. Trenton, Ontario 164 p.
for attachment. The resultant extensive ment of nearshore sites by windblown accu- Watson, S.B., Charlton, M., Rao, Y.R.,
nutrient-rich, illuminated inshore zones has mulations of toxic cyanobacteria (Plate 2), Howell, T., Ridal, J., Brownlee, B.,
likely contributed to the recent resurgence where the most common and resilient hepa- Marvin, C., and Millard, S. 2007. Off
of Cladophora and other filamentous algae, totoxin microcystin (MC) can reach lev- flavour in large waterbodies: physics,
and the proliferation of noxious mats of cya- els in excess of 300 μg MC L -1 (Watson chemistry and biology in synchrony Wat.
nobacteria such as Lyngbya along Lake Erie, et al., 2005). Outbreaks of intense earthy/ Sci. Technol. 55:1–8.
Michigan and Ontario shorelines. Rotting musty taste and odour (T&O) in drinking
algal mats clog intakes and wash up along and source water have also been occurring
shorelines and beaches, producing fetid in the Great Lakes basin (Watson et al.,
odours and providing a natural substrate for 2007). These are largely caused by geosmin
the growth of bacteria (including E. coli). and 2-MIB, produced by some cyanobacte-
ria and other non-algal taxa. Climate and
Harmful Algal Blooms (HABs) large-scale water movement play a key role
The attached algal/cyanobacterial prolif- in these T&O events by transporting off-
erations noted above are among the many shore pelagic T&O production by dispersed
‘Harmful Algal Blooms (‘HABs’)’ that and patchy distributions of cyanobacteria
occur across the Great Lakes. Not a new (Anabaena lemmermanii) to nearshore water
phenomenon, they are caused by both toxic treatment plant intakes (Rao et al., 2003).
and non-toxic blooms and are largely driven The strength of the annual downwelling
by excessive nutrient inputs from fertile and/ and associated T&O event varies among
or extensively developed watersheds. Severe years with the duration and persistence of
HABs in the last century were mitigated by east winds (Watson et al., 2007). In the
point source nutrient abatement beginning Northeast end of the lake (Kingston basin)
in the late ‘70s under the GLWQA, but and upper St. Lawrence River, prolonged
recently have resurged as a major concern in late summer T&O is produced annually
many in offshore and nearshore areas. These by both geosmin and MIB, derived from
events are generally associated with plank- attached cyanobacterial communities. n
1 0 • C a n a d i a n C I V I L E n g i n e e r • s u m m e r 2 0 1 0A house in Banda Aceh, Indonesia, destroyed
by the earthquake and tsunami.
Dan Palermo
Tsunami Loading of
PhD, P.Eng
Assistant Professor
Department of Civil Engineering,
University of Ottawa, Ottawa, ON
Ioan Nistor PhD, Ing. Near-Shoreline Infrastructure
Associate Professor
Department of Civil Engineering,
University of Ottawa, Ottawa, ON
Introduction induced by tsunami waves to assess the
Tsunami-generated waves are extreme risks for Canadian coastlines, which could
events. However, their impact on near- be affected by tsunami attack, and to design
shoreline infrastructure, including struc- structures to be used as evacuation centres.
tures, can be severe and their damaging
effects can significantly affect coastal com- Mechanisms of Tsunami Impact
munities for extended periods of time fol- Historically, tsunamis have occurred along
lowing the event. The risks associated with both the Atlantic and the Pacific coast-
tsunami hazard have increased due to the lines of Canada. Studies have indicated
significant development of coastal regions, that approximately 80% of tsunamis have
which are susceptible to tsunami flood occurred in the Pacific Ocean (Nistor and
waters. Structures are typically designed Murty, 2009), thus the western seaboard of
for gravity loads, wind loads, and earth- Canada is at risk of being affected by tsu-
quakes if located in seismic regions; how- nami. The intense seismic activity around
ever, tsunami-induced loading is generally the Pacific Ring of Fire combined with
not considered. Hence, it is important the capability of a tsunami to propagate
to understand the loading mechanisms over the entire ocean, make this region
É T É 2 0 1 0 • l ’ i n g é n i e u r C I V I L c a n a d i e n • 1 1particularly vulnerable to such phenomena. The bore moves as a result of the transfer of A
It is believed that coastal communities on momentum to the still water ahead of it. The
Vancouver Island, such as Tofino, are most speed of the bore depends on the initial wave
susceptible to tsunami. However, the 1964 height as well as on the inland topography and
Alaska Earthquake and Tsunami caused the roughness elements (dunes, trees, houses,
significant damage to Port Alberni, located etc.) of the coast. The tsunami-induced bores
at head of the Ablerni Inlet; demonstrating can easily reach speeds of several meters per
tsunamis can travel through inlets with second and heights of several meters. In the
destructive force. Furthermore, it is believed case of the rapidly rising tide, the magnitude of
that major cities on the west coast, such as the overall impact force has been reported to be
Vancouver and Victoria, would be sheltered slightly lower than that of the hydraulic bore.
by Vancouver Island from the full effect of
B
a tsunami generating in the Pacific Ocean. Tsunami-Induced Forces
The 2004 Indian Ocean Tsunami, however, Building codes, namely the 2005 National
provides evidence of the propagation of Building Code of Canada (NBCC, 2005),
tsunami waves as they diffract and refract do not explicitly consider tsunami load-
around islands. For example, the west coast ing, as it is understood that inland struc-
of Sri Lanka was severely affected by the tures can be protected by proper site
tsunami, even though it was not directly planning and site selection. Furthermore,
in the path of the initial tsunami waves. code developers consider tsunami to be
Tsunamis have also occurred along the a rare event with a long return period.
eastern seaboard of Canada, indicating that Therefore, forces generated by tsunami
this region may also be affected, possibly are often neglected in structural design
Figure 1: Tsunami-related structural damage:
by smaller tsunamis, in the future (Clague practice. Recent catastrophic events, (a) Pelluhue, Chile; (b) Phuket, Thailand (Nistor et al. 2009).
et al., 2003). however, (2004 Indian Ocean
Tsunami waves undergo a significant Tsunami; 2007 and 2009 Solomon (3) Hydrostatic Force: The hydrostatic
transformation as they approach the coast- Islands Tsunamis, and 2010 Chile force is generated by still or slow-moving
line. While in the open ocean, tsunami Tsunami) have brought to light the water. The force is calculated based on
waves are virtually unnoticeable and can destructive power of tsunami-induced a triangular pressure distribution. In the
only be detected using a complex array hydraulic bores on near-shoreline infra- case of a hydraulic bore, the hydrostatic
of submarine pressure transducers; their structure. Figure 1a illustrates damage to force is generally smaller in magnitude
appearance, however, changes dramatically masonry infill walls and reinforced con- than the impulsive and hydrodynamic force
as they approach the coastline. As water crete columns in Pelluhue, Chile after the components.
depth decreases towards the shoreline, the 27 February 2010 Tsunami, while Figure 1b (4) Debris Impact and Damming
rising ocean floor pushes up the tsunami is a photo of damage suffered by a reinforced Forces: Tsunami-induced bores traveling
waves resulting in a significant increase in concrete structure on the Island of Phuket, inland carry debris such as floating auto-
wave height relative to the wave height expe- Thailand following the 26 December 2004 mobiles, and floating pieces of buildings,
rienced in deep ocean waters. Concurrently, Indian Ocean Tsunami. drifting wood, boats and ships. The dam-
wave celerity, the speed at which the tsu- Nistor et al. (2009) and FEMA P646 ming force is the result of an accumulation
nami wave propagates, decreases, since it is (2008) provide a comprehensive review of of debris. The impact of floating debris can
a function of the water depth. Depending the force components that are associated induce significant forces on a structural ele-
on the submerged beach slope and char- with tsunami-induced hydraulic bores. A ment, leading to damage or collapse.
acteristics of the near-shore bathymetry, as brief description of each force component (5) Buoyant and Uplift Forces: The
tsunami waves advance towards the shore- follows: buoyant force acts through the centre of
line, they may either break close to the (1) Impulsive Force: The impulsive force mass of a submerged or partially submerged
shore and further flood the coastline in the is a short duration load generated by the ini- structure. Buoyancy has the effect of gen-
form of a rapidly advancing hydraulic bore tial impact of the leading edge of a tsunami erating uplift forces, thus contributing to
or, if the ocean bottom is steep, they flood bore. The calculation of the impulsive force stability problems by reducing the resistance
the coast in the form of a rapidly rising is subject to substantial uncertainty. of a structure to sliding and overturning.
tide that inundates the inland littoral area. (2) Hydrodynamic Force: The hydrody- The uplift forces can be further magnified
The mechanism of tsunami advancement namic force arises from the flow of the tsu- by hydrodynamic forces if the rapidly ris-
is different for each of these two cases. The nami bore around a building or structural ing water level is accompanied by a vertical
tsunami-induced hydraulic bore has the element. The force includes the effect of the flow velocity. This results in an additional
form of a highly turbulent, rapidly advanc- flow velocity on all sides of the structure vertical force.
ing wall of foamy water, which is character- and is assumed to be uniform. The pressure, (6) Gravity Forces: Drawdown of the
ized by a highly non-linear hydrodynamic therefore, is constant through the depth of tsunami-induced flooding can result in
pattern with significant air entrainment. the flow. retention of water on flooring systems. This
1 2 • C a n a d i a n C I V I L E n g i n e e r • s u m m e r 2 0 1 0A B
Figure 2: Tsunami Loading Combinations: (a) Initial Impact; (b) Post Impact (Nistor et al., 2009).
A B nents include: impulsive, hydrodynamic,
hydrostatic, debris impact and damming,
buoyant and uplift, and gravity. There is,
however, uncertainty in both the estimation
of the component forces, as well as the total
tsunami load that should be considered.
Future efforts, including experimental and
analytical studies, are being directed toward
a better understanding of the forces for
the design and evaluation of infrastructure
located in tsunami-prone areas. n
References
Clague, J.J., Munro, A., and Murty, T.
Figure 3: Experimental Program: (a) Rectangular Column; (b) Hydraulic Bore Impact on Rectangular Column. (2003). Tsunami hazard and risk
in Canadian. Natural Hazards, 28,
phenomenon imposes additional gravity in significantly higher forces than those pp. 433–461.
loading on the structure. based on earthquake ground motions. FEMA. (2008). Guidelines for design
The force components generated by Meanwhile, recent tsunami events have of structures for vertical evacuation
tsunami-induced hydraulic bores do not demonstrated that severe damage is experi- from tsunamis (FEMA P646). Federal
occur concurrently, thus, loading com- enced by non-engineering structures, while Emergency Management Agency,
binations are required to determine the damage to engineered structures is often Jessup. Md.
maximum tsunami force, which could be confined to non-structural components. NBCC. 2005. National Building Code of
incorporated in building codes and com- Thus, improved estimates of tsunami flow Canada (NBCC). National Research
bined with other loads. Nistor et al. (2009) velocities corresponding to design tsunami Council of Canada, Ottawa, Ottawa,
and FEMA P646 (2008) provide detailed heights are required to estimate tsunami Canada.
discussion of various proposed loading com- design forces with confidence. The design Nistor, I., Palermo, D., Nouri, Y., Murty,
binations. Figure 2 provides two proposed tsunami load can then be incorporated in T., and Saatcioglu, M. 2009. Tsunami-
loading combinations: Initial impact, which load cases adopting the philosophy of seis- induced forces on structures. In Kim,
includes the combined effect of the impul- mic loading, which is based on an extreme Y.C. (ed.), Handbook of Coastal and
sive, Fs, and debris impact, Fi , forces; and event, as proposed by Palermo et al. (2009) Ocean Engineering, World Scientific,
Post Impact, which includes debris impact, as a preliminary framework. Experimental pp. 261–286.
Fi, hydrodynamic, Fd , hydrostatic, FHS , and research is currently ongoing to understand Nistor, I., and Murty, T. (2009). Tsunami
buoyant, Fb, forces. The initial impact con- and assess the various force components risk for the Canadian coastlines. Proc.
siders the first arrival of the leading edge and flow velocities associated with hydraulic WCCE-ECCE-TCCE Earthquake and
of the tsunami bore, while the post impact bores (Nouri et al., 2010). Tsunami Conference, Istanbul, Turkey,
results from the quasi-steady state flow of CD-ROM, 12 p.
the bore following the initial impact. The Summary Nouri, Y., Nistor, I., Palermo, D., and
tsunami design force is the maximum force Recent catastrophic tsunamis have empha- Cornett, A. (2010). Experimental inves-
determined from the two combinations. sized the destructive power of tsunami- tigation of tsunami impact on free
induced hydraulic bores as they propagate standing structures. Coastal Engineering
Current Research overland and impact near-shoreline infra- Journal, 52(1), pp. 43–70.
The estimation of a tsunami design load structure. As a result, research has ini- Palermo, D., Nistor, I., Nouri, Y., and
is dependant on the height of the tsunami tiated to improve our understanding of Cornett, A. (2009). Tsunami loading
bore and the corresponding flow veloc- the forces associated with tsunamis and of near-shoreline structures: A primer.
ity. Current estimates of tsunami design the interaction between tsunami-induced Canadian Journal of Civil Engineering,
forces can be excessive and often result bores and infrastructure. The force compo- 36(11), pp. 1804–1815.
éT É 2 0 1 0 • l ’ i n g é n i e u r C I V I L c a n a d i e n • 1 3Storm Surges in Canada
INTRODUCTION
Storm surges occur on the coastlines of Atkinson (just west of West Vancouver),
Canada, mainly from extra tropical cyclones Little River (north of Comox) and Seattle.
(winter storms) and also from remnants of Studies by Crawford et al. (2000) on the
hurricanes travelling generally from the effects of winds, high tides and El Niño
USA. Occasionally, meso-scale weather sys- Southern Oscillation (ENSO) on erosion
tems also can generate surges and seiches. and coastal flooding indicated that such
Storm surges have been observed in the specific processes also contributed to the
following areas, which is not necessarily an damage.
exhaustive list: Atlantic and Pacific coasts,
Gulf of St. Lawrence and St. Lawrence SURGES ON THE EAST COAST
Estuary, Bay of Fundy, the Great Lakes, Along the Atlantic coast, storm surges
Lake Winnipeg, Hudson Bay, Beaufort Sea, are often associated with vigorous north-
Tad Murty PhD Strait of Georgia, Juan de Fuca Strait and eastwardly extra-tropical cyclones off the
Department of Civil Engineering, University of Ottawa, the Arctic Coast (Murty, 1984; Gönnert American seaboard. They can be character-
Ottawa, ON et al., 2001). ized by very strong south-easterly to easterly
Mahmoud Al-Riffai PhD Candidate surface pressure gradients over a large area
Department of Civil Engineering, University of Ottawa, SURGES ON THE WEST COAST whereas during the time of peak surge, the
Ottawa, ON During summer, surface winds off the coast low pressure center is within two degree of
Ram Yerubandi PhD of British Columbia are from the northwest, latitude of Halifax. Although storm surges
National Water Research Institute, Canada Centre for Inland whereas during winter they are from the above 0.6 m are uncommon at Halifax, they
Waters, Environment Canada, Burlington, ON southeast. Due to the effect of geostrophic occur on average twice per year (Parkers
adjustment of wind-induced water currents, et al., 1997).
mean sea levels off the coast, thus, tend to Table 1 lists the maximum positive and
be higher in winter than in summer. Sea negative storm surge amplitudes in the
levels also increase in the Strait of Georgia Atlantic Coast, Gulf of St. Lawrence and
due to the outflow of the Fraser River, the St. Lawrence Estuary, sorted generally
which is at a maximum in late spring. by province.
Nevertheless, winter remains to be the sea-
son of concern for storm surges due to high SURGES ON THE GREAT LAKES
astronomical tides as well as for high mean The Laurentian Great Lakes of North
levels from storms. America have horizontal scales of hundreds
The case study of 14–19 December 1982 of kilometers and depth scales of hundreds
is described in Murty et al. (1995). The of meters. The human settlements around
low pressure sea-level system (Figure 1) the Great Lakes are marked by structures
was traced moving towards the east along designed to stabilize shorelines and protect
40° N to longitude 140° W then climb- properties from flooding and erosion. The
ing northeast just west of the north tip of Great Lakes coast consists of several com-
Vancouver Island (50° N, 130° W) where mercial and small craft navigation ports
it moved northwest parallel to the British and industrial and municipal structures.
Columbia coast. On 16 December 1982, at This coastal zone is affected by a wide range
0600 UTC, the lowest central pressure was of natural hazards including storm induced
966 hPa, about 550 km (47° N, 132° W) surges and associated flooding. Some of the
west of the coast of Washington State. coastal areas of the Great Lakes are particu-
Figure 2 shows the observed surge heights larly vulnerable to bluff erosion associated
reaching 0.9 m to 1.0 m at Victoria, Point with storm surges during high water levels.
1 4 • C a n a d i a n C I V I L E n g i n e e r • s u m m e r 2 0 1 0170ºW 160ºW 150ºW 140ºW 130ºW Model Observed VICTORIA
Surge (cm)
60ºN
(983) Bella Bella POINT ATKINSON
50ºN
Surge (cm)
(973)
(966)
(972)
(976) (970)
40ºN LITTLE RIVER
(992) (984)
Surge (cm)
30ºN
Legend NB: Central pressure indicated between brackets
Date Time (e.g. (970) is 970 hPa) SEATTLE
N
14-Dec-82 0000
15-Dec-82 0600 W E
0 500 1,000 2,000 km
Surge (cm)
1200
16-Dec-82 S
1800
Figure 1: Cyclone track that generated a surge on BC coast (after Murty et al., 1995).
In terms of coastal dynamics, the Great In general the maximum surges occur at
Lakes behave much like many inland seas the eastern and western ends of Lake Erie December 1982
and exhibit physical processes characteris- and shallow basins of other Great Lakes, Figure 2: Observed and modelled surges at selected
tic of the coastal oceans. Because of shal- which are exposed to long distances of water locations on North American Pacific coast (after Murty
low nature of these lakes, the wind action surface across which storm winds blow. In et al., 1995).
on coastal waters rapidly generates wind one example, Hamblin (1987) described wind cessation, can also have a signifi-
waves and water level fluctuations associ- the surge of 6 April 1979, which had the cant impact on the nearshore circulation in
ated with strong currents. When a steady largest recorded set-up between Buffalo and some of the Great Lakes. Each lake has its
wind blows along the lake, the equilibrium Toledo of 4.5 m. In one of the historical own characteristic period of oscillation for
condition of the water surface is a depres- analysis of several storm surges in the Great the fundamental (unimodal) seiche and
sion (set-down) along the upwind end, and Lakes, Murty et al. (1995) discussed about higher harmonics. The period of oscillation
increase of elevation (storm surge) along the the wide spread destruction in terms of depends on the size of the lake and its mean
downwind end of the lake. Storm surges significant human and infrastructure losses depth. Lake Erie has the largest amplitudes
in the Great Lakes have been described caused by storm surges. Table 2 provides of seiches (> 3 cm) and longest periods
among others by Rao and Schwab (1976) examples of storm surge potential along among all the Great Lakes. Platzman and
and Murty et al. (1995). Storm surges on the Canadian and the U.S. shores of the Rao (1964) pioneered the prediction of
the Great Lakes range from 0.3 m to 2 m Great Lakes. seiches using a one-dimensional numeri-
in height, with larger surges occurring dur- Because of the frequent passage of cal model to Lake Erie. More recently two
ing fall (Sept–Nov) storms. A typical storm storms through the Great Lakes region, the and three-dimensional models are devel-
surge is associated with a strong cyclonic lakes are often subject to sustained strong oped to accurately depict the structure and
disturbance traveling from southwest to winds. Surface seiche, which is the oscil- amplitude of lake surface oscillations for all
northeast and centered on the Great Lakes. latory response of the lake surface after the lakes. n
continued on page 21
Table 1: Extreme positive and negative storm surges in eastern Canada during 1965–1975 (Murty et al., 1995).
Maximum Storm Surge (cm) Table 2: Possible storm induced rise in water level (cm).
Atlantic Province Water Body Positive Surge Negative Surge Return Period (yrs)
New Brunswick Gulf of St. Lawrence 130 170 Station 10 50 100
Nova Scotia Gulf of St. Lawrence 110 130 Port Weller 38 83 115
Newfoundland Gulf of St. Lawrence 110 120 Burlington 53 79 94
Labrador Labrador Sea 100 120 Kingston 46 60 66
PEI Gulf of St. Lawrence 130 140 Buffalo 180 231 254
Quebec St. Lawrence Estuary 270 230 Toledo 106 132 144
É T É 2 0 1 0 • l ’ i n g é n i e u r C I V I L c a n a d i e n • 1 5Vous pouvez aussi lire


