Description of the Cirad wood collection in Montpellier, France, representing eight thousand identified species - Agritrop
←
→
Transcription du contenu de la page
Si votre navigateur ne rend pas la page correctement, lisez s'il vous plaît le contenu de la page ci-dessous
Bois et Forêts des Tropiques – ISSN : L-0006-579X
                                                                                                          Volume 339 – 1er trimestre – janvier 2019 – p. 7-16
                                                                                                            LA COLLECTION DE BOIS DU CIRAD / LE POINT SUR…      7

                                                    Description of the Cirad wood
                                                  collection in Montpellier, France,
                                                    representing eight thousand
                                                          identified species

Patrick Langbour1, 2
Sébastien Paradis1, 2
Bernard Thibaut3

1
  CIRAD
UPR BioWooEB
34398 Montpellier
France

2
 BioWooEB
Univ Montpellier, CIRAD
Montpellier
France

3
 LMGC
Univ Montpellier
CNRS
Montpellier
France

Auteur correspondant /
Corresponding author:
Bernard Thibaut –                                          Image of the wood collection (Xylotheque): open drawer with 3 rows of specimens.
bernard.thibaut@umontpellier.fr

Doi : 10.19182/bft2019.339.a31709 – Droit d’auteur © 2018, Bois et Forêts des Tropiques – © Cirad – Date de soumission : 20 juin 2018 ;
date d’acceptation : 9 octobre 2018 ; date de publication : 31 janvier 2019.

                                                                                 Citer l’article / To cite the article
                                                                                 Langbour P., Paradis S., Thibault B., 2019. Description of the Cirad wood
                    Licence Creative Commons :                                   collection in Montpellier, France, representing eight thousand identi-
                    Attribution - Pas de Modification 4.0 International.         fied species. Bois et Forêts des Tropiques, 339 : 7-16. Doi : https://doi.
                    Attribution-NoDerivatives 4.0 International (CC BY-ND 4.0)   org/10.19182/bft2019.339.a31709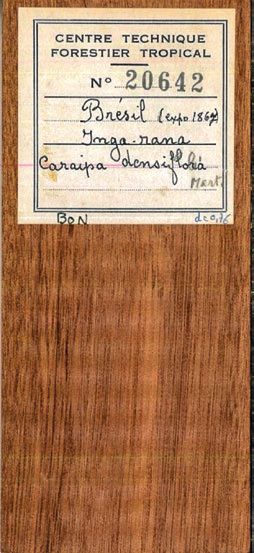
Bois et Forêts des Tropiques – ISSN: L-0006-579X
    Volume 339 – 1st quarter - January 2019 - p. 7-16
8   FOCUS / THE CIRAD WOOD COLLECTION

                                                                                                        P. Langbour, S. Paradis, B. Thibaut

                           RÉSUMÉ                                      ABSTRACT                                      RESUMEN

          Description de la xylothèque du Cirad            Description of the Cirad wood collection     Descripción de la colección de madera
          à Montpellier, France, regroupant huit           in Montpellier, France, representing         Cirad en Montpellier, Francia, que
          mille espèces identifiées                        eight thousand identified species            representa ocho mil especies identificadas

          La xylothèque du Cirad est composée              The CIRAD wood collection, which             La colección de madera del Cirad consiste
          d’échantillons provenant de 34 395 arbres        was first awarded funding 80 years           en muestras de 34 395 árboles, 235 fami-
          issus de 123 pays, appartenant à 235 familles,   ago, now consists of specimens from          lias, 2 160 géneros y 8 385 especies (60 %
          2 160 genres et 8 385 espèces (dont 60 %         34,395 trees, 235 families, 2,160 genera     de los cuales están representados por
          sont représentées par plus d’un spécimen         and 8,385 species (of which 60% are          más de una muestra por árbol) de 123
          par arbre). Les espèces d’Afrique, d’Asie        represented by more than one speci-          países. Las especies tropicales de África,
          et d’Amérique représentent 85 % de la            men per tree) from 123 countries. Tropi-     Asia y Sudamérica constituyen el 85 % de
          collection. Une description botanique des        cal species from Africa, Asia and South      la colección. Se han realizado descripcio-
          familles, genres et espèces les plus repré-      America make up 85% of the collection.       nes botánicas de las familias dominan-
          sentés a été faite dans les dix régions géo-     Botanical descriptions have been made        tes, géneros y especies en diez regiones
          graphiques pour lesquelles il y a suffisam-      of the dominant families, genera and         geográficas para las cuales hay coleccio-
          ment d’échantillons (plus de 1 000). Ces         species in the ten geographical regions      nes suficientemente grandes (más de
          régions comprennent neuf régions tropi-          for which there are large enough collec-     1 000 muestras). Estas regiones incluyen
          cales ou subtropicales et une grande entité      tions (1,000+ specimens). These regions      nueve regiones tropicales o subtropicales
          appelée « Climat Froid du Nord » (NCC), qui      include nine tropical or subtropical         y una gran entidad llamada «Clima frío del
          couvre tous les pays de l’hémisphère nord        regions and a large entity called “Nor-      norte» (NCC), que abarca todos los países
          ayant une saison froide marquée (climats         thern Cold Climate” (NCC), which covers      del hemisferio norte con una estación fría
          boréal, alpin tempéré et méditerranéen).         all northern hemisphere countries with       (climas boreal, alpino templado y medi-
          Les neuf régions tropicales et subtropi-         a cold season (boreal, alpine temperate      terráneo). Las nueve regiones tropicales
          cales ont plus ou moins les mêmes familles       and Mediterranean climate). The nine         y subtropicales tienen más o menos las
          dominantes, mais différents genres domi-         tropical and subtropical regions have        mismas familias dominantes, pero dife-
          nants alors que les familles dominantes          more or less the same dominant fami-         rentes géneros dominantes; mientras que
          dans l’entité NCC diffèrent largement. La        lies but different dominant genera, while    las familias dominantes en la entidad NCC
          collection est décrite dans une base de          dominant families in the NCC entity differ   difieren ampliamente. La colección se
          données spécifique : échantillons de bois,       widely. The collection is described in a     describe en una base de datos específica:
          sections et photographies avec leurs noms        specific data base: wood specimens,          muestras de madera, secciones y fotogra-
          et provenance. La densité a été mesurée          sections and photographs with their          fías con su nombre y proveniencia. La gra-
          pour les deux tiers des spécimens (6 750         name and provenance. Specific Gravity        vedad específica (SG) se ha medido en los
          espèces). Dans l’ensemble, les valeurs de        (SG) has been measured in two thirds         dos tercios de las muestras (6 750 espe-
          la densité ont une distribution presque nor-     of all the specimens (6,750 species).        cies). Globalmente, los valores SG tienen
          male dans une plage de 0,04 à 1,36, avec         Overall, SG values have a near normal        una distribución casi normal en el rango
          une médiane de 0,72 et un coefficient de         distribution ranging from 0.04 to 1.36,      de 0,04 a 1,36, con una mediana de 0,72 y
          variation (CV) de 28 %. La différence entre      with a median value of 0.72 and a 28%        un coeficiente de variación del 28 % (CV).
          régions, quant à la distribution de la den-      coefficient of variation (CV). The diffe-    La diferencia entre las regiones en una dis-
          sité, est assez faible (valeurs moyennes         rence between regions in specific gravity    tribución de gravedad específica es bas-
          variant de 0,66 à 0,76) avec un CV sys-          distribution is quite small (mean values     tante pequeña (valores medios de 0,66 a
          tématiquement élevé (26 % à 32 %). En            0.66 to 0.76) with a consistently high       0,76) con un CV consistentemente elevado
          examinant les familles, genres et espèces        CV (26% to 32%). Looking at the best         (26 % a 32 %). Mirando las familias mejor
          les mieux représentés, le CV moyen pour          represented families, genera and spe-        representadas, géneros y especies, el CV
          les familles (26 %) est similaire à celui        cies, the mean CV for families (26%) is      medio para las familias (26 %) es similar
          des régions et beaucoup plus bas pour les        similar across regions and much lower        en todas las regiones y mucho más bajo
          genres (18 %) et espèces (13 %). L’éven-         for genera (18%) and species (13%). The      para los géneros (18 %) y especies (13 %).
          tail des densités augmente de la famille         SG range increases from family to genus      El rango SG aumenta de familia a género y
          au genre et à l’espèce (0,53 à 0,86, 0,46        to species (0.53 to 0.86, 0.46 to 0.95,      a especie (0,53 a 0,86, 0,46 a 0,95, 0,23
          à 0,95, 0,23 à 1,07 respectivement). Dans        0.23 to 1.07 respectively). The different    a 1,07 respectivamente). En el artículo se
          l’article, les différents usages actuels et      current and potential uses of the wood       analizan los diferentes usos actuales y
          potentiels de la xylothèque sont discutés.       collection are discussed.                    potenciales de la colección de madera.

          Mots-clés : xylothèque, espèces, genres,         Keywords: xylotheque, species, genera,       Palabras clave: xiloteca, especies,
          familles, provenance, densité du bois,           families, provenance, wood density,          géneros, familias, proveniencia,
          collection de bois, base de données de           wood collection, wood database,              densidad de la madera, colección de
          bois, espèces tropicales, France.                tropical species, France.                    madera, base de datos de madera,
                                                                                                        especies tropicales, Francia.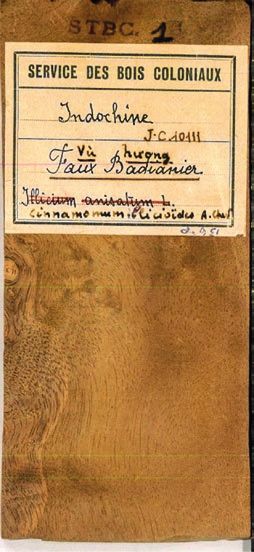
Bois et Forêts des Tropiques – ISSN : L-0006-579X
Volume 339 – 1er trimestre – janvier 2019 – p. 7-16
LA COLLECTION DE BOIS DU CIRAD / LE POINT SUR… 9
History and scope to help the huge building effort and the high demand of
timber in France after the first and second World Wars;
to cope with the large population growth after the second
The CIRAD wood collection (Xylotheque) was establi- World War;
shed rather recently (in 1937) when compared to other wood to help in the development of wood industries in new inde-
collections (Stern 1988; Cornish et al., 2014; Lens, 2016), pendent countries at the beginning of the sixties.
by Didier Normand, head of the wood anatomy laboratory At the outset, Didier Normand and other scientists took
at the former STBC (Section Technique des Bois Coloniaux or a pragmatic approach based on a reference number (CTFT
Colonial Wood Technical Section) at Nogent-sur-Marne, near id) given to trees (or logs from this tree) that were delivered
Paris, France (Norman et al., 2017). STBC was replaced by to the CTFT facilities (sawmill and carpentry workshop). The
CTFT (Centre Technique Forestier Tropical or Tropical Forest numbers are given in ascending order from the beginning
Research Institute) in 1949, and then became part of CIRAD (1 to 34,395). This CTFT id. is the common reference for all
(Centre de Coopération Internationale en Recherche Agrono- wood specimens derived from the same tree, for the different
mique pour le Développement or French Agricultural Research wood property measurements including a group of “anato-
Centre for International Development) in 1985. Alain Mariaux mical” specimens (usually 10 per tree). The first specimens
and Pierre Détienne were the subsequent curators of the (CTFT id. from one to some hundreds) were specimens from
Xylotheque, which was transferred to Montpellier in 1994. older collections when species identification was certified.
Systematics were not the primary objective for Cirad ins- The reference number was decided by the wood anatomy
titution, although D. Normand and P. Détienne could be qua- laboratory in relation to botanical identification, usually with
lified as systematic wood anatomists. There was a close coo- Paris and Cayenne herbariums, and associated vouchers are
peration between them and the National Museum in Paris (Le positioned in these herbariums1. For each of these CTFT ids
Bras et al., 2017) where most of the herbarium vouchers asso- there is a reference wood specimen (photos 1) in the basic
ciated with wood specimens are stored. For the trees coming collection (photos 2). Other anatomical specimens from the
from French Guyana, herbarium vouchers are stored in the same tree (duplicates) are stored in a backup wood collec-
Cayenne herbarium (IRD), and there is a Xylotheque annex in tion usable for exchanges and further scientific works.
the CIRAD wood laboratory in Kourou (French Guiana). 1
It should be noted that not all trees (CTFT id) have an
There was a strong collecting effort between 1950 and identified associated voucher. This is the case for i) some
1990 related to a general striving for knowledge and use of samples coming from exchanges, ii) trees in great number
from a same species, iii) other cases when identification was
woods from the former French colonies in order: guaranteed for well known species, often from temperate
countries. The information is given in the data base.
Photos 1.
Sample pictures: CTFT id. 1, 20642 and 34395.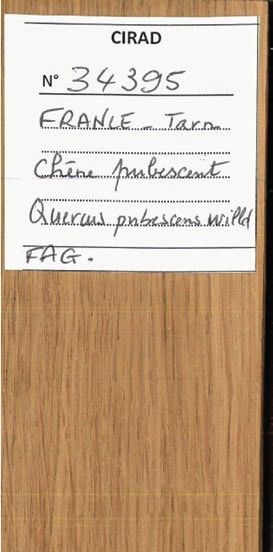
Bois et Forêts des Tropiques – ISSN: L-0006-579X
Volume 339 – 1st quarter - January 2019 - p. 7-16
10 FOCUS / THE CIRAD WOOD COLLECTION
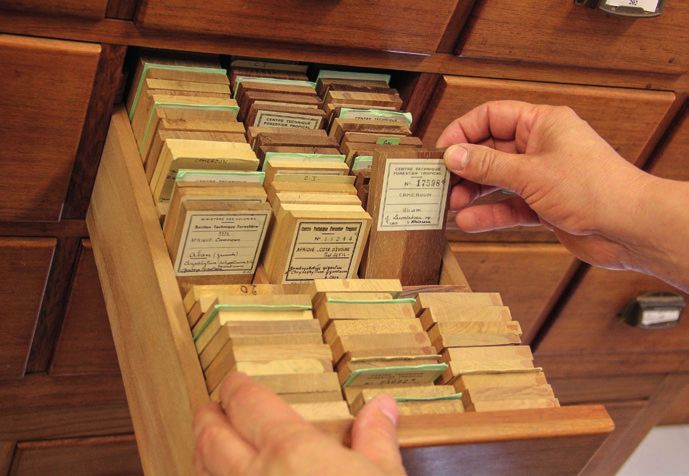
Photos 2.
Images of the wood collection (Xylotheque). Top left: drawer chest with the reference collection. Top right: open drawer
with 3 rows of specimens. Bottom left: drawers with complementary specimens. Bottom right: drawer with slide collection.
Description of the collection There is also a similar number of off-cuts, portions of stan-
dard specimens after sectioning or sub-sampling operations
There are no specimens from shrubs or lianas in the col- for different uses (photos 2).
lection, with very few exceptions. The very large majority are For most of the species, there are sections (7,007 micros-
standard specimens (13 cm x 6 cm x 1 cm) with a label bearing cope slides) for transmitted light microscopy in the 3 stan-
the CTFT id., country of origin, botanical name and, sometimes, dard planes (TS, RLS and TLS). Around 3,000 micro photos at
information on the origin (collector), the local name of the tree, x25 magnification taken from these sections are stored in the
and specific gravity of the specimen (photos 1 and 2). same place (photos 2).
In all, there are 34,395 specimens (CTFT id.) in the col- For rapid identification with the aid of a lens or ste-
lection (table I) with 235 identified families, 2,160 identified reo-microscope, small oriented cubes (1 x 1 x 1 cm) for
genera and 8,385 identified species. Only 71 specimens around 70% of the collection are stored by CTFT id.
(0.2%) are unidentified at family level and 281 specimens Filing cards with extensive information are available for
(0.8%) are identified only at family level (47 families). The each reference specimen.
number of specimens (trees) unidentified at the species level
is much higher: 4,477 specimens (13%) from 779 genera. For Database
the majority of trees not fully identified there is a majority of
associated vouchers, more or less the same proportion as for All the informative data and metadata on the collec-
fully identified ones. This happens mostly in families (Laura- tion are recorded in digital files since 1980; the process
ceae for example) or genera (Ocotea, Ravensara for example) was initiated by Mariaux and Narboni (1996). The data files
whose determination is difficult and many vouchers in herba- are regularly updated with: new specimens, change of bota-
rium are still waiting to be identified. The consultation from nical name due to nomenclature changes or revised iden-
Paris and Cayenne herbariums makes it possible to progress tification of the herbarium voucher or the wood specimen.
on the reference of partially identified specimens. Reference web sites as Tropicos2 or INPI3 (International Plant
For around 60% of the species there is at least one Names Index) are mostly used.
duplicate specimen (from 1 to 9 specimens per CTFT id.)
stored in the supplementary collection. They can be used 2
Topicos database: http://www.tropicos.org)
for further analysis in different fields (including destructive 3
INPI (International Plant Names Index)
tests if necessary) or for exchanges with other collections. database: https://www.ipni.org)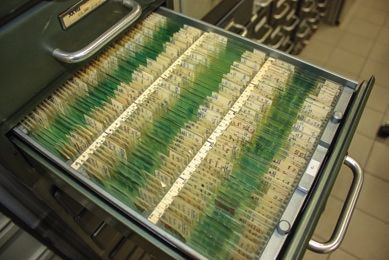
Bois et Forêts des Tropiques – ISSN : L-0006-579X
Volume 339 – 1er trimestre – janvier 2019 – p. 7-16
LA COLLECTION DE BOIS DU CIRAD / LE POINT SUR… 11
Table I.
General description of the collection.
Collection Global Gymno Angio Identified SG ident. H. voucher Duplicate
Sample 34,395 931 33,364 28,566 19,289 18,620 18,221
Family 236 5 231 235 205 207 193
Genus 2206 42 2164 2,160 1,809 1,822 1,576
Species 9,213 250 8,963 8,355 6,570 6,777 5,308
Global: all CTFT references; Gymno: gymnosperm references; Angio: angiosperm references; Identified: totally identified sample
at species level; SG ident.: identified sample with specific gravity (SG) measurement; H. voucher: sample associated to herbarium
voucher; Duplicate: CTFT reference with at least one replicate; Sample: number of CTFT references; Family: number of documented
family; Genus: number of documented genus; Species: number of documented species.
Geographical distribution
of the specimens
There are 6 tables within the database: All continents except the Antarctic are represented.
a collection table, which is merely a transcription of regis- Africa has the largest number of specimens (45.8%) followed
tering notebooks with 10 fields: CTFT id., country of prove- by South America (30.5%), Asia (13.4%), Oceania (4.4%),
nance, local name, codified botanical identification (3 let- North America (4.0%) and Europe (1.9%). There are speci-
ters and 9 figures), herbarium voucher occurrence, duplicate mens from 123 countries. The Republic of France, including
specimen number, technological test, collector or collection Metropolitan France (Europe) and French overseas depart-
origin (name + code), and other information; ments and territories, such as French Guiana, Guadeloupe,
a family table with 2 fields: codified family (3 letters) and Martinique, Reunion Island, New Caledonia and French
full name of the family; Polynesia, accounts for the largest number of specimens
a species table with 2 fields: codified botanical name com- (6,120 including 3,654 from French Guiana) with around
posed of 9 characters (3 letters for the family, 3 figures for 1,500 native species and 100 exotic species (plantations).
the genus and 3 figures for the species) and full scientific The top ten countries considering the total number of
denomination of the species; specimens are France (17.9%), Madagascar (9.9%), Came-
a provenance table (country) with 3 fields: codified country, roon (7.3%), Gabon (6.7%), Ivory Coast (5.4%), Republic
name of the country, name of continent or subcontinent (list of the Congo (5.3%), Brazil (5%), Vietnam (3%), Ecuador
of 9 different names); (2.8%) and Suriname (2.6%).
a density table (specific gravity) with 2 fields: CTFT id. and Overall, 88% of the specimens can be described as tro-
specific gravity of the item measured more or less under pical wood from dry or rain forests in Africa, Asia, America
standard climatic conditions (around 20 °C and 65% RH); and Oceania. Temperate or Mediterranean species account
a complementary table with 9 fields: CTFT id., storing for the remaining 12%.
address of associated reference slide, storing address of In order to go further in the description of the collec-
associated 2nd slide, storing address of associated 3rd slide, tion, it was decided to separate the tropical and sub-tropical
technological test number, presence of x25 magnification regions into 9 geographical entities accounting for a great
photos in TR plane, occurrence of both x25 magnification number of specimens: Tropical East Africa (AfEst, 873 spe-
photos in the 3 standard planes and x55 magnification cimens), Tropical West Africa (AfTH, 9,668 specimens),
photos in TLS plane, presence of supplementary section Tropical Asia (AsTH, 2,842 specimens), Tropical America
associated with the technological test, presence of left over (AmTH, 8,300 specimens), Tropical Isles from the Indian
materials. Ocean (Mada, 3,851 specimens), Tropical Isles from the
For the data associated to this paper (2 tabular files in Caribbean sea (Cara, 1,424 specimens), Sub-tropical North
CSV format in open access) most of important information Africa (AfSA, 922 specimens), Indian sub-continent (India,
including herbarium vouchers are kept, but not some data 780 specimens), and Oceania (Ocea, 1,526 specimens).
as the place where you can find photographs or sections. Boreal, temperate and Mediterranean forests from the nor-
thern hemisphere have been grouped in a large entity called
“Northern Cold Climate” (NCC, 2,788 specimens).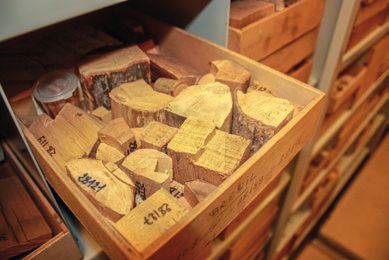
Bois et Forêts des Tropiques – ISSN: L-0006-579X
     Volume 339 – 1st quarter - January 2019 - p. 7-16
12   FOCUS / THE CIRAD WOOD COLLECTION

                         Table II.
                         Top ten families and total number of families for the different regions. In blue, global top ten families.

               Family Order            Total       NCC     AfEst      AfSa       Af TH       AmTH       AsTH      Cara       India     Mada       Ocea

                1                     CES          PIN     CES        MIM        CES         CES        DIP       MEL        MIM        LAU       MYT
                2                     MIM          FAG     MIM        CES        MEL         FAB        CES       LAU        FAB        FAB       MIM
                3                     FAB          ROS     COB        FAB        MAL         LAU        MEL       FAB        COB        SAP       MEL
                4                     LAU          BET     FAB        COB        SAP         MIM        LAU       RUB        MEL        MAL       LAU
                5                     MEL          CUP     RUB        MEL        MIM         SAP        MAL       MYT        CES        MEL       SPI
                6                     SAP          SPI     EUP        MAL        RUB         LEC        ANA       CES        MOR        RUB       RUB
                7                     MAL          LAU     MEL        MYT        ANO         MOR        FAB       MIM        RUB        SPI       MAL
                8                     RUB          SAL     PHL        PHL        BUR         CHR        FAG       SAP        PIN        MYT       SAP
                9                     MYT          FAB     MAL        ANA        EUP         MAL        SAP       MAL        DIP        MIM       CAH
                10                    MOR          OLE     PRO        MOR        COB         VOC        MYT       BIG        MYT        CLU       PRO
                Nb Families           235          136      85         57        104         131        110        90         80        109        93

                         ANA: Anarcadiaceae; BET: Betulaceae; BIG: Bignoniaceae; CAH: Calophyllaceae; CES: Caesalpinoideae; CHAR: Chrysobalanaceae;
                         CLU: Clusiaceae; COB: Combretaceae; CUP: Cupressaceae; EUP: Euphorbiaceae; FAB: Fabiodeae; FAG: Fagaceae; LAU: Lauraceae;
                         LEC: Lecythidaceae; LEC: Lecthidaceae; MAL: Malvaceae; MEL: Meliceae; MIM: Mimosoideae; MOR: Moraceae; MYT: Myrtaceae;
                         OLE: Oleaceae; PHL: Phyllanthaceae; PIN: Pinaceae; PRO: Proteaceae; ROS: Rosaceae; RUB: Rubiaceae; SAL: Salicaceae;
                         SAP: Sapotaceae; SPI: Sapindaceae; VOC: Vochysiaceae; AfEst: Tropical East Africa; AfTH:Tropical West Africa; AsTH: Tropical Asia
                         Tropical; AmTH: Tropical America; Mada: Tropical Isles from the Indian Ocean; Cara: Tropical Isles from the Caribbean sea;
                         AfSA: Sub-tropical North Africa; India: Indian sub-continent; Ocea: Oceania; NCC: Northern Cold Climate.

                     There is a clear over representation of former French               Mediterranean forests (Faboideae and Lauraceae, for exa-
               overseas regions and former colonies in Africa, America and               mple). Looking at the top ten families in each of the 10 geo-
               Oceania. The ten geographical entities that will be described             graphical entities, NCC has a clearly different group with only
               are not representative of any ecological biome but just facili-           20% of families present in the global top ten, while all tropi-
               ties for the collection description.                                      cal and sub-tropical regions have between 60% and 90% of
                                                                                         the most frequent families.
                                                                                               In the boreal, temperate, Mediterranean and sub-tropi-
                              Botanical distribution                                     cal forests of the northern hemisphere (NCC), Fagaceae and
                                of the specimens                                         Pinaceae clearly dominate and it is the only region where
                                                                                         gymnosperms are abundant. Between the 9 regions where
                     The botanical classification used is the one pre-                   tropical families dominate, there are some differences, and
               sented by Stevens (2017) on the Missouri Botanical Garden                 4 regions do not have one of the top 3 for their own top family:
               website4.                                                                 South-East Asia where Dipterocarpaceae dominate, Mada-
                     Gymnosperms account for only 1,036 specimens,                       gascar, Carribean and Oceania where it is the Lauraceae,
               6 families, 53 genera and 286 species (between 2% and 3%                  Meliaceae and Myrtaceae which dominate, respectively.
               of the total in each category).                                                 Looking at genera (table III), their total number is always
                     There are only 56 families with more than 100 speci-                large (> 300) except for the “smaller” regions (AfEst, AfSa
               mens (24% of the families) but they account for 90% of the                and India). Within the top ten genera at global or regional
               total number of specimens. The Leguminosae family (Mimo-                  level, the differences are much greater than for the families,
               soideae, Caesalpinioideae and Faboideae sub families) is                  and no genus is the top one in more than one region. Most of
               grouping more than 4,000 specimens (20% of all the spe-                   these top ten consist of genera comprising numerous impor-
               cimens). The Meliaceae, Lauraceae, Sapotaceae and Malva-                  tant commercial timbers, often emblematic of their region,
               ceae also amount to more than 1,000 specimens.                            such as Quercus, Pinus, Acacia, Eucalyptus, Swietenia or
                     Within the top ten families (or sub families) at global             Khaya, Diospyros, Shorea, Entandophragma, or Dalbergia.
               level (table II), there are only a few major tropical fami-                     The top 10 genera in the column “Total” have colors
               lies which have some representatives in temperate or                      which are kept in the regional columns in order to see whether
                                                                                         they are still present in the top 10 genera of this region.
                 4
                   Missouri Botanical Garden website:
                https://www.mobot.org/MOBOT/research/APweb/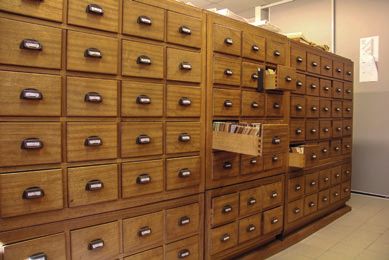
Bois et Forêts des Tropiques – ISSN : L-0006-579X
                                                                                                                Volume 339 – 1er trimestre – janvier 2019 – p. 7-16
                                                                                                                  LA COLLECTION DE BOIS DU CIRAD / LE POINT SUR…      13

         Table III.
         Top ten genera and total number of genera for the different regions. The top 10 genera in the column “Total” have colors which are kept
         in the regional columns in order to see whether they are still present in the top 10 genera of this region.

Order      Total             NCC            AfEst         AfSa         AfTH        AmTH            AsTH           Cara           India          Mada           Ocea

1        Terminalia      Quercus          Combretum      Albizia    Entandrop.     Licania         Shorea      Swietenia      Terminalia      Dalbergia      Eucalyptus
2        Diospyros         Pinus             Acacia       Acacia    Terminalia   Pouteria       Dipterocar.     Zanthoxy.       Acacia        Ravensara     Acacia
3         Dalbergia        Acer           Brachystegia Pterocarpus Dacryodes       Ocotea          Hopea        Tabebuia       Syzygium      Cryptocarya Calophyllum
4          Albizia         Picea          Pterocarpus   Daniellia   Diospyros       Inga         Syzygium         Cordia       Dalbergia        Ocotea    Syzygium
5          Ocotea          Abies           Entandrop.      Ficus      Xylopia   Eschweilera      Diospyros       Sloanea        Albizia        Syzygium Elaeocarpus
6        Entandrop.       Prunus            Monotes    Combretum       Celtis    Swartzia       Parashorea     Byrsonima         Ficus       Symphonia Cryptocarya
7          Quercus       Fraxinus            Albizia      Khaya     Gilbertiod.  Vochysia         Tarrietia    Dacryodes        Toona         Terminalia  Melaleuca
8         Syzygium        Betula           Terminalia     Afzelia  Brachystegia    Virola        Dalbergia       Cedrela       Bauhinia         Albizia   Santalum
9           Pinus         Ulmus           Commiphora Detarium        Gambeya      Lecythis         Aglaia      Terminalia        Acer         Diospyros Planchonella
10         Acacia        Populus             Ficus       Bombax       Prioria     Brosimum       Sindora       Hymenaea       Artocarpus Weinmannia          Dysoxylum

         Acronyms for the different regions: AfEst: Tropical East Africa; AfTH:Tropical West Africa; AsTH: Tropical Asia Tropical; AmTH: Tropical America;
         Mada: Tropical Isles from the Indian Ocean; Cara: Tropical Isles from the Caribbean sea; AfSA: Sub-tropical North Africa; India: Indian sub-continent;
         Ocea: Oceania; NCC: Northern Cold Climate.

         Table IV.                                                                                 Table V.
         SG values for the different regions.                                                      SG values for families with at least 500 measured
                                                                                                   specimens.

Region              Nb ref     SG min         SG max     SG mean     CV SG
                                                                                          Region                  Nb ref     SG min      SG max SG mean CV SG

AfEst                368           0.06         1.27       0.72       29%
AfSa                 781           0.10         1.27       0.71       28%                 Euphorbiaceae            552        0.15         1.21       0.53        35%
AfTH                6,996          0.14         1.25       0.70       27%                 Burseraceae              540        0.15         1.10       0.58        25%
AmTH                4,261          0.10         1.34       0.75       29%                 Malvaceae                882        0.10         1.24       0.59        35%
AsTH                1,924          0.04         1.32       0.69       28%                 Moraceae                 591        0.20         1.32       0.61        31%
India                422           0.26         1.20       0.67       27%                 Meliaceae               1,028       0.30         1.21       0.64        21%
Cara                 848           0.12         1.36       0.71       32%                 Lauraceae                902        0.28         1.25       0.66        23%
Mada                3,076          0.11         1.30       0.76       26%                 Annonaceae               523        0.21         1.10       0.66        29%
Ocea                 946           0.16         1.28       0.71       29%                 Mimosaceae              1,061       0.25         1.30       0.71        27%
NCC                 1,350          0.24         1.32       0.66       26%                 Rubiaceae                723        0.29         1.13       0.73        20%
                                                                                          Caesalpiniaceae         2,291       0.28         1.36       0.78        24%
         Nb ref: number of specimens; SG mean: mean specific gravity (SG)
         value for the group; SG max: maximum specific gravity (SG) value
                                                                                          Fabaceae                 913        0.06         1.30       0.81        26%
         for the group; SG min: minimum specific gravity (SG) value for                   Sapotaceae               969        0.30         1.33       0.86        21%
         the group; CV SG: coefficient of variation for SG values within the
         group; AfEst: Tropical East Africa; AfTH: Tropical West Africa;                           Nb ref: number of specimens; SG mean: mean specific gravity (SG)
         AsTH: Tropical Asia Tropical; AmTH: America America; Mada: Tropi-                         value for the group; SG max: maximum specific gravity (SG) value
         cal Isles from the Indian Ocean; Cara: Tropical Isles from the Carib-                     for the group; SG min: minimum specific gravity (SG) value
         bean sea; AfSA: Sub-tropical North Africa; India: Indian sub-conti-                       for the group; CV SG: coefficient of variation for SG values within
         nent; Ocea: Oceania; NCC: Northern Cold Climate.                                          the group.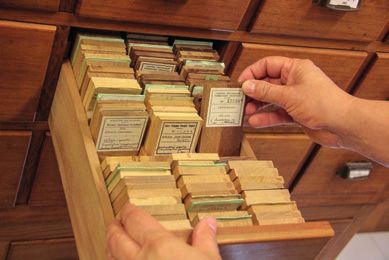
Bois et Forêts des Tropiques – ISSN: L-0006-579X
     Volume 339 – 1st quarter - January 2019 - p. 7-16
14   FOCUS / THE CIRAD WOOD COLLECTION

                                      Table VI.
                                      SG values for genera with at least 149 measured specimens.

                             Species                                  Nb ref      SG min      SG max      SG mean       CV SG

                             Ficus                                     151         0.20        0.80         0.46         22%
                             Ocotea                                    190         0.36        0.97         0.60         18%
                             Albizia                                   222         0.30        0.97         0.62         19%
                             Entandrophragma                           241         0.40        0.81         0.62         13%
                             Dacryodes                                 177         0.44        0.99         0.63         15%
                             Xylopia                                   181         0.27        1.08         0.73         25%
                             Terminalia                                189         0.35        1.15         0.74         23%
                             Syzigium                                  183         0.45        1.09         0.78         13%
                             Acacia                                    149         0.44        1.24         0.85         22%
                             Diospyros                                 208         0.48        1.32         0.86         16%
                             Dalbergia                                 198         0.44        1.27         0.93         16%
                             Pouteria                                  162         0.49        1.33         0.95         17%

                                      Nb ref: number of specimens; SG mean: mean specific gravity (SG) value for the group; SG
                                      max: maximum specific gravity (SG) value for the group; SG min: minimum specific gravity
                                      (SG) value for the group; CV SG: coefficient of variation for SG values within the group.

                             Table VII.
                             SG values for species with at least 40 measured specimens.

                             Species                                  Nb ref      SG min      SG max      SG mean       CV SG

                             Musanga cecropioides                       40         0.14         0.48        0.23         31%
                             Aucoumea klaineana                         62         0.31         0.64        0.41         16%
                             Pycnanthus angolensis                      86         0.31         0.90        0.48         18%
                             Coelocaryon preussii                       43         0.36         0.64        0.48         15%
                             Swietenia macrophylla                      51         0.40         0.78        0.53         15%
                             Scyphocephalium mannii                     44         0.34         0.77        0.54         17%
                             Lovoa trichilioides                        42         0.43         0.80        0.55         13%
                             Entandrophragma angolense                  61         0.42         0.80        0.58         14%
                             Milicia excelsa                            56         0.43         0.73        0.60         12%
                             Entandrophragma utile                      42         0.40         0.74        0.60         13%
                             Entandrophragma cylindricum                73         0.48         0.80        0.65          9%
                             Tetraberlinia bifoliolata                  46         0.47         0.86        0.67         14%
                             Piptadenia africana                        55         0.48         0.89        0.68         13%
                             Cryptocarya thouvenotii                    42         0.51         0.83        0.69         11%
                             Nauclea diderrichii                        46         0.56         0.84        0.72          8%
                             Dicorynia guianensis                       47         0.59         0.93        0.77         10%
                             Staudtia kamerunensis                      43         0.73         1.01        0.85          9%
                             Lophira alata                              42         0.97         1.19        1.07          6%

                                      Nb ref: number of specimens; SG mean: mean specific gravity (SG) value for the group; SG
                                      max: maximum specific gravity (SG) value for the group; SG min: minimum specific gravity
                                      (SG) value for the group; CV SG: coefficient of variation for SG values within the group.
Bois et Forêts des Tropiques – ISSN : L-0006-579X
Volume 339 – 1er trimestre – janvier 2019 – p. 7-16
LA COLLECTION DE BOIS DU CIRAD / LE POINT SUR… 15
Distribution of specific gravity
Specific gravity (SG) is the ratio between wood density Species level (table VII). Eighteen species are represented
(in kg/m3) and water density under the same conditions. by at least 40 measured specimens. The coefficient of varia-
As the specific gravity of cell wall matter is 1.5, all wood SG tion for the SG values is lower than the CV for genera and
should be below 1.5, with a direct relation to wood poro- much more variable (6% to 31%). The differences in mean
sity and fiber wall thickness: high porosity and thin fibre values are very large (0.23 to 1.07).
walls imply low SG. Wood is part of the global class of cel- Genus, and mostly species, distribution should be
lular materials (mostly honeycombs), for which SG is a key the main factor for differences between regions. It should
parameter for most physical and mechanical properties be pointed out that variations can be high within a species
(Gibson 2005). It is usual to consider SG as the most impor- and this is probably due to large variations within individual
tant descriptor for wood and it is used both by technologists trees of species having large differences between juvenile
(Forest Products Laboratory, 2010), ecologists (Chave et al., and mature wood (Wiemann and Williamson, 1988).
2006; Beeckmann, 2016; Baker et al., 2004; Nock et al.,
2009) tree physiologists (Bossu et al., 2016; Wiemann and
Williamson, 1998) or foresters (Bouriaud et al., 2004, 2005)
Past and future uses
in order to i) guide end uses, ii) look at phylogenetic varia- of the collection
tions among regions, iii) examine ontogenetic variation in
wood formation or iv) analyse forest management impacts. The main uses of the CIRAD collection have been i) to
In the current data files, SG has been measured on 2/3 of compile or contribute to compiling anatomy reference books
all the specimens5. Overall, SG values have a near normal distri- (Normand, 1972; Normand and Paquis, 1976; Détienne et
bution ranging from 0.04 to 1.36, with a median value 0.72 and al., 1982, Détienne and Jacquet 1983) and ii) help in iden-
a standard deviation of 0.20, very similar to results in Détienne tifying wood specimens for many purposes, such as trade
and Chanson (1996) for a large selection in the collection. (legal or illegal), justice, culture, history and archaeology
Within the specimens identified at species level (table (Wheeler, 1998; Gasson, 2011).
I) there are 205 families (87% of all identified specimens), This will always be an important role and the existence
1,809 genera (84%) and 6,750 species (79%). The mean SG of well preserved and identified specimens enables the tes-
value can be calculated for each of the species or genus, but ting of new tools for wood description, such as image analy-
for many of them there are few or very few specimens and sis, 3D micro-tomography, or chemical spectroscopy.
the mean value has only a poor indicative value, as SG is Another very important field for the basic collection is
often highly variable at species or tree level. SG distribution the ability to measure useful properties by non-destructive
has only been examined for some populations with a large methods, such as adsorption spectra using different light
number of specimens: sources (X ray, UV or IR, for example), or methods using
Region level (table IV). For the 10 regions, the number of vibration or ultrasound stress.
measured specimens is below 500 for only 2 regions: AfEst Moreover, duplicate specimens for many species make
(368) and India (422) and over 1,000 for half of them. The it possible to build databases for many properties, such as
coefficient of variation (CV) is always high (26% to 32%), shrinkage, strength, rot or insect resistance, as well as iso-
near the CV for the total collection (28%) and the mean lation and a description of the cocktail of extractives typical
values are rather close between regions (0.66 to 0.76), near of each species, needing destructive tests adapted to small
the general mean (0.72). specimens.
Family level (table V). Looking at the 12 large families grou- Also, Xylaria or wood collections form part of our scien-
ping at least 500 measured specimens, the CV values are tific and wood cultural heritage which can play a role in
still very high (21% to 35%). However, the differences in education and contribute to exhibitions and other museum
mean values are greater (0.53 to 0.86). activities.
Genus level (table VI). Twelve genera are represented by at
least 150 measured specimens. The coefficient of variation
for SG values is lower than the CV for regions or families and
more variable (13% to 25%). The differences in mean values
are large (0.46 to 0.95).
5
Measurement of specific gravity was done directly on the
samples in the collection office by simply measuring with a
calliper the dimensions in the 3 directions and the mass on
a laboratory balance. The uncertainty of measurement can be
assumed as i) the sum of balance uncertainty (0.1%), and caliper
uncertainties (1.5%) and ii) variations in sample moisture content
(maximum 5%) inducing a complementary uncertainty of around
1,5%. The total uncertainty (3%) is always largely below the
coefficient of variation within the species or even within the tree.Bois et Forêts des Tropiques – ISSN: L-0006-579X
Volume 339 – 1st quarter - January 2019 - p. 7-16
16 FOCUS / THE CIRAD WOOD COLLECTION
References Gérard G., Narboni P., 1996. Une base de données sur les
propriétés technologiques des bois tropicaux – Schéma
d’organisation. Bois et Forêts des Tropiques, 248 : 65-69.
http://revues.cirad.fr/index.php/BFT/article/view/19885
Gibson L. J., 2005. Biomechanics of cellular solids. Journal
Baker T. R., Phillips O. L., Malhi S., Almeida S., Arroyo L., of Biomechanics 38: 377-399. https://doi.org/10.1016/j.
Di Fiore A., Erwin T., et al., 2004. Variation in wood density jbiomech.2004.09.027
determines spatial patterns in Amazonian forest biomass. Le Bras G., Pignal M., Jeanson M. L., Muller S., Aupic C.,
Global Change Biology, 10: 545-562. http://www.rainfor. Carré B., et al., 2017. Data Descriptor: The French Muséum
org/upload/publication-store/itm_70/Baket%20TR%20 national d’histoire naturelle vascular plant herbarium col-
et%20al%20GCB%202004.pdf lection dataset. Scientific Data, 4: 170016. https://doi.
Beeckmann H., 2016. Wood anatomy and trait-based org/10.1038/sdata.2017.16
ecology. IAWA Journal, 37 (2): 127-151. https://doi. Lens F., 2016. Modern Index Xylariorum. https://globaltim-
org/10.1163/22941932-20160127 bertrackingnetwork.org/products/iawa-index-xylariorum/
Bossu J., Beauchêne J., Estevez Y., Duplais C., Clair B., 2016. Nock C. A., Geihofer D., Grabner M., Baker P. J., Bunyave-
New Insights on Wood Dimensional Stability Influenced by jchewin S., Hietz P., 2009. Wood density and its radial varia-
Secondary Metabolites: The Case of a Fast-Growing Tropical tion in six canopy tree species differing in shade-tolerance in
Species Bagassa guianensis Aubl. Plos One. https://doi. western Thailand. Annals of Botany, 104: 297-306. https://
org/10.1371/journal.pone.0150777 doi.org/10.1093/aob/mcp118
Bouriaud O., Bréda N., Le Moguédec G., Nepveu G., 2004. Normand D., 1972. Manuel d’identification des bois com-
Modelling variability of wood density in beech as affected merciaux – tome 1. Centre technique forestier tropical
by ring age, radial growth and climate. Trees, 18: 264-276. (CTFT, Cirad), Nogent/Marne, France. http://agritrop.cirad.
https://doi.org/10.1007/s00468-003-0303-x fr/310716/
Bouriaud O., Leban J.-M., Bert D., Deleuze C., 2005. Intra-an- Normand D., Paquis J., 1976. Manuel d’identification des
nual variations in climate influence growth and wood density bois commerciaux – tome 2 : Afrique guinéo-congolaise.
of Norway spruce. Tree Physiology, 25: 651-660. https:// Centre technique forestier tropical (CTFT, Cirad), Nogent/
doi.org/10.1093/treephys/25.6.651 Marne, France. http://agritrop.cirad.fr/322997/
Chave J., Muller-Landau H. C., Baker T. R., Easdale T. A., Normand D., Mariaux A., Détienne P., Langbour P., 2017.
Ter Steege H., Webb C. O., 2006. Regional and phylogene- CIRAD’s wood collection. CIRAD. https://doi.org/10.18167/
tic variation of wood density across 2456 neotropical tree xylotheque
species. Ecological Applications, 16: 2356-2367. https://
Stern W. L., 1988. Index Xylariorum. Institutional wood col-
doi.org/10.1890/1051-0761(2006)016[2356:RAPVOW]2.0
lections of the world. 3. IAWA Bulletin n.s., 9 (3): 203-252.
.CO;2
https://doi.org/10.1163/22941932-90001072
Cornisch C., Gasson P., Nesbitt M., 2014. The wood collection
Stevens P. F., 2017. Angiosperm Phylogeny Website. Version
(xylarium) of the Royal botanic gardens, Kew. IAWA Journal,
14, July 2017. http://www.mobot.org/MOBOT/research/
35: 85-104. https://doi.org/10.1163/22941932-00000050
APweb/
Détienne P., Chanson B., 1996. L’éventail de la densité du
Wheeler E. A., Baas P., 1998. Wood identification –
bois des feuillus. Bois et Forêts des Tropiques, 250 : 19-30.
A review. IAWA Journal, 19: 241-264. https://doi.
http://revues.cirad.fr/index.php/BFT/article/view/19859
org/10.1163/22941932-90001528
Détienne P., Jacquet P., 1983. Atlas d’identification des
Wiemann M. C., Williamson G. B., 1988. Extreme radial
bois de l’Amazonie et des régions voisines. Centre tech-
changes in wood specific gravity in some tropical pioneers.
nique forestier tropical (CTFT, Cirad), Nogent/Marne, France.
Wood and Fiber Science, 20: 344-349. https://wfs.swst.
http://agritrop.cirad.fr/172150/
org/index.php/wfs/article/view/1938
Détienne P., Jacquet P., Mariaux A.,1982. Manuel d’iden-
tification des bois tropicaux – tome 3 : Guyane française.
Centre technique forestier tropical (CTFT, Cirad), Nogent/
Marne, France. http://agritrop.cirad.fr/322998/
Forest Products Laboratory, 2010. Wood handbook Wood
as an engineering material. General Technical Report FPL- Bois et Forêts des Tropiques - Revue scientifique du Cirad
GTR-190. Madison, WI: U.S. Department of Agriculture,
Forest Service, Forest Products Laboratory, 508 p. https://
doi.org/10.2737/FPL-GTR-190
Cirad - Campus international de Baillarguet, 34398 Montpellier
Gasson P., 2011. How precise can wood identification be?
Cedex 5, France - Contact : bft@cirad.fr - ISSN : L-0006-579X
Wood anatomy’s role in support of the legal timber trade,
especially CITES. IAWA Journal, 32: 137-154. https://doi.
org/10.1163/22941932-90000049Vous pouvez aussi lire