Economic costs of biological invasions within North America
←
→
Transcription du contenu de la page
Si votre navigateur ne rend pas la page correctement, lisez s'il vous plaît le contenu de la page ci-dessous
A peer-reviewed open-access journal
NeoBiota 67: 485–510 (2021)
doi: 10.3897/neobiota.67.58038                            RESEARCH ARTICLE
                                                                                                                               NeoBiota
https://neobiota.pensoft.net                                                                            Advancing research on alien species and biological invasions

                      Economic costs of biological invasions
                            within North America

          Robert Crystal-Ornelas1, Emma J. Hudgins2, Ross N. Cuthbert3,
            Phillip J. Haubrock4,5, Jean Fantle-Lepczyk6, Elena Angulo7,
      Andrew M. Kramer8, Liliana Ballesteros-Mejia7, Boris Leroy9, Brian Leung2,
          Eugenia López-López10, Christophe Diagne7, Franck Courchamp7

1 Ecology, Evolution, and Natural Resources, Rutgers University, 14 College Farm Road, New Brunswick, NJ
08901, USA 2 Department of Biology, McGill University, Montreal, H3A 1B1, Québec, Canada 3 GEO-
MAR Helmholtz-Zentrum für Ozeanforschung Kiel, 24105 Kiel, Germany 4 Senckenberg Research Institute
and Natural History Museum Frankfurt, Department of River Ecology and Conservation, 63571, Gelnhausen,
Germany 5 University of South Bohemia in České Budějovice, Faculty of Fisheries and Protection of Waters,
South Bohemian Research Center of Aquaculture and Biodiversity of Hydrocenoses, Zátiší 728/II, 389 25,
Vodňany, Czech Republic 6 Auburn University, School of Forestry & Wildlife Sciences, Auburn, AL, 36849,
USA 7 Université Paris-Saclay, CNRS, AgroParisTech, Ecologie Systématique Evolution, 91405, Orsay, France
8 University of South Florida, Department of Integrative Biology, Tampa, FL, 33610, USA 9 Unité Biologie
des Organismes et Ecosystèmes Aquatiques (BOREA UMR 7208), Muséum National d’Histoire Naturelle,
Sorbonne Universités, Université de Caen Normandie, Université des Antilles, CNRS, IRD, Paris, France
10 Instituto Politécnico Nacional. Escuela Nacional de Ciencias Biológicas. Carpio y Plan de Ayala, Col. Sto.
Tomás 11340, CDMX, México

Corresponding author: Robert Crystal-Ornelas (rob.crystal.ornelas@rutgers.edu)

Academic editor: E. García-Berthou | Received 29 September 2020 | Accepted 23 January 2021 | Published 29 July 2021

Citation: Crystal-Ornelas R, Hudgins EJ, Cuthbert RN, Haubrock PJ, Fantle-Lepczyk J, Angulo E, Kramer AM,
Ballesteros-Mejia L, Leroy B, Leung B, López-López E, Diagne C, Courchamp F (2021) Economic costs of biological
invasions within North America. In: Zenni RD, McDermott S, García-Berthou E, Essl F (Eds) The economic costs of
biological invasions around the world. NeoBiota 67: 485–510. https://doi.org/10.3897/neobiota.67.58038

Abstract
Invasive species can have severe impacts on ecosystems, economies, and human health. Though the eco-
nomic impacts of invasions provide important foundations for management and policy, up-to-date syn-
theses of these impacts are lacking. To produce the most comprehensive estimate of invasive species costs
within North America (including the Greater Antilles) to date, we synthesized economic impact data from
the recently published InvaCost database. Here, we report that invasions have cost the North American

Copyright Robert Crystal-Ornelas et al. This is an open access article distributed under the terms of the Creative Commons Attribution License
(CC BY 4.0), which permits unrestricted use, distribution, and reproduction in any medium, provided the original author and source are credited.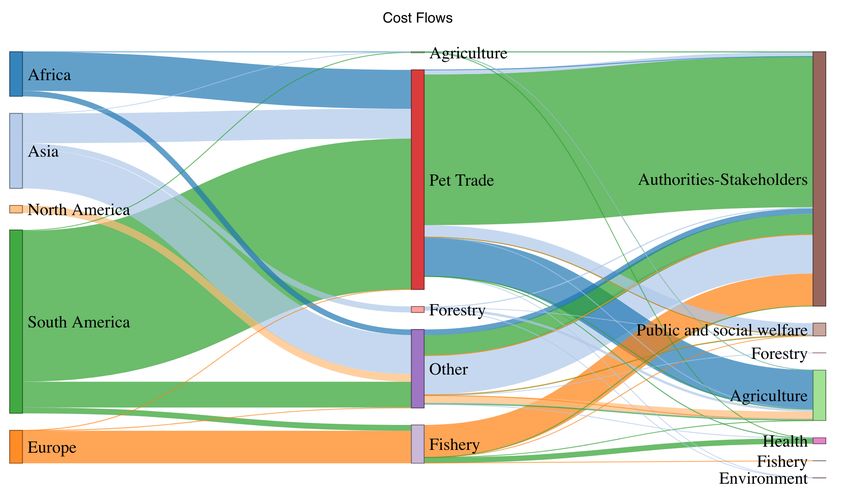
486                  Robert Crystal-Ornelas et al. / NeoBiota 67: 485–510 (2021)

economy at least US$ 1.26 trillion between 1960 and 2017. Economic costs have climbed over recent
decades, averaging US$ 2 billion per year in the early 1960s to over US$ 26 billion per year in the 2010s.
Of the countries within North America, the United States (US) had the highest recorded costs, even after
controlling for research effort within each country ($5.81 billion per cost source in the US). Of the taxa
and habitats that could be classified in our database, invasive vertebrates were associated with the great-
est costs, with terrestrial habitats incurring the highest monetary impacts. In particular, invasive species
cumulatively (from 1960–2017) cost the agriculture and forestry sectors US$ 527.07 billion and US$
34.93 billion, respectively. Reporting issues (e.g., data quality or taxonomic granularity) prevented us
from synthesizing data from all available studies. Furthermore, very few of the known invasive species in
North America had reported economic costs. Therefore, while the costs to the North American economy
are massive, our US$ 1.26 trillion estimate is likely very conservative. Accordingly, expanded and more
rigorous economic cost reports are necessary to provide more comprehensive invasion impact estimates,
and then support data-based management decisions and actions towards species invasions.

Abstract in Spanish
Costos económicos de las invasiones biológicas en Norteamérica. Las especies invasoras pueden tener
severos impactos en los ecosistemas, las economías y la salud humana. Aunque los impactos económicos
de las invasiones proporcionan bases importantes para la gestión y la política, no existen síntesis actual-
izadas de estos impactos. Para producir la estimación más completa de los costos de las especies invaso-
ras en Norteamérica (incluidas las Antillas Mayores) hasta la fecha, sintetizamos los datos de impactos
económicos de la base de datos InvaCost publicada recientemente. Aquí, reportamos que las invasiones
le han costado a la economía de Norteamérica al menos US $1,26 billones entre 1960 y 2017. Los costos
económicos han aumentado en las últimas décadas, con un promedio de US $2 mil millones por año a
principios de la década de 1960 a más de US $26 mil millones por año en la década de 2010. De los países
de Norteamérica, Estados Unidos (EE. UU.) registró los costos más altos, incluso después de controlar el
esfuerzo de investigación dentro de cada país (US $5,81 mil millones por fuente de costos en los EE. UU.).
De los taxones y hábitats que podrían clasificarse en nuestra base de datos, los vertebrados invasores se
asociaron con los mayores costos, y los hábitats terrestres registraron los mayores impactos monetarios. En
particular, las especies invasoras de forma acumulada (de 1960 a 2017) le costaron a los sectores agrícola
y forestal US $527,07 mil millones y US $34,93 mil millones, respectivamente. Las inconsistencias en los
informes (por ejemplo, la calidad de los datos o los detalles en la clasificación taxonómica) nos impidieron
sintetizar los datos de todos los estudios disponibles. Además, había informes de costos económicos para
muy pocas de las especies invasoras conocidas de Norteamérica. Por consiguiente, si bien los costos para la
economía de Norteamérica son enormes, nuestra estimación de US $1,26 billones probablemente es muy
conservadora. En consecuencia, se necesitan informes de costos económicos más extensos y rigurosos para
proporcionar estimaciones más completas del impacto económico de las invasiones y luego respaldar con
los datos las decisiones y acciones de manejo de las invasiones de especies.

Abstract in French
Les espèces exotiques envahissantes ont de fortes répercussions sur les écosystèmes, l’économie et la santé
humaine. Bien que les conséquences financières induites par les invasions constituent des données de
base importantes pour la définition des politiques publiques et de gestion des invasions biologiques, des
synthèses robustes manquent encore à ce jour sur les coûts économiques liés aux invasions. Afin de fournir
une estimation la plus complète possible des coûts induits par les espèces exotiques envahissantes en
Amérique du Nord (Les Antilles comprises), nous avons compilé les données disponibles au sein de la
base de données InvaCost récemment publiée. Ce travail révèle que les invasions ont coûté au moins 1260
milliards de dollars américains entre 1960 et 2017 à l’économie nord-américaine. Les coûts économiques
Economic costs of biological invasions within North America                          487

ont été particulièrement accrus au cours des dernières décennies, passant de 2 milliards de dollars par
an en moyenne au début des années 1960, à plus de 26 milliards de dollars par an au début des années
2010. Parmi les pays de l’Amérique du Nord, les États-Unis présentent les impacts économiques les plus
élevés, même après que ces coûts aient été corrigés par les différences d’efforts de recherche menés par
chaque pays (5,81 milliards de dollars par document source de coûts aux États-Unis). Parmi les taxons et
les habitats renseignés dans notre base de données, les vertébrés présentent les coûts les plus élevés, et les
habitats terrestres sont ceux qui subissent les impacts monétaires les plus importants. Ainsi, les espèces
exotiques envahissantes ont, sur la période 1960–2017, coûté 527,07 milliards de dollars de pertes à
l’agriculture, et 34,93 milliards de dollars à la foresterie. A noter que la qualité des données sources (par
exemple, la fiabilité des estimations de coûts ou encore l’absence de précision sur les taxons spécifiques
associés aux coûts) ne nous a pas permis d’utiliser toutes les données disponibles. De surcroît, il existe peu
de données de coûts au regard de la diversité des espèces exotiques envahissantes en Amérique du Nord.
Par conséquent, même si les coûts pour l’économie nord-américaine sont énormes, notre estimation de
1260 milliards de dollars américains reste probablement très largement sous-estimée. Par conséquent, il
est indispensable d’accroître les efforts de recherche sur ces données de coûts afin (i) de fournir des estima-
tions plus complètes des impacts économiques des invasions biologiques, et (ii) d’appuyer les décisions de
gestion fondées sur des données le plus robustes possible.

Keywords
Alien species, Canada, ecosystem management, Greater Antilles, InvaCost, Mexico, monetary impacts,
societal sectors, United States

Introduction

Invasive species can have widespread and severe impacts on ecosystems, human health,
and economies (Bradshaw et al. 2016; Iwamura et al. 2020; Pyšek et al. 2020; Diagne et
al. 2021a). Ecological impacts from invasions are increasingly well-characterized, includ-
ing reductions in native species abundances (Bradley et al. 2019), biodiversity (Mollot et
al. 2017), fitness (Nunes et al. 2019) and many other detrimental effects on ecosystems
(Ehrenfeld 2010). Also, invasions have been shown to severely impact human health
(Shepard et al. 2011; Schaffner et al. 2020). In turn, associated economic impacts range
from disrupting ecosystem services (Pejchar and Mooney 2010), to decreasing agricul-
tural yields (Oliveira et al. 2001), damaging infrastructure and lowering real estate value
and incomes (Sousa et al. 2009; Olden and Tamayo 2014), as well as substantial expen-
ditures from management actions (Hoffmann and Broadhurst 2016). However, while
advances have been made in deciphering the extent and intensity of ecological impacts
on ecosystems (but see Crystal-Ornelas and Lockwood 2020), economic quantifications
of invasive species remain scarce at several scales (Diagne et al. 2020a).
     Where economic impacts of biological invasions have been quantified, they have
often been limited to particular geographic, taxonomic, socioeconomic or environ-
mental contexts (Pimentel et al. 2000; Aukema et al. 2011; Bradshaw et al. 2016;
Hoffmann and Broadhurst 2016; Paini et al. 2016; Cuthbert et al. 2021a). Broadly,
systematic reviews in invasion ecology suggest that research efforts are not equal across
488 Robert Crystal-Ornelas et al. / NeoBiota 67: 485–510 (2021)
taxonomic groups and geographic areas (Pyšek et al. 2008; Cameron et al. 2016; Crys-
tal-Ornelas and Lockwood 2020). Furthermore, because specific industries may be
impacted more heavily than others by invasive species, we have data that directly link
the impact of invasive species to economic losses for individual industries. For exam-
ple, the tobacco whitefly (Bemisia tabaci), which spreads diseases through lettuce crops
in Mexico, costs the Mexican economy US$ 20 million annually (Oliveira et al. 2001).
Within the US, the annual economic cost to the forestry sector in terms of timber
losses due to invasive forest pests is estimated at approximately US$ 150 million. At
the same time, local governments and homeowners incur annual losses estimated at
US$ 1.7 billion and $830 million due to the impacts wood-boring invasive insects
have on healthy community trees (Aukema et al. 2011). Other research suggests that
invasive insects could cost North America US$ 27.3 billion per year, with the largest
losses incurred by the agricultural sector (Bradshaw et al. 2016).
Cost estimates at national levels are crucial, as they can duly inform policy. How-
ever, biological invasions do not respect geopolitical boundaries and intracontinental
exchanges of goods and persons are linked to increased invasions (e.g., North Ameri-
can Free Trade Agreement; Barajas et al. 2014). Therefore, without large region-wide
estimates of monetary impact across multiple biotic groups, habitat types and societal
sectors, policy and management at more local-scales will at best be piecemeal, and
at worst may lead to deeper economic impacts (Diagne et al. 2020b; Faulkner et al.
2020). So far, multinational agreements have led to coordinated efforts to reduce inva-
sions in ballast water (Firestone and Corbett 2005) and control sea lamprey popula-
tions in the North American Great Lakes (Lodge et al. 2006).
This spatial coordination of management actions is particularly pertinent as the
number of invasive species introductions (Aukema et al. 2010) and their ecological
impacts are dynamic over time (Gallardo et al. 2016). It follows that their economic
impacts may also shift over time. Indeed, because species introductions have increased
exponentially over the past 200 years (Seebens et al. 2017), we might expect economic
costs of invasions to rise as well. This has been seen in Australia, where an economic im-
pact assessment found that invasive species management cost an average of AU$ 2.31
billion in the early 2000s, with costs then rising to AU$ 3.77 billion per year by 2011
(Hoffmann and Broadhurst 2016). Given the lack of information at the continental
scale for North America, it is an open question whether accelerations in introduction
and subsequent damage or management are even greater when examined region-wide.
In order to coordinate region-wide policy and management, North America criti-
cally needs a comprehensive understanding of cost detection efforts taking place within
North American countries. For the US, one country-wide cost detection effort esti-
mated that invasive species cost the US approximately $137 billion per year (Pimentel
et al. 2000). However, in the decades since these early quantifications, some of these
large-scale efforts have been criticized for the reliability of their extrapolations (e.g.,
Hoagland and Jin 2006; McDermott et al. 2013; Cuthbert et al. 2020). A robust
assessment of economic costs of invasions is necessary to inform policy and manage-
ment (e.g., by helping to define prioritization of target areas/species and estimate cost-Economic costs of biological invasions within North America 489
efficiency of actions), as an inaccurate assessment could lead to an over/underallocation
of resources and inefficient management actions. In turn, inadequate contemporary
management actions could cause greater invasion costs in future, particularly if pre-
invasion management (i.e., biosecurity) fails to prevent new introductions of damaging
species (Ricciardi et al. 2020; Ahmed et al. 2021).
Providing continental estimates of economic costs may help spur the development
of invasive species guidance that spans large geographic areas (Epanchin-Niell 2017;
Aizen et al. 2018). The many disparate ways by which researchers assess invasive spe-
cies economic impacts (Dana et al. 2014; Jackson 2015) have thus far impeded reliable
and robust cost syntheses. The InvaCost database is the most up-to-date repository of
invasion costs worldwide (Diagne et al. 2020a). Within InvaCost, detailed cost infor-
mation is provided alongside each record, including the nature of the cost incurred and
the scale at which it was studied.
In this study, we provide an estimate of the total economic cost of invasive spe-
cies to North America, including to the Greater Antilles (Canada, US, Mexico, Cuba,
Jamaica, and Dominican Republic; hereafter, North America). Specifically, we use in-
formation from the InvaCost database (Diagne et al. 2020a) to: (i) characterize the
invasive taxa, countries (i.e., cost per country and cost per source for that country),
habitats and activity sectors bearing the highest economic impacts; (ii) identify the
types of costs (damage or management) incurred by the invaders; (iii) describe the tem-
poral dynamics of these monetized impacts within North America; and (iv) identify
the major continents and pathways of origin for these species.
Methods
Data collection and filtering
The recently developed InvaCost database (Diagne et al. 2020a) is a publicly avail-
able repository that compiles the monetary impacts of invasive species globally. To
develop the InvaCost database, Diagne et al. (2020a) conducted standardized literature
searches (via Web of Science platform, Google Scholar and Google search engine)
and opportunistic targeted searches (i.e., expert consultations by which data gaps were
identified). The most up-to-date version of the InvaCost database (InvaCost_3.0, free-
ly accessible at https://doi.org/10.6084/m9.figshare.12668570) was considered in our
study. We aggregated this data resource with new costs collected from another study in
Mexico (Rico-Sánchez et al. 2021). The resulting initial dataset contained 9,866 cost
estimates (standardized to 2017 US$) of invasive species impacts around the world.
We filtered the complete database to focus on the economic impacts of invasive
species within North America that occurred between 1960 and 2017. This resulted
in a full dataset of a total of 1,727 cost entries (hereafter, “full dataset”; See Suppl.
material 1: full_dataset). We provide a visual depiction of our data cleaning and filter-
ing processing using a Preferred Reporting Items for Systematic Reviews and Meta-490 Robert Crystal-Ornelas et al. / NeoBiota 67: 485–510 (2021)
Analyses (PRISMA) diagram (Moher et al. 2009; Fig. 1). As a first step, we considered
the full dataset to provide an estimate closer to the upper bound of costs recorded in
the database for this region without any filtering of the database. Then, we performed
two filtering steps to obtain the most robust subset for our North American analyses
(hereafter “robust dataset”; See Suppl. material 1: robust_dataset). First, we subset the
data to retain only “observed” costs (actually incurred) rather than a combination of
“observed” and “potential” costs (costs expected, predicted over time or potentially
occurring in the future). By constraining our analyses to focus on only observed costs,
we synthesized data on directly measured economic impacts. Second, we retained only
economic impacts classified as “highly reliable” (Diagne et al. 2020a), meaning that
the economic impacts were either published in peer-reviewed journals, official reports
or if found in grey literature, the costs reported had justified and replicable methods.
These filtering steps removed the small number of entries in our database on invasive
species in Jamaica. Using this robust subset of the full dataset for North America, we
examined the economic impact of invasive species in North America across a range
of descriptors: taxonomic grouping, habitat affected, impacted sector, cost type, and
time (See Suppl. material 1: field_description for description of fields in database). We
describe these analyses below.
Quantifying economic impacts by descriptors
Cost entries in the InvaCost database occur over different timescales. Accordingly,
entries within the database were expanded to obtain annualized estimates using the
expandYearlyCosts function of the invacost R package (Leroy et al. 2020 v1.0, R Core
Team 2020 v4.0.2). This function provides annualized cost estimates for all entries,
based upon the adjusted probable starting and ending years provided in the InvaCost
Database (Diagne et al. 2020a).
In order to determine which taxonomic groups had the highest economic im-
pacts within North America, we organized all invasive species in the database into four
phylum-level groups (invertebrates, vertebrates, plants, or other) based on the phyla
recorded in the InvaCost database. We note that for vertebrates, we grouped all chor-
dates, but highlight that not all chordates are vertebrates. The “other” grouping cap-
tured unspecified or mixed phyla entries as well as groups with very few cost estimates
(viruses, bacteria, fungi, and algae). Mixed entries correspond to those with impacts
attributed to multiple invasive species in a single cost entry, where it is not possible to
split apart each of their impacts. Unspecified entries have no specific invasive species
attributed to an individual cost.
To characterize the economic impact in different countries within North America,
we standardized the total costs incurred by each country within North America by the
number of cost sources (the “Reference_title” field) captured in InvaCost. We controlled
for the number of cost sources published from research in each country so that we could
make fairer comparisons between countries-had we not taken this step of controlling
for a proxy of research effort, costs would have inevitably risen with a greater number ofEconomic costs of biological invasions within North America 491
Figure 1. PRISMA flowchart (Moher et al. 2009) to depict our process for identifying the subset of
economic data we used in this manuscript. Black boxes indicate the number of entries retained at every
screening step. Gray boxes indicate the number of entries removed at every screening step. We began with
9,866 cost entries that include data from InvaCost 3.0 as well as recently collected data from invasion costs
in Mexico (Rico-Sánchez et al. 2021) Ultimately, we retained 2,122 expanded entries that occurred within
North America, and were classified as being reliable and directly observed.
sources. Thus, we present an average economic cost of invasive species impacts for each
country controlling for the proxy of research effort, as well as the raw cost totals.
To investigate which variables might experience differing levels of impact, we sum-
marized cost totals by habitat (“Environment”), economic sector (“Impacted_sector”),492 Robert Crystal-Ornelas et al. / NeoBiota 67: 485–510 (2021)
and type of cost (“Type_of_cost_merged”). For a full explanation of variables and the
levels of classification within those variables, see Suppl. material 1: “field_description”.
Here, we highlight some of the classification levels for the variables in our analysis.
For the “Environment” variable, we grouped economic impacts into high-level habitat
categories of either aquatic, semi-aquatic, terrestrial, or unspecified as provided by the
InvaCost database. The “Impacted_sector” field of the InvaCost database allows users
to view the costs of invasive species within any of the 9 major sectors of economic
activity captured in the database, such as agriculture, forestry, health and fisheries.
The InvaCost database separates economic costs based on the type of cost incurred in
the recipient location (the “Type_of_cost_merged” field): damage, management, or
mixed. We characterized the magnitude of economic impacts within North America
for each of these types of costs. For a more detailed classification of cost types, see
Suppl. material 2: Table S1.
We analyzed temporal trends of invasive species’ economic impacts within North
America by using the summarizeCosts function in the invacost R package. This function
used yearly costs calculated by the expandYearlyCosts function described above to calcu-
late average annual costs as well as decadal averages over the 1960–2017 study period.
Linkage with CABI and sTwist
We linked each InvaCost entry with a species’ geographic region(s) of origin based on
“Native” region entries within their “Distribution table” where provided by CABI’s
Invasive Species Compendium (ISC, CABI 2020). We used the rvest package (Wick-
ham 2016) to obtain the content of each CABI ISC webpage within the set of species
with “Full” coverage as defined by CABI ISC (i.e., those with fully-referenced, peer-
reviewed entries, 2,620 species globally). From the resulting files, we extracted the
“Distribution table” element of each species’ webpage and took note of all countries
it contained. We also linked each species to any dominant pathways of introduction
provided within CABI’s “Species Transported by Cause” listing for five major group-
ings of pathways: pet trade (includes ornamental plants), forestry, agriculture (includes
livestock), fisheries, and health (defined in Suppl. material 2: Table S2). We set the
pathway cause for a species to “Other” if it could not be assigned to any of these domi-
nant pathways. When a species reported multiple pathways, we divided its weight (or
total cost) equally across all reported pathways, thereby assuming equal contribution
of all pathways.
In order to determine the set of species known to have invaded North America,
as well as their known invaded ranges, we relied on a recent publication that provides
the most up-to-date distributional information for all known invasive alien species
globally (sTwist, Seebens et al. 2020). This database also synthesized first record in-
formation where available for each species at the country level. We considered only
records of successful establishment within the set of countries in the robust dataset
(n = 439), rather than all known sTwist records of introduction for this set of coun-
tries (n = 19,159). We used the countrycode R package to assign country names withinEconomic costs of biological invasions within North America 493 sTwist and InvaCost records to ISO3C country codes (Arel-Bundock et al. 2018), and the gbif_parse function within the taxize library to resolve species names based on GBIF taxonomy (Chamberlain et al. 2020 v0.9.98). We then merged entries based on matching country codes and species names. We considered a cost missing if Inva- Cost did not report a cost for any country listed as part of the invader’s range within the sTwist database (Seebens et al. 2020). This approach assumed that all known invasive species produce some nonzero economic impact. However, we acknowledge that there may be a small number of invasive species that produce no measurable eco- nomic impacts in any of the dimensions covered by the InvaCost database. A more holistic valuation of the myriad impacts of invasive species remains an important long-term objective (Pejchar and Mooney 2009). For incomplete entries that had at least one cost recorded in InvaCost, we extrapolated potential total cost by dividing the total cost recorded for each species across all North American countries by the proportion of the known invaded range area over which costs were reported. For ex- ample, if a species were established in the USA, Mexico and Canada, but costs were only reported for the USA, we would divide the total USA cost by the USA’s propor- tional contribution to the total area occupied by the USA, Canada and Mexico (i.e., area of USA/area of USA+Canada+Mexico). This extrapolation assumes that species have the same average economic impact in countries where costs have not been re- ported, which provides a reasonable upper bound, but may overestimate costs due to a likely correlation between the magnitude of economic impact and the likelihood of its detection. We combined all species within the Aedes genus for this portion of the analysis, as they were not always identified to species level, though costs predomi- nantly related to A. aegypti and A. albopictus. Results From 1960 to 2017, our robust dataset suggests that invasive species cost the North American economy at least US$ 1.26 trillion (n = 2,122 expanded database entries). We emphasize that this is likely a highly conservative cost estimate because we con- strained our analysis to only recorded economic data, classified as both directly ob- served and highly reliable. When we relax these constraints and include recorded costs of low reliability (US$ 1.02 trillion) and/or that are potential (US$ 902.19 billion), our full dataset suggests costs may be US$ 3.18 trillion. As outlined in the methods section, hereafter all results that we discuss are based on the filtered set of highly robust data. Database descriptors Taxonomically, the highest economic costs to North America were reported for species that could not be resolved to the species level or complexes of more than one species (US$ 845.21 billion, n = 343). The second highest costs were from the vertebrate
494               Robert Crystal-Ornelas et al. / NeoBiota 67: 485–510 (2021)

group (US$ 252.97 billion, n = 365). Third highest were invertebrates with costs of
US$ 140.80 billion (n = 795).
     At the country level, our results showed that from 1960–2017, the US incurred
US$ 1.21 trillion in costs. When we scaled this estimate by the number of references
describing costs in the US (n = 209) each source found an average cost of US$ 5.81
billion from invasions. Invasive species cost the Canadian economy a total of US$
34.49 billion (n = 22), with an average economic impact per source of US$ 1.57 bil-
lion. Total costs incurred in Mexico from invasions were US$ 3.75 billion (n = 28) and
the average cost of impacts found per source was US$ 133.81 million. The total cost
to the Cuban economy was US$ 342.04 million (n = 6), averaging US$ 57.01 million
per source. Our robust database had a single entry from the Dominican Republic, and
the cost to this country was US$ 3.05 million. Note that the cost per source metric was
used only to account for the relationship between recorded costs and research effort,
and is not used hereafter.
     The most impacted habitat within North America was terrestrial (US$ 675.39
billion), and we note that this was also the most frequently studied system in our
subset of the InvaCost database, with 1,509 expanded entries (Fig. 2). Invasive species
categorized as impacting semi-aquatic habitats were the second most damaging (US$
292.85 billion, n = 178). Habitats that contained entries of unknown or mixed systems
(“diverse/unspecified”) were the third most costly (US$ 272.35 billion, n = 85). While
invasive species impacting aquatic habitats had the second highest number of entries in
our robust database (n = 350), they had the lowest costs (US$ 14.69 billion).
     Within North America, the agricultural activity sector was the most impacted
group, incurring US$ 527.07 billion in costs (n = 309; Table 1). The second highest
costs were recorded in the authorities-stakeholders sector (US$ 45.01 billion, n = 979).
Next was the environmental sector with US$ 41.93 billion in costs with 114 entries in
our database. The forestry sector incurred US$ 34.93 billion in costs (n = 18). Costs
associated with public and social welfare sectors were US$ 41.07 billion (n = 158), and
health costs were US$ 19.49 billion (n = 78). Fisheries had the lowest economic costs
in our database (US$ 924 million, n = 45). Costs related to sectors that were classified
as either “mixed” or “unspecified” also had large economic costs (US$ 94.99 billion, n
= 326; US$ 449.86 billion, n = 95, respectively).
     Damage costs far outweighed either management costs or mixed costs within North
America. We estimated that the North American region-wide cost for direct damage by
invasive species is approximately US$ 837.09 billion (n = 690). Our database recorded
almost twice as many management costs within North America (n = 1,273) compared
to direct damage, yet the measured costs of management were approximately 11% that
of direct damage costs (US$ 99.52 billion).
     On average, from 1960 to 2017 invasive species cost the North American econo-
my US$ 21.64 billion per year. Annual costs increased from approximately US$ 2.13
billion per year in the 1960s to at least US$ 26.26 billion per year in the 2010s (Fig. 3).
However, our estimates in the decade that spans 2010–2017 are likely extremely con-
servative for two reasons. First, the number of robust data entries from the current
Economic costs of biological invasions within North America 495
Figure 2. Cost estimates for impacts of invasive species within North America across impacted environments.
Table 1. Reported cost impacts to activity sectors of the North American economy. Numbers of entries
are shown in parentheses.
Sector Cost (in US$ billions)
Agriculture (n = 309) 527.07
Unspecified (n = 95) 449.86
Mixed (n = 326) 94.99
Authorities-stakeholders (n = 979) 45.01
Environment (n = 114) 41.93
Public and social welfare (n = 158) 41.07
Forestry (n = 18) 34.93
Health (n = 78) 19.49
Fisheries (n = 45) 0.92
decade should grow before this decade’s end. Second, time lags between occurrence of
costs and when the costs are reported may lead to underestimates of economic burdens
by invasions for more recent years.
Linkage with CABI and sTwist
There were a large number of species known to be established within North America
from the sTwist database that were not present within our robust dataset (161 species496 Robert Crystal-Ornelas et al. / NeoBiota 67: 485–510 (2021)
Figure 3. Annual robust costs of invasive species to the North American economy from 1960–2017.
Each gray dot represents total annual costs and horizontal lines are decadal averages of economic costs.
The dotted line represents the average over the entire period.
or species complexes vs. 305 species reported within sTwist). Establishment dates were
unknown in at least one country within the robust dataset (final box in Fig. 1) for 27
of these known established species. Approximately one quarter of establishments were
known to have taken place after 1970 (n = 113 species-country combinations). The
largest discrepancies between sTwist and InvaCost appear to exist for Cuba (Suppl.
material 2: Fig. S1, InvaCost 5% complete) and the Dominican Republic (3% com-
plete), while the lowest appears to be for Mexico (75% complete). Canada and the
US have an intermediate level of completeness (both 45% complete). When a species
was listed in both databases, the total area of the countries over which it was recorded
within InvaCost was 96% of the total area of the known set of established countries
within sTwist. Of the species within our robust subset that had at least one known
date of establishment listed within sTwist (n = 12), they averaged 2.7 independent
establishments within North America (i.e., not due to secondary spread). There were
145 species within our robust subset where no information on establishment means
was present. If we assume that the 161 identified species or species complexes (i.e.,
not “diverse/unspecified”) within our robust subset have caused similar average dam-
ages throughout their invaded ranges as defined by sTwist, the total damages incurred
within the region due to these species jumps from US$ 353 to 396 billion.
North American InvaCost species have known native ranges spanning all con-
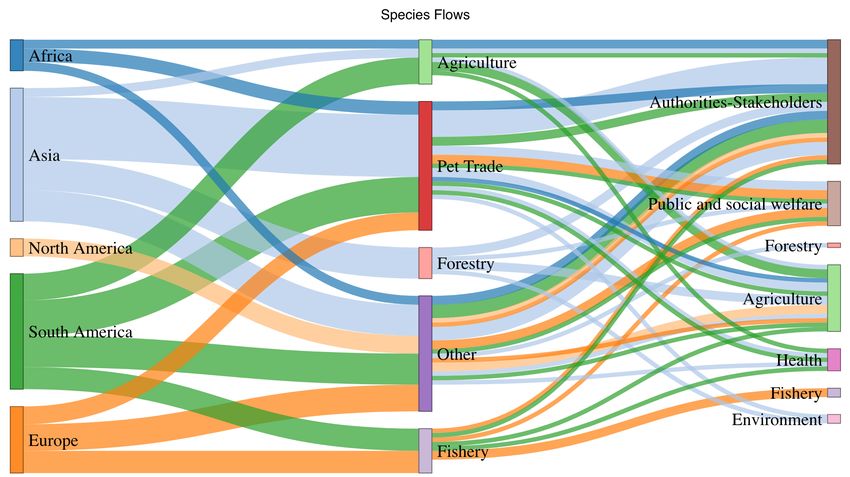
tinents outside of Oceania and Antarctica (Fig. 4; S2, n = 86). Many species have
unknown regions of origin (red flows in Suppl. material 2: Fig. S2a), while manyEconomic costs of biological invasions within North America 497
a.
b.
Figure 4. Flows from pathways of entry to impacted sectors proportional to a the number of species
originating from each continent, and b the costs incurred estimated from our robust dataset (2017 US$).
Originating nodes and colored flows in this diagram correspond to the continent of origin of each species
when available from CABI. The center node labels correspond to dominant entry pathways characterized by
CABI (n = 86 species with pathway information), while the destination node labels correspond to impacted
sectors within the robust dataset. See Suppl. material 2: Fig. S2 for a more complete examination of flows,
including diverse and unknown continents of origin, and impacts to multiple or unspecified sectors.
others possess native ranges spanning multiple continents (dark orange flows in Suppl.
material 2: Fig. S2a). Asian, South American and European species have been reported
more frequently than North American and African species. The majority of all species498 Robert Crystal-Ornelas et al. / NeoBiota 67: 485–510 (2021)
have entered via pathways beyond those in Suppl. material 2: Table S2 (mostly via
unknown pathways, n = 73; but also pathways such as hitchhiking, n = 15; and escape
from gardens or confinement, n = 22). Within the focal pathways we examined, the pet
trade was the largest contributor of invaders (n = 66, Fig. 4a), followed by agriculture
(n = 24) and fisheries (n = 20). Forestry was the source of a smaller share of invaders,
and only one of the invaders was introduced for health purposes. The spread of regions
of origin was quite mixed within all pathways. North American species (light orange
flows) have been spread primarily via diverse pathways, while Asian species (light blue
flows) have been frequently introduced via the pet trade pathway, and have mostly
impacted the authorities-stakeholders sector.
When we analyzed invasional flows in terms of costs rather than numbers of spe-
cies (Fig. 4b; Suppl. material 2: Fig. S2b), the dominant flows were far less complex.
The largest costs were due to species with an unknown native range (Suppl. material 2:
Fig. S2b), and pet trade and fisheries pathways were the main pathways of introduc-
tion that led to costs (Fig. 4b, Suppl. material 2: Fig. S2b). Of species with a known
native range, South American species (dark green flows) have dominated the influx of
costs from the pet trade pathway (Fig. 4b), and European species (dark orange flows)
have done the same for the fisheries pathway, Asian natives have primarily entered via
pet trade and diverse pathways (Fig. 4b). Where sectors could be disentangled, South
American species (dark green flows) make up a substantial portion of the costs to the
authorities-stakeholders sector (Fig. 4b). Asian and European natives also impact this
sector to a lesser degree. The small number of African invaders have mostly impacted
the agriculture sector after entry via the pet trade pathway. While the small share of
North American invaders mentioned previously have produced small costs, they make
up a notable share of the costs to the agriculture sector.
Discussion
We show that invasive species cost the North American economy at least US$ 1.26
trillion from 1960–2017. The highest costs from specified taxonomic groups were as-
sociated with invasive vertebrates, costs were greatest in the US even when scaled by
the number of cost sources, and costs impacting the terrestrial ecosystem were higher
than those impacting other habitats. We also found that the agricultural sector bore the
largest economic costs across North America, and that yearly costs have been increas-
ing from approximately US$ 2 billion per year in the 1960s to over US$ 26 billion
per year in the 2010s. Our robust dataset excluded US$ 1.92 trillion in costs that were
classified as having low reliability or predicted costs; when we relax the constraints of
our robust dataset, our full dataset suggests costs exceed US$ 3 trillion.
Our analysis of economic impacts of different taxonomic groups suggests that the
largest economic impacts come from entries in our database that assigned costs to
multiple invasive species (“diverse” entries; US$ 845.21 billion). This finding empha-
sizes that researchers, when providing economic cost data for invasive species impacts,Economic costs of biological invasions within North America 499
should provide finer-scale information about their study system (e.g., taxa, impacted
sector, years, and habitat) so that further data integration is possible (Diagne et al.
2020b). Besides this rather broad taxonomic category, we showed vertebrates had the
highest reported economic impact, in contrast to other reviews that focused on the
ecological impacts of invasive species, which indicate that plants are the most studied
taxonomic group (Pyšek et al. 2008; Crystal-Ornelas and Lockwood 2020). The dis-
crepancy between our findings for economic impacts and that of ecological-impact
syntheses may be due to a lack of taxonomic granularity we mentioned above, or could
be due to discrepancies between the species that are studied for their ecological impacts
and those that are studied for their economic impacts (Jeschke et al. 2014).
Even when controlling for the number of cost sources produced by each country
in our database, invasion costs in the US far outweighed other countries within North
America (US$ 5.81 billion in costs per source in the US). However, costs in other
countries, scaled by the number of cost sources were still large (e.g., US$ 57.01 million
per cost source in Cuba), despite a low sample size (n = 6, including non-English cost
sources). Furthermore, costs in North America as a whole were substantially higher
than other geographic regions, including Africa (Diagne et al. 2021b), Asia (Liu et
al. 2021), Europe (Haubrock et al. 2021) and South America (Heringer et al. 2021).
National-scale differences within North America indicate that the low magnitude of
reported costs for some countries are either a result of the entrenched geographical bi-
ases in invasion ecology (Pyšek et al. 2008; Bellard and Jeschke 2016; Crystal-Ornelas
and Lockwood 2020; Angulo et al. 2021a) and more broadly in ecology (Nuñez and
Pauchard 2010; Martin et al. 2012; Nuñez et al. 2019), or that they reflect actual
differences in invasion histories and international trade that promote opportunities
for introduction and potential economic impacts. Cuba and the Dominican Republic
have similar numbers of records in sTwist compared to Mexico, but Mexico has many
more records within our robust (both observed and highly reliable) dataset (Rico-
Sánchez et al. 2021), suggesting that our cost underestimation is greater in Cuba and
the Dominican Republic. Further, while the US has roughly twice as many InvaCost
records compared to Canada, it has more than four times the number of sTwist re-
cords. This suggests the 30-fold difference in economic impact between the US and
Canada derived from InvaCost could be a substantial underestimate of the difference
in total cost to each nation (i.e., an even more important underestimation of costs in
Canada). Last, despite the presence of known damaging invaders, our robust subset of
InvaCost included no reports of economic costs in Jamaica.
Only one species (of 161) within the robust dataset is known to be established in
all 5 countries (Columba livia), and none have cost records in each country. However,
three other species are predicted to have region-wide distributions in the more com-
plete sTwist database (Cyprinus carpio, Passer domesticus, Phasianus colchicus). If we as-
sume that C. livia has the same average costs across the entire North American region,
its total estimated costs jump from US$ 2.95 billion to US$ 6.7 billion.
The most economically impacted habitat within North America was the terrestrial
system, and this may be driven by the high economic costs associated with agriculture500 Robert Crystal-Ornelas et al. / NeoBiota 67: 485–510 (2021)
and forestry sectors within North America. This concurs with other predictions that
the US would experience massive agricultural, and therefore terrestrial, costs from in-
vasive species (Paini et al. 2016). We note that a substantial amount of impact (US$
272.35 billion) was attributed to habitats that could not be classified into a single
category (“diverse/unspecified” in our database), suggesting that a non-negligible
portion of reported costs was not clearly associated with specific information for this
descriptor. Fisheries showed the lowest amount of economic impact (US$ 924 mil-
lion), although this sector was important in individual countries such as Mexico (Rico-
Sánchez et al. 2021). This was likely due to the relatively low number of expanded
entries (n = 45), since studies across the continent suggest invasions can have negative
impacts on fisheries (Walsh et al. 2016), even if some studies do not directly quantify
the economic costs (Dunlop et al. 2019). Furthermore, many impacts to fisheries are
extrapolated due to the difficulties in quantifying damages in submerged habitats, and
thus were excluded largely from our analyses. More broadly within InvaCost, impacts
from aquatic invaders have been found to be several times lower than from terrestrial
taxa, and disproportionately low relative to known numbers of alien taxa between
those habitats worldwide (Cuthbert et al. 2021a). Such a low degree of cost reporting
in aquatic realms may reflect a lack of human assets in those systems, or reflect a wider
bias in ecology towards terrestrial ecosystems (Menge et al. 2009).
We found that direct damage costs were much higher than management costs
(US$ 837.09 billion and US$ 99.52 billion, respectively). This pattern is consistent
with global findings (Diagne et al. 2020b, 2021a), although some individual countries
presented the opposite pattern (e.g. Spain, Ecuador or Japan; Angulo et al. 2021b; Bal-
lesteros-Mejia et al. 2021; Watari et al. 2021). Previous research suggests rapid inter-
vention (Leung et al. 2005; Simberloff et al. 2013; Ahmed et al. 2021) can potentially
offset greater direct damage costs in the future, and we may be seeing patterns of this
trade-off where locations incurring higher damage costs spend less on management.
Moreover, management costs are relatively easier to track and reliably quantify, so this
may be why our database contains nearly twice as many entries for management as it
does for damages.
Given that invasion rates have increased over the past 200 years (Seebens et al.
2017), we predicted that the economic costs of invasions would follow the same trend
from 1960–2017. Whilst this expectation held true, we highlight that the dip in eco-
nomic costs from 2010–2017 compared to the previous decade is likely due to a lag
between when costs are incurred and when the costs are reported, such that the most
recent years in the database (2010–2017) have fewer entries (n = 224 [28/year]) than
the previous decade (2000–2009, n = 401 [40/year]). We also suggest that invasion
debt is an important concept for tracking economic costs of invasions over time. Re-
search on invasion debt suggests that some of the most ecologically impactful species in
the early 2000s had arrived in the early 1900s (Essl et al. 2011). It follows, then, that
the species having the most severe economic impacts to North American sectors and
habitats at the present time may be more reflective of socioeconomic conditions dec-
ades ago, and that the present socioeconomic conditions may result in a new suite ofEconomic costs of biological invasions within North America 501
species having different economic impacts. Indeed, invasion costs have been found to
be significantly positively related to the length of time an alien species has been present
(Cuthbert et al. 2021b). This particular analysis should be updated when additional
reliable cost estimates from 2010–2019 are available.
Most North American invasive species have not been assessed for economic im-
pacts, and often, invasive species cause impacts that are non-market in nature (Hanley
and Roberts 2019; Diagne et al. 2020a). We accept that not all invasive species will
have a measurable economic impact, with many affecting non-market sectors that are
difficult to monetize. Nonetheless, the considerable difference between sTwist and the
species recorded for North America in our dataset is surely yet another indication that
the overall cost estimated here is a huge underestimation of the real cost, as we suspect
that many of the species causing non-market impacts could be missed by both our
dataset and sTwist. The set of species recorded within sTwist alone remains quite data
poor, as establishment dates are unknown in at least one country within the North
American invaded range for the majority of these species, indicating that they are
poorly studied. The remaining discrepancy does not appear to be due to a large number
of pre-colonial invaders within sTwist (which are not considered invasive by InvaCost),
as only 21 records are from before 1800. Instead, the difference may be due to lags
between initial detection and economic impact (Coutts et al. 2018). Roughly one
quarter of the sTwist establishment records correspond to establishments after 1970,
placing them well within previously identified lag periods (Essl et al. 2011). While
some of these more contemporary invaders may already be causing substantial eco-
logical and/or economic impacts, the worst costs may only be incurred in the next 50
years or more, and/or they may have yet to have their impacts measured by researchers.
Canada appears to have benefitted from more consistent effort in detecting invasive
species over time, potentially leading to better detection of subsequent damages, while
the other countries have seen an increase in detection in more recent years, potentially
indicating a greater likelihood of lags in damage detection.
Economically-damaging invaders to North America come from all over the world
and have been introduced due to a variety of pathways. As expected, the pet trade, ag-
riculture, and fisheries pathways have led to the invasion of many species (Aizen et al.
2018; Stringham and Lockwood 2018), but less well-examined pathways have also led
to substantial costs. Invasive North American natives have produced detectable, but
nevertheless small, costs within the region. In contrast, several species are reported to
have invaded North America repeatedly. This suggests that countries within the region
are at risk to the same suites of species, and may benefit from increasing information
sharing on potential threat species (e.g., through initiatives such as the proposed North
America Multilateral Invasive Species Project Inventory). To date, the greatest threats
are from species native to South America and Asia, particularly those entering via the
pet trade and diverse pathways, as they are the source of a disproportionate amount of
the costs incurred.
Syntheses like ours are limited in scope by the available knowledge base from which
we constructed our database. Other factors related to climate change or the importance502 Robert Crystal-Ornelas et al. / NeoBiota 67: 485–510 (2021)
of global trade routes make it difficult to predict the sectors and habitats that will bear
costs in the future (Bradshaw et al. 2016). Moreover, economic impacts for most in-
vasive species are still yet to be quantified, and a 2010 review suggested that economic
impacts were recorded for only 13% of the known invasive species in Europe (Vilà et
al. 2010). This is an underestimate compared to our analysis of completeness relative to
sTwist (~50% complete), but we note that species may be missing from both databases.
We also stress that while the costs for Canada, Mexico, and Cuba were substantial, the
number of entries in our database were small compared to those of the US, without
any a priori reason to believe they reflect fewer actual costs. In summary, we present
the first estimate of how much invasive species cost the North American economy, and
our estimate of over US$ 1 trillion is likely very conservative. Building more robust
economic assessments of invasion impacts in these countries will make for even more
accurate, and likely higher, cost estimates for North America.
Acknowledgements
The authors acknowledge the French National Research Agency (ANR-14-CE02-0021)
and the BNP-Paribas Foundation Climate Initiative for funding the InvaCost project
that allowed the construction of the InvaCost database. The present work was conduct-
ed following a workshop funded by the AXA Research Fund Chair of Invasion Biology
and is part of the AlienScenario project funded by BiodivERsA and Belmont-Forum call
2018 on biodiversity scenarios. Thanks to Romina Fernández and David Renault for
abstract translations. RNC acknowledges funding from the Alexander von Humboldt
Foundation. RCO acknowledges support from LCO. JFL would like to thank the Au-
burn University School of Forestry and Wildlife Sciences for travel support to attend the
InvaCost workshop. ELL thanks to SIP-IPN. Funds for EA and LBM contracts come
from the AXA Research Fund Chair of Invasion Biology. CD was funded by the Bio-
divERsA-Belmont Forum Project “Alien Scenarios” (BMBF/PT DLR 01LC1807C).
References
Ahmed DA, Hudgins EJ, Cuthbert RN, Kourantidou M, Diagne C, Haubrock PJ, Leung B,
Petrovskii S, Courchamp F (2021) Managing biological invasions: the cost of inaction.
Research Square. https://doi.org/10.21203/rs.3.rs-300416/v1
Aizen MA, Smith-Ramírez C, Morales CL, Vieli L, Sáez A, Barahona-Segovia RM, Arbet-
man MP, Montalva J, Garibaldi LA, Inouye DW, Harder LD (2018) Coordinated spe-
cies importation policies are needed to reduce serious invasions globally: The case of al-
ien bumblebees in South America. Journal of Applied Ecology 56: 100–106. https://doi.
org/10.1111/1365-2664.13121
Angulo E, Diagne C, Ballesteros-Mejia L, Adamjy T, Ahmed DA, Akulov E, Banerjee AK,
Capinha C, Dia CAKM, Dobigny G, Duboscq-Carra VG, Golivets M, Haubrock PJ, Her-Economic costs of biological invasions within North America 503
inger G, Kirichenko N, Kourantidou M, Liu C, Nuñez MA, Renault D, Roiz D, Taheri
A, Verbrugge L, Watari Y, Xiong W, Courchamp F (2021a) Non-English languages enrich
scientific knowledge: the example of economic costs of biological invasions. Science of the
Total Environment 775: e144441. https://doi.org/10.1016/j.scitotenv.2020.144441
Angulo E, Ballesteros-Mejia L, Novoa A, Duboscq-Carra VG, Diagne C, Courchamp F (2021)
Economic costs of invasive alien species in Spain. In: Zenni RD, McDermott S, García-
Berthou E, Essl F (Eds) The economic costs of biological invasions around the world.
NeoBiota 67: 267–297. https://doi.org/10.3897/neobiota.67.59181
Arel-Bundock V, Enevoldsen N, Yetman CJ (2018) countrycode: An R package to convert
country names and country codes. Journal of Open Source Software 3: e848. https://doi.
org/10.21105/joss.00848
Aukema JE, McCullough DG, Von Holle B, Liebhold AM, Britton K, Frankel SJ (2010) His-
torical Accumulation of Nonindigenous Forest Pests in the Continental United States.
BioScience 60: 886–897. https://doi.org/10.1525/bio.2010.60.11.5
Aukema JE, Leung B, Kovacs K, Chivers C, Britton KO, Englin J, Frankel SJ, Haight RG,
Holmes TP, Liebhold AM, McCullough DG, Von Holle B (2011) Economic impacts of
non-native forest insects in the continental United States. PLoS ONE 6: e24587. https://
doi.org/10.1371/journal.pone.0024587
Barajas IA, Sisto NP, Gaytan EA, Cantu JC, López BH (2014) Trade flows between the United
States and Mexico: NAFTA and the border region. Articulo-Journal of Urban Research.
https://doi.org/10.4000/articulo.2567
Ballesteros-Mejia L, Angulo E, Diagne C, Cooke B, Nuñez MA, Courchamp F (2021) Eco-
nomic costs of biological invasions in Ecuador: the importance of the Galapagos Islands.
In: Zenni RD, McDermott S, García-Berthou E, Essl F (Eds) The economic costs of bio-
logical invasions around the world. NeoBiota 67: 375–400. https://doi.org/10.3897/neo-
biota.67.59116
Bellard C, Jeschke JM (2016) A spatial mismatch between invader impacts and research pub-
lications: Biological Invasions and Geographic Bias. Conservation Biology 30: 230–232.
https://doi.org/10.1111/cobi.12611
Bradley BA, Laginhas BB, Whitlock R, Allen JM, Bates AE, Bernatchez G, Diez JM, Early
R, Lenoir J, Vilà M, Sorte CJB (2019) Disentangling the abundance-impact relationship
for invasive species. Proceedings of the National Academy of Sciences 116: 9919–9924.
https://doi.org/10.1073/pnas.1818081116
Bradshaw CJA, Leroy B, Bellard C, Roiz D, Albert C, Fournier A, Barbet-Massin M, Salles
J-M, Simard F, Courchamp F (2016) Massive yet grossly underestimated global costs of
invasive insects. Nature Communications 7: 1–8. https://doi.org/10.1038/ncomms12986
CABI (2020) Invasive Species Compendium. CAB International, Wallingford. www.cabi.org/isc
Cameron EK, Vilà M, Cabeza M (2016) Global meta-analysis of the impacts of terrestrial
invertebrate invaders on species, communities and ecosystems. Global Ecology and Bioge-
ography 25: 596–606. https://doi.org/10.1111/geb.12436
Chamberlain S, Szocs E, Boettiger C, Ram K, Bartomeus I, Baumgartner J, O’Donnell J,
Oksanen J, Tzovaras BG, Marchand P, Tran V, Salmon M, Li G, Grenié M (2020) taxize:
Taxonomic information from around the web. https://github.com/ropensci/taxizeVous pouvez aussi lire