Les enjeux de la transformation de la mobilité en Wallonie - FUTURAMA Vincent CALAY - Iweps
←
→
Transcription du contenu de la page
Si votre navigateur ne rend pas la page correctement, lisez s'il vous plaît le contenu de la page ci-dessous
FUTURAMA

Les enjeux de la transformation de la mobilité en Wallonie
                         Vincent CALAY

                         25 juin 2020
Constats

     Enjeux

Pistes d’évolution
L’Institut wallon de l’évaluation,
                     de la prospective et de la statistique

 LES NOUVELLES DES POSSIBLES
 Notes de veille prospective de l’IWEPS

                                                               AVRIL 2020
                           Covid-19: quatre scénarios
  N°2                      pour l’après-crise

Frédéric CLAISSE (IWEPS)
(im)mobilité(s)

                  4
81 %
   95%

D’après les chiffres les plus
récents publiés par le SPW,
95 % du transport terrestre
de personnes en Wallonie
se fait par la route, dont
81 % en véhicules
particuliers.
Pratique

                                           Infrastructures
Territoires
                                           et technologies

                          SE
                        MOUVOIR

              Energie               Economie
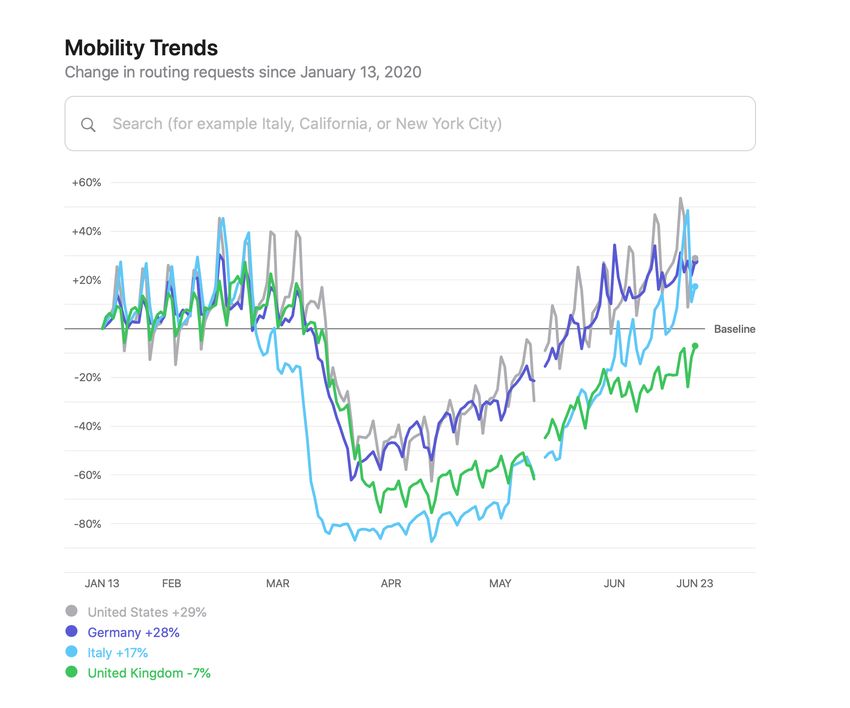
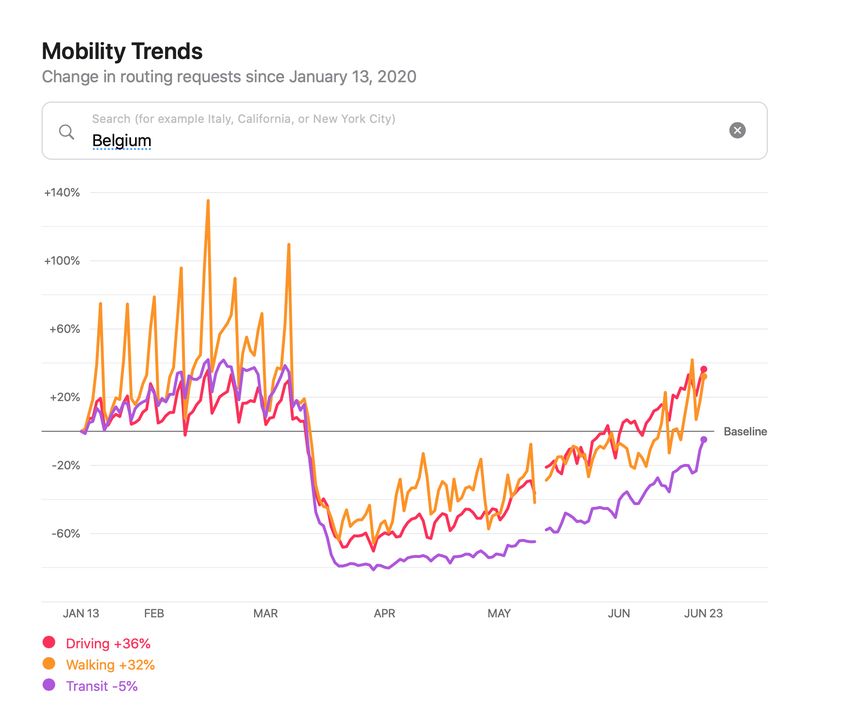
Source: Apple
Source : EEA
Data Data
7.4%
Industry-wide
Top 10 passenger airlines (by RPK)
American Airlines
Delta Air Lines
320,044
308,088
Top 10 cargo airlines (by FTK)
Federal Express
Emirates
15,712
12,270
revenue United Airlines 299,080 United Parcel Service 11,264
IATA passenger Emirates 270,797 Cathay Pacific Airways 9,947
kilometers China Southern Airlines 205,720 Qatar Airways 9,221
WORLD AIR
(RPK) grew by Southwest Airlines 200,848 Korean Air 7,666
7.4% in 2016 Lufthansa 149,702 Lufthansa 7,384
TRANSPORT
British Airways 144,028 Cargolux 6,878
Les liaisons
3.6% Ryanair
China Eastern Airlines
142,740
138,042
Singapore Airlines
Air China
6,345
6,089
aériennes
STATISTICS Industry–wide
2017 Key facts and figures summarizing
air freight
tonne
kilometers (FTK)
grew by 3.6%
$5.5 trillion 37 million
IATA estimates that the value of The domestic China passenger market saw the
entre villes
ont doublé
the air transport industry’s
performance in 2016. For more in 2016, nearly international trade shipped by air in biggest incremental change in journey numbers,
information, go to www.iata.org/WATS
2016 was $5.5 trillion and that tourists with 37 million more passenger journeys made in
double its five–year
2016 than in the year before. This increase was more
average pace (2.0%) travelling by air spent around $650 billion
than in the next two largest gaining markets–
domestic United States and domestic India–combined
en 20 ans
44 45
80.4%
Passenger load
North
America
Europe
26.1%
World
Asia Pacific
33.6% scheduled
factor at an all-time 22.8% Middle East passenger
high of 80.4%
10.7% and freight
Africa
traffic
(by region of
2.2% airline domicile)
18,200
Latin
America
Freight load factor 4.5%
46.9% 67.7 million
The number of unique
city–pair connections
exceeded 18,200 in 2016,
around 500 more than
It is estimated that were offered in 2015
aviation supported and almost double
67.7 million supply– the connectivity by
chain jobs in 2016. air 20 years ago
AIRLINES INTERNATIONAL OCT-NOV 2017
Source: IATAaccès
11Pratique
Infrastructures
Santé
et technologies
SE
MOUVOIR
Environnement Economie
Territoires Energieenjeux
13Source : Eggermont et al., 2020
Source : Eggermont et al., 2020
évolutions ?

               17
14h15-14h30 : Accès à la mobilité en Wallonie : Eléments de cadrage et enseignements Julien Charlier, Julien Juprelle & Amandine Masuy (IWEPS) 14h30-14h45 : Justice dans les transports : de la théorie à la pratique Frédéric Dobruszkes et Mathieu Strale (ULB) 14h45-14h55 : Questions-réponses 14h55-15h10 : Un « New Deal » pour la mobilité en Belgique et en Wallonie Quentin Jouan (Deloitte) 15h10-15h25 : Le transport public ferré comme épine dorsale de la mobilité du futur en Belgique ? Amélie Cardyn (Agoria) et Juliette Walckiers (IEW) 15h25-15h40 : Le futur des mobilités. Enjeux d’usages. Stéphanie Vincent Geslin (Université Lumière Lyon 2) 15h40-16h00 : Débat et conclusions
Vous pouvez aussi lire