THAILANDE Analyse et évaluation du potentiel de développement des cultures énergétiques Etude pays - S. Bonnet, S. Garivait, P. Cheewapongphan et ...
←
→
Transcription du contenu de la page
Si votre navigateur ne rend pas la page correctement, lisez s'il vous plaît le contenu de la page ci-dessous

COLLABORATION DE RECHERCHE TOTAL – CIRAD DS 2389

Analyse et évaluation du potentiel de développement
               des cultures énergétiques

                         Etude pays

                      THAILANDE

S. Bonnet, S. Garivait, P. Cheewapongphan et L. Gazull
                          Dec. 2015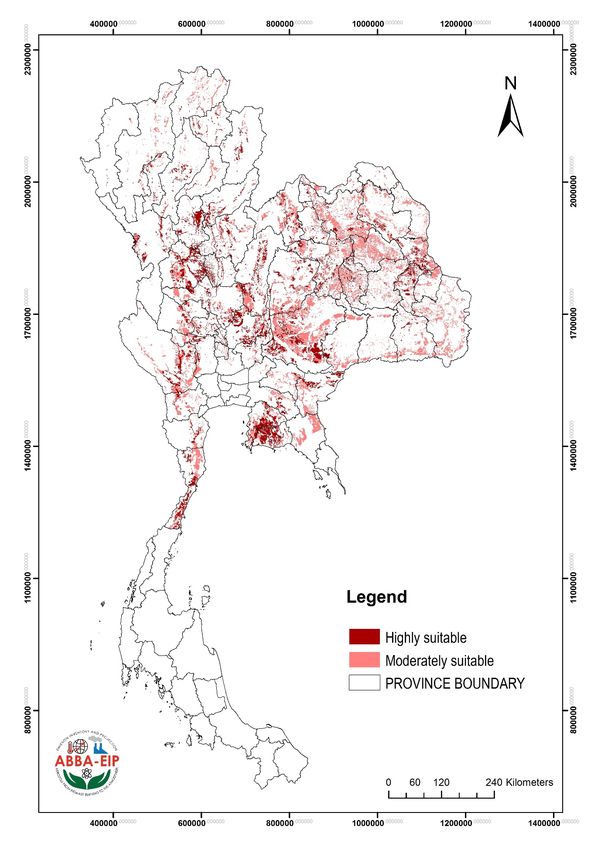
Final Report

                                           Table of Content

Avertissement (Français)                                                                  v

Executive Summary (Français)                                                              vii

Executive Summary (English)                                                               ix

     1. Introduction
        1.1 Background                                                                    1
        1.2 Objective                                                                     1
        1.3 Expected outputs                                                              2

     2. Current status of agricultural sector and bioenergy crop production in Thailand
        2.1 Status of agricultural sector in Thailand                                     3
        2.2 Current status of bioenergy crop production in Thailand                       6
        2.3 Agricultural zoning area                                                      11
        2.4 Current status of ethanol production and consumption                          16

     3. Description of selected scenarios for maximizing the production area of bioethanol
        feedstock
        3.1 Cassava                                                                   22
        3.2 Sugarcane                                                                 24

     4. Assessment of suitable areas for bioethanol feedstock production
        4.1 Suitable areas for cassava plantations                                        26
        4.2 Suitable areas for sugarcane plantations                                      32

     5. Conclusion
        5.1 Main findings                                                                 37
        5.2 Recommendations for future work                                               38

     6. References                                                                        39

Appendix

     a) Results from farmers’ interviews                                                  40
     b) Results from experts’ interviews                                                  48

ii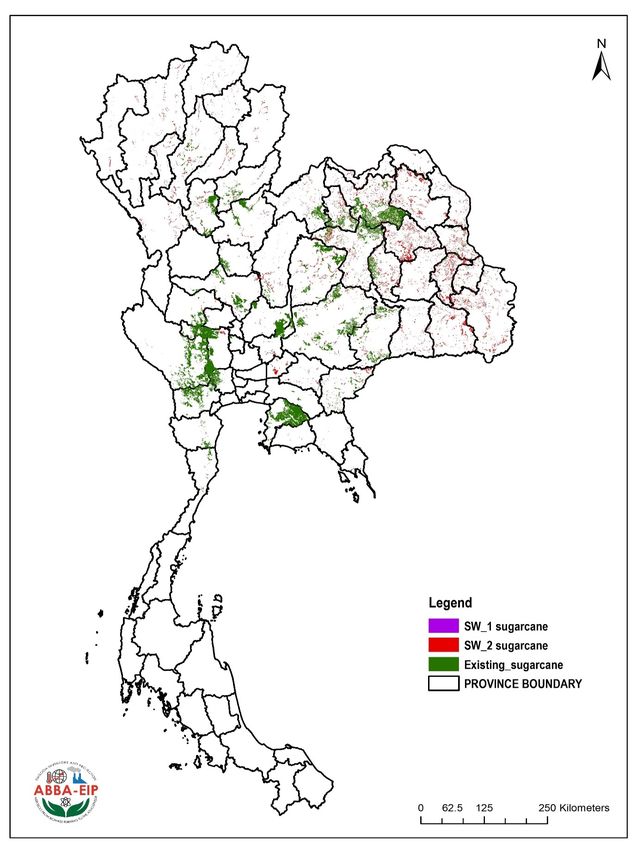
Final Report

                                          List of Tables
Table     Title                                                                 Page

2.1       Land quality and cassava requirements                                 12
2.2       Land quality and sugarcane requirements                               14
2.3       Amount of feedstock and volume of ethanol produced during 2011-2013   16
2.4       Fuel consumption during 2011-2013                                     18
2.5       Situation of ethanol production in Thailand during 2011 to 2013       19
2.6       Current situation and target of ethanol feedstock production          20
4.1       Assessment results of suitable areas for cassava plantations          26
4.2       Assessment results of suitable areas for sugarcane plantations        32

iii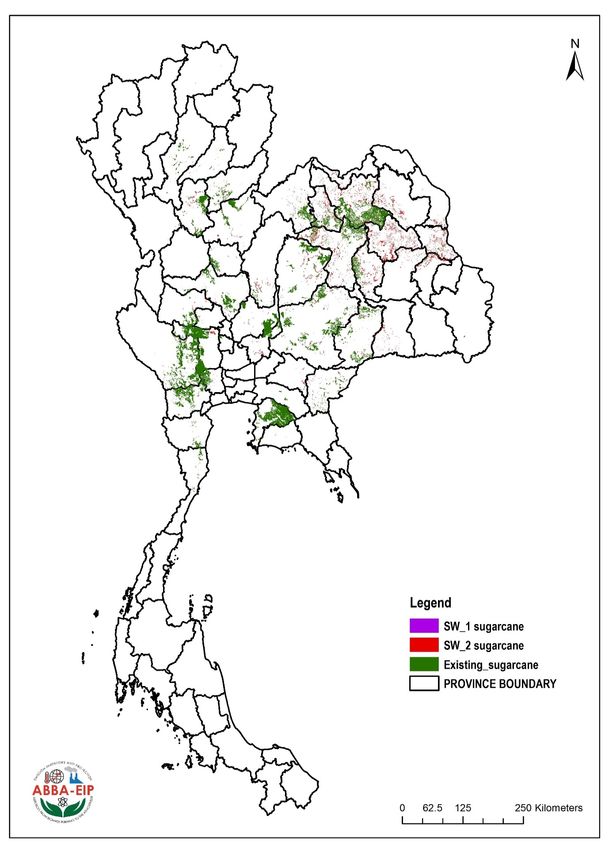
Final Report

                                          List of Figures
Figure    Title                                                                     Page
2.1       Share of farmers based on education level                                 3
2.2       Share of farmers based on family size                                     4
2.3       Share of farmers based on status of land tenure                           4
2.4       Share of farmers based on land holder status                              5
2.5       Share of farmers based on contract farming characteristics                5
2.6       Coverage of cassava plantations in Thailand (year 2013)                   6
2.7       Harvested area and yield of cassava roots in Thailand during 2005-2014    7
2.8       Temporal distribution of cassava production during 2012-2013              7
2.9       Flow of cassava and related products (year 2012)                          8
2.10      Coverage of sugarcane plantations (year 2013)                             9
2.11      Harvested area and yield of sugarcane in Thailand                         9
2.12      Temporal distribution of sugarcane production over the season 2012-2013   10
2.13      Flow of sugarcane and related products (year 2012)                        11
2.14      Cassava zoning area                                                       13
2.15      Sugarcane zoning area                                                     15
2.16      Locations of ethanol factories in Thailand (year 2013)                    17
2.17      Alternative energy development plan (AEDP 2012-2021)                      20
3.1       Assessment framework for cassava                                          23
3.2       Assessment framework for sugarcane                                        25
4.1       Theoretical potential areas for cassava plantations                       27
4.2       Available potential areas for cassava plantations                         28
4.3       Technical potential areas for cassava plantations                         29
4.4       Structure of a cassava single farm system                                 30
4.5       Structure of a cassava cooperate farm system                              31
4.6       Theoretical potential areas for sugarcane plantations                     33
4.7       Available potential areas for sugarcane plantations                       34
4.8       Technical potential areas for sugarcane plantations                       35
4.9       Structure of a sugarcane farm system                                      36

iv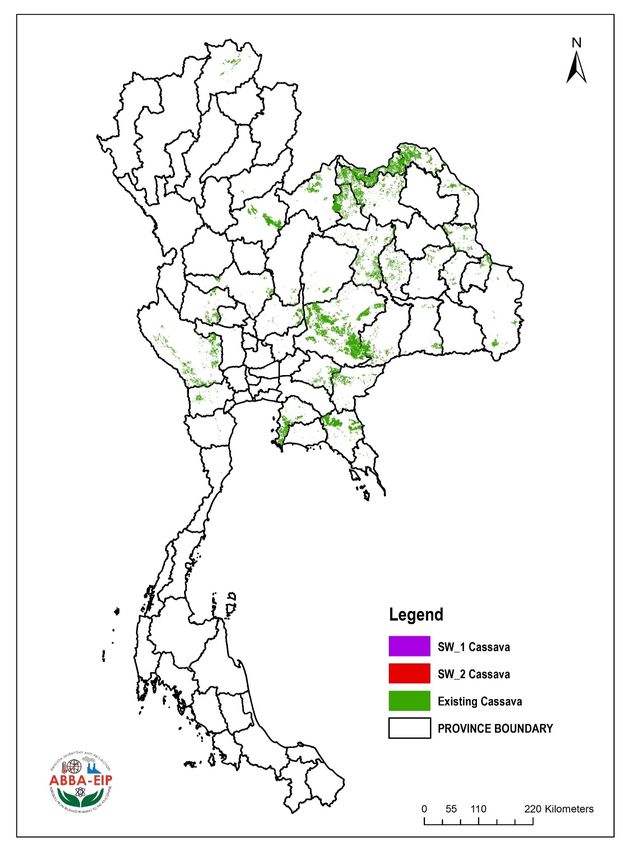
Final Report

                                             Avertissement

Le présent rapport a été réalisé dans le cadre de la convention de collaboration CIRAD/TOTAL DS
2676.

Cette collaboration avait pour objectifs :

-       De développer une méthode « bottom-up » permettant d’évaluer les terres disponibles pour
la production durable de cultures énergétiques à l’échelle d’un pays ;

-       D’éprouver cette méthodologie dans neuf pays tropicaux;

-       De produire trois atlas mondiaux des plantes à fort potentiel bioénergétiques ;

-      De développer une base de données mondiale d’indicateurs nationaux des potentiels de
production de biocarburants

Le présent rapport synthétise une des neuf études réalisées à l’échelle nationale.

Les résultats de cette étude sont soumis aux règles de confidentialité définies dans la convention
CIRAD/TOTAL DS 2676 : toute publication ou communication d'informations relatives à cette
étude, par l'une ou l'autre des Parties (CIRAD ou TOTAL), devra recevoir l'accord écrit de l’autre
Partie.

v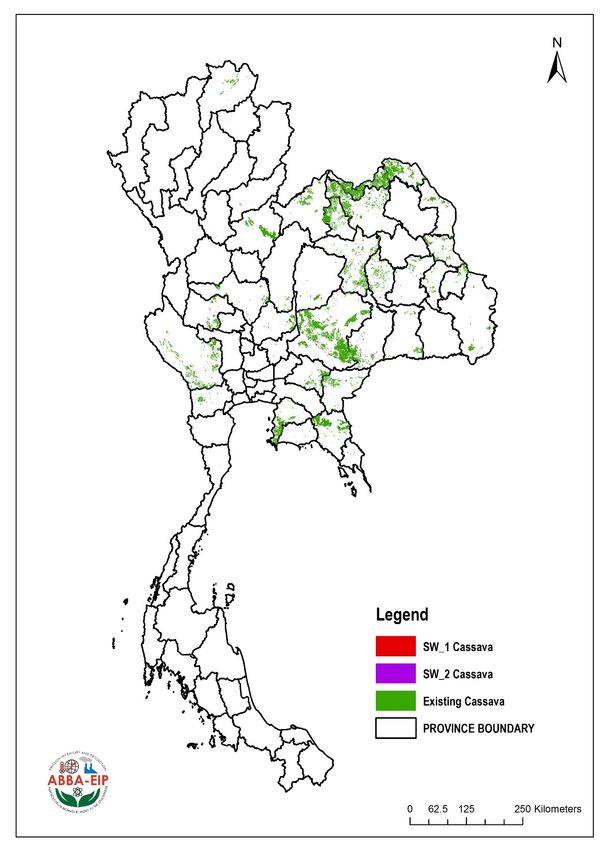
Final Report

Executive Summary (Français)

1. le contexte thailandais

La consommation d'énergie en Thaïlande a constamment augmenté au cours des dernières années.
La Thailande dépend fortement des importations de pétrole fossile pour satisfaire sa demande
énergétique avec environ 60 pour cent de sa demande totale d'énergie venant de l'extérieur.
L'importation de pétrole fossile se traduit par un coût financier lourd et pose des questions de
sécurité énergétique pour le pays. À l'heure actuelle, les secteurs de l'industrie et des transports
représentent à part égale plus de 70% de la demande (DEDE, 2012). Fort de son potentiel de
production de biomasse agricole, le gouvernement thaïlandais a fait beaucoup d'efforts au cours des
15 dernières années dans la promotion des énergies renouvelables (ER). L’objectif fixé pour 2021
est d’augmenter la production d’ER à hauteur de 25% de demande totale en énergie finale. En ce qui
concerne le secteur des transports, les biocarburants ont été fortement encouragées, notamment
l'éthanol pour lequel un objectif de production de 9 millions de litre/jour à l’horizon 2021 a été fixé.

Les deux ressources principales pour la production d'éthanol sont le manioc (cassava) et la canne à
sucre (sugar cane).

En Thaïlande, environ 47 % de la couverture totale du pays sont dédiés à la production agricole. Le
climat et les conditions de sol sont très favorables à la production agricole en général. Environ 11 %
de la superficie agricole est occupée par les plantations de manioc et de canne à sucre. Ces
plantations se trouvent partout en Thaïlande, sauf dans le sud où les précipitations sont trop
élevées. En 2012, les zones de plantation de manioc et de canne à sucre couvraient respectivement
environ 1,4 million d'ha et 1,3 million ha. Les productions de manioc (rendement moyen de 21,9
tonnes/ha) et de canne à sucre (rendement moyen de 75,7 tonnes/ha) étaient respectivement de
29,4 et de 98,4 millions de tonnes. Il est important de noter que la Thaïlande est le deuxième pays
exportateur mondial de manioc et de sucre (et de produits sucrés).

En raison du bon potentiel de la Thaïlande pour la production agricole, le gouvernement souhaiterait
élargir les plantations de manioc et de canne à sucre afin d'augmenter la production de
biocarburants.

Cette étude se concentre sur l’évaluation du potentiel de production durable de manioc et de canne
à sucre conformément aux directions données par le gouvernement thailandais et aux conditions
actuelles de production de ces deux cultures. Ces directions sont clairement de limiter les
changements aux terres où les rendements actuels des cultures en place sont faibles (zones peu
rentables) et de limiter le remplacement des cultures vivrières.

2. Cadre méthodologique

Pour effectuer cette évaluation, une méthodologie a été développée consistant à identifier les terres
disponibles qui pourraient être utilisées afin de maximiser les zones de production du manioc et de
canne à sucre. Il s’avère très clairement qu'il y a en Thailande, une saturation des terres utilisées
pour la production agricole, et donc très peu de possibilités d'expansion du manioc et de canne à
sucre sur des terres incultes. Les seules possibilités d’expansions résident dans le remplacement
(commutation) d’une culture non énergétique actuellement en place par une des deux cultures
énergétiques visées. La méthode d’évaluation repose donc sur la recherche des terres dont les
cultures actuelles sont susceptibles d’être remplacées par du manioc ou de la canne à sucre.

Les critères retenus pour déterminer les conditions de ce remplacement sont fondés sur des
considérations de qualité des terres (les conditions du sol et la disponibilité de l'eau répondant aux

vi
Final Report

exigences de croissance du manioc et de canne à sucre), sur les directions données par le
gouvernement et sur la prise en compte de facteurs environnementaux et sociaux.

Conformément à ces règles, le remplacement des cultures maraichères, fruitières et du riz irrigué, ne
peut être envisagé. Il apparait alors que seules les trajectoires suivantes sont économiquement et
socialement acceptables par le gouvernement thailandais.

Manioc -> Canne à sucre

Canne à sucre -> manioc

Riz pluvial des hautes terres (Highland rice) -> canne à sucre ou manioc

Compte tenu de la production largement excédentaire en riz irrigué (dont la Thailande est un gros
exportateur), le remplacement du riz pluvial par une culture destinée à l’énergie, est pour les
autorités nationales est une solution envisageable car ne remettant pas en cause la sécurité
alimentaire du pays.

Les deux scenarios étudiés sont donc les suivants

Scénario 1 : Expansion de la production de canne à sucre par les agriculteurs en place, sur des zones
actuellement cultivées en manioc ou en riz pluvial selon la logique suivante : 1/ la production de
canne y est théoriquement satisfaisante ; 2/ la culture de manioc n’y est pas optimale; 3) la culture
du riz pluvial n’y est pas optimale.

Scénario 2 : Expansion de la production de manioc par les agriculteurs en place, sur des zones
actuellement cultivées en canne à sucre ou en riz pluvial selon la logique suivante : 1/ la production
de manioc y est théoriquement satisfaisante ; 2/ la culture de canne à sucre n’y est pas optimale; 3)
la culture du riz pluvial n’y est pas optimale.

Le détail de l’évaluation est donnée pour chaque culture ci-après.

L’évaluation des potentiels se fait selon un processus hiérarchique allant du potentiel théorique au
potentiel de valorisation :

(1) évaluation du potentiel théorique. Il correspond à la zone qui répond aux exigences
bioclimatiques pour la culture du manioc ou de la canne à sucre. Cette information a été traitée
selon les critères de qualité des terres définis par le ministère de développement des terres de
Thaïlande (LDD) pour le manioc et la canne à sucre.

(2) évaluation du potentiel disponible. Il correspond aux surfaces qui (1) sont actuellement utilisées
pour la culture du manioc (ou de la canne à sucre) et (2) les zones de terrain qui pourraient être
remplacés par du manioc (ou de la canne à sucre) – cf critères définis ci-dessus) et (3) qui respectent
certaines exigences environnementales (respect des cours d’eau et des zones de conservation).

(3) évaluation du potentiel technique. Il correspond aux surfaces permettant de répondre aux
exigences technico-économiques de la filière et en particulier des usines de transformation (usines
de séchage du manioc et sucreries de canne). La récolte du manioc étant majoritairement manuelle,
aucune contrainte technique n’a été retenue au niveau de la surface de production. En revanche, un
critère de distance maximale aux usines existantes a été appliqué.

(4) évaluation du potentiel de valorisation. Il correspond à la partie du potentiel technique que les
producteurs seraient réellement à même de valoriser compte tenu des freins sociaux-culturels liés
au changement de culture.

vii
Final Report

3. Le potentiel théorique du Manioc et de la canne à sucre

Le ministère du développement des terres (LDD) a fourni l’ensemble des informations nécessaires à
l’identification des terres favorables à l’implantation du manioc et de la canne à sucre.

Les critères utilisés sont résumés dans le tableau 1 :

Table 1 Land quality suitability classes for cassava and sugarcane

                              Crop requirement in each level
               Diagnostic
Land quality                  Highly suitable Moderately             Lowly suitable
               factor                                                               Unsuitable
                              (S1)            suitable (S2)          (S3)

                                                 900—1,100           500-900        4,000
               Annual         (cassava)
Water
               rainfall                          (cassava)           (cassava)      (cassava)
availability
               (mm/yr)
                              1,600-2,500        1200-1600           900-1200       >900

                              (sugarcane)        (sugarcane)         (sugarcane)    (sugarcane)

               Soil depth
                          >100                   50-100              25-50          8.4
               pH             6.1-7.3
                                                 5.1-6.0             4.0-4.5        0.2               0.1-0.2             25                6-25                60                30-60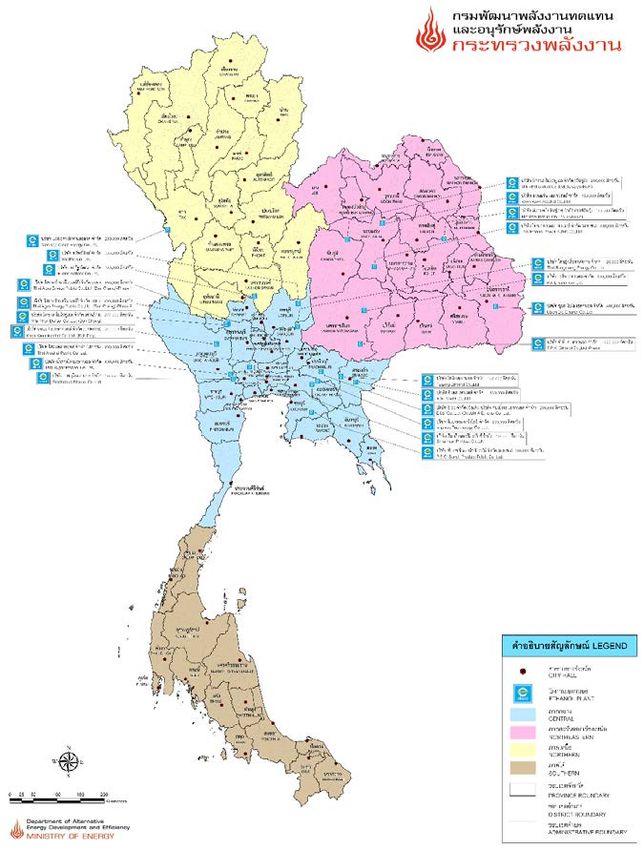
Final Report

(a) Manioc                                           (b) canne à sucre

Figure 1 : Le potentiel théorique du manioc et de la canne à sucre

Pour le manioc, l’ensemble des surfaces favorables représente 11,6 millions d’ha, soit environ 23 %
de la surface totale de la Thaïlande (cf tableau 1). Seuls 2,5 millions d’ha sont très favorables et 4,3
millions d’ha modérément favorables. Si l'on compare la situation actuelle des plantations de manioc
avec la carte de zonage (Fig 1a), on observe qu'environ 70 % du manioc est produit sur des terres
favorables alors que 30 % est cultivé sur des terres théoriquement impropres.

Pour la canne à sucre, l’ensemble des surfaces favorables représente 15.0 millions ha, soit environ
30 % de la surface totale de la Thaïlande (cf tableau 1). 4.4 millions ha sont très favorables et 6.6
millions ha modérément favorables. Si l'on compare la situation actuelle des plantations de canne
avec la carte de zonage à l'adresse ci-dessus, on observe qu'environ 78 % de la canne à sucre est
produit sur des terres favorables alors que 22 % est cultivé sur des terres théoriquement impropres.

ix
Final Report

4. Evaluation des scénarios de production de Manioc et de Canne à sucre

4.1 Le Scénario « Manioc »

    •   Le potential théorique (theoretical potential)

Il correspond aux zones très favorables (S1) et modérément favorable (S2) à la culture du manioc,
selon la terminologie du LDD.

    •   Le potentiel disponible (available potential)

Il correspond :

        1) Aux surfaces actuellement cultivées en manioc.
        2) Aux surfaces additionnelles actuellement cultivées en canne à sucre ou en riz pluvial et
           ayant un fort potentiel de production de manioc (surfaces en S1 ou S2). Ces surfaces
           pourraient être converties en manioc et être considérées disponibles si :
          • Elles sont actuellement cultivées en canne à sucre mais sur des terres faiblement
             favorable (S3) ou impropres (N) à la canne.
          • Elles sont actuellement cultivées en riz pluvial (highland rice).

De ces surfaces pouvant être converties sont ensuite soustraites les contraintes environnementales
suivantes: zones tampon de 1 km autour des forêts, corridors rivulaires de 10m ou 50m autour des
cours d’eau (selon l’importance du cours d’eau).

    •   Le potentiel technique (Technical potential)

Le seul critère technique retenu est la distance aux usines actuelles de séchage du manioc : 334
actuellement sont opérationnelles en Thailande. Une distance maximum de 50 km a été retenue à
dires d’experts (interviews auprès des producteurs et transformateurs).

    •   Le potential de valorisation (Realistic potential)

La capacité des agriculteurs à substituer le manioc à la canne ou au riz pluvial a été évaluée par des
entretiens auprès des producteurs de canne et de manioc.

4.2 Le Scénario «Canne à sucre »

    •   Le potentiel théorique (theoretical potential)

Il correspond aux zones très favorables (S1) et modérément favorable (S2) à la culture de la canne,
selon la terminologie du LDD.

    •   Le potentiel disponible (available potential)

Il correspond :

x
Final Report
1) Aux surfaces actuellement cultivées en canne à sucre.
2) Aux surfaces additionnelles actuellement cultivées en manioc ou en riz pluvial et ayant
un fort potentiel de production de canne (surfaces en S1 ou S2). Ces surfaces pourraient
être converties en canne et être considérées disponibles si :
• Elles sont actuellement cultivées en manioc mais sur des terres faiblement favorables
(S3) ou impropres (N) au manioc.
• Elles sont actuellement cultivées en riz pluvial (highland rice).
De ces surfaces pouvant être converties sont ensuite soustraites les contraintes environnementales
suivantes: zones tampon de 1 km autour des forêts, corridors rivulaires de 10m ou 50m autour des
cours d’eau (selon l’importance du cours d’eau).
• Le potential technique (Technical potential)
Le seul critère technique retenu est la distance aux usines actuelles de production de sucre : 51
actuellement sont opérationnelles en Thailande. Une distance maximum de 50 km selon une route
bitumée a été retenue à dires d’experts (interviews auprès des producteurs et transformateurs)
• Le potential de valorization (Realistic potential)
La capacité des agriculteurs à substituer la canne au manioc ou au riz pluvial a été évaluée par des
entretiens auprès des producteurs de canne.
5. Résultats
Les résultats sont consignés dans les tableaux 2 et 3 suivants
xiFinal Report
Table 2 Les potentiels du manioc
Area (million ha)
Theoretical potential area for cassava 6.800
- Highly and moderately suitable areas (LDD) 6.800
Available potential area for cassava 1.959
- Existing cassava crop 1.916
- Switching from sugarcane to cassava (scenario-based) 0.013
- Switching from highland rice to cassava (scenario-based) 0.192
- Environmental constraints (area switches from sugarcane -0.010
to cassava)
- Environmental constraints (area switches from highland -0.152
rice to cassava area)
Technical potential area for cassava 1.948
- Existing cassava crop 1.916
- Switching from sugarcane to cassava area 0.002
- Switching from highland rice to cassava area 0.030
Realistic potential area for cassava 1.934
- Existing sugarcane crop (100%) 1.916
- Switching from sugarcane (100%) and highland rice (53%) 0.018
Pour le Manioc, les résultats montrent que les possibilités d’expansion sont faibles : seuls 3000 ha de
canne et 40 000 ha de riz pluvial seraient susceptibles d’être transformés en manioc. En considérant
les critères techniques de distance aux usines et les freins sociaux-culturels au changement, le
potentiel de valorisation se imite à 18 000 ha, soit un potentiel d’augmentation de 0.9% par rapport
aux surfaces actuellement plantées en manioc. Le potentiel de conversion de la canne vers le manioc
est minime, car les agriculteurs canniers sont très liés aux usines de sucre et ont peu de raison de
changer.
xiiFinal Report
Table 3 Les potentiels de la canne à sucre
Area (million ha)
Theoretical potential area for sugarcane 10.800
- Highly and moderately suitable areas (LDD) 10.800
Available potential area for sugarcane 3.354
- Existing sugarcane crop 1.850
- Switching from cassava to sugarcane (scenario-based) 0.040
- Switching from highland rice to sugarcane (scenario-based) 3.219
- Environmental constraints (area switches from cassava to -1.73
sugarcane)
- Environmental constraints (area switches from highland
rice to sugarcane area)
Technical potential area for sugarcane 2.553
- Existing sugarcane crop 1.850
- Switching from cassava to sugarcane area 0.015
- Switching from highland rice to sugarcane area 0.688
Realistic potential area for sugarcane 2.126
- Existing sugarcane crop (100%) 1.850
- Switching from cassava (100%) and switching from highland 0.276
rice (38%)
Pour la canne à sucre, les résultats montrent que les possibilités d’expansion sont un peu plus fortes
que pour le manioc : 40000 ha de manioc et 1.5Mha de riz pluvial seraient susceptibles d’être
transformés en canne à sucre. En considérant les critères techniques de distance aux usines et les
freins sociaux-culturels au changement, le potentiel de valorisation se imite à 276 000 ha, soit un
potentiel d’augmentation de 15% par rapport aux surfaces actuellement plantées en canne.
xiiiFinal Report
Executive Summary (English)
1. Background information
Energy consumption in Thailand has been continuously increasing over the years. Thailand depends
heavily on importation of fossil oil to satisfy its energy demand with about 60 percent of its total
energy demand coming from outside. The importation of fossil oil results in heavy financial cost and
poses issues of energy security for the country. At present, more than 70% of the total energy
consumed in Thailand is contributed in almost equal share by the industry and transport sectors
(DEDE, 2012a). As Thailand is an agricultural country rich in biomass resources, the Thai government
has made many efforts over the past 15 years in promoting renewable energy (RE). A target has been
set for 2021 where RE should contribute 25% of the total final energy consumption. With regard to
the transport sector, biofuels have been strongly promoted, notably, ethanol for which a 9 million
litre per day consumption target has also been set for 2021. The two main feedstocks for ethanol
production are sugarcane and cassava since Thailand has a geography and topography that supports
the production of both crops.
In Thailand, about 47% of the total land coverage is dedicated to agricultural production.
This is because the climate and soil conditions of Thailand are quite suitable for agricultural
production in general. About 11% of the agricultural area is occupied by cassava and
sugarcane plantations. These plantations can be found all around Thailand except in the
south where precipitations are too high. In 2012, the cassava and sugarcane plantation areas
covered about 1.4 million ha and 1.3 million ha respectively. The production of cassava
(average yield is 21.9 tonnes per ha) and sugarcane (average yield is 75.7 tonnes per ha) was
29.4 million tons and 98.4 million tonnes respectively. It is important to note that Thailand is
a country among the major producers of cassava and sugarcane and which is notably the
second largest exporter of cassava and sugar (an
d sugar products) in the world.
Because of the good potential of Thailand for agricultural production, cassava and sugarcane
plantations could potentially be expanded to enhance biofuel production. In this study,
areas of Thailand that could be suitable for cassava and sugarcane plantations were
investigated and scenarios of production that are appropriate to produce bioethanol
assessed.
2. Methodological framework
To perform this assessment, a methodology was followed consisting in identifying potential areas of
land that could be used to maximize the production areas of cassava and sugarcane. The scenarios
for maximizing the production of cassava and sugarcane were developed based on the assessment
of the maximum “suitable switchable” area that could be used for planting these 2 crops. The
“suitable switchable” area is defined as the area that could be switched from a current crop use to
either cassava or sugarcane based on land suitability considerations (soil conditions and water
availability meeting the growth requirements of cassava and sugarcane). As there is a saturation of
the land used for agricultural production in Thailand, there are very few possibilities for expansion of
cassava and sugarcane on uncultivated land. Only highland rice was identified as a potential
switchable area. This is because the Thai government has a policy in place consisting in promoting
the plantation of sugarcane in highland rice areas. Since, the soil conditions requirements for
cassava and sugarcane production are fairly similar, there may be situations where highland rice is
xivFinal Report
located on land which soil conditions are suitable for either crop. In that case, sugarcane would be
considered as the first priority for the switch (based on the policy of the Thai government).
The assessment of the maximum potential area for cassava and sugarcane production was based on
the determination of a number of potential areas, as detailed below:
(1) Assessment of the theoretical potential area. This corresponds to the area that meets the
requirements for cassava or sugarcane cultivation. This information was processed based on the
land quality criteria defined by the Land Development Department in Thailand for cassava and
sugarcane.
(2) Assessment of the available potential area based on the previous step. It corresponds to (1) the
area that is currently used for cassava (or sugarcane) cultivation and (2) the areas of land that could
be switched to cassava (or sugarcane) and which also account for certain environmental constrains
(buffer zones).
(3) Assessment of the technical potential area. Following the determination of the available
potential area, infrastructure considerations (road network and location of cassava factories and
sugar mills) were included as part of the assessment to narrow down the land area that can
technically be considered for cassava and sugarcane production. This step identifies the maximum
potential area that could be used for cassava and sugarcane production.
(4) Assessment of the realistic potential area. It corresponds to the technical potential area that
stakeholders could operate in accordance with their capacity to switch from a crop to another.
3. Cassava and sugarcane zoning areas
The land Development Department (LDD) provides information identifying the soil conditions and
water requirements for cassava and sugarcane production. This information is shown in Table 1.
Table 1 Land quality suitability classes for cassava and sugarcane
Crop requirement in each level
Diagnostic
Land quality Highly suitable Moderately Lowly suitable
factor Unsuitable
(S1) suitable (S2) (S3)
900—1,100 500-900 4,000
Annual (cassava)
Water
rainfall (cassava) (cassava) (cassava)
availability
(mm/yr)
1,600-2,500 1200-1600 900-1200 >900
(sugarcane) (sugarcane) (sugarcane) (sugarcane)
Soil depth
>100 50-100 25-50Final Report
C, L, SCL, SiL,
SiCL, SL SiC, LS
Si, CL, L
(sugarcane) (sugarcane)
(sugarcane)
7.4-7.8 7.9-8.4 >8.4
pH 6.1-7.3
5.1-6.0 4.0-4.5 0.2 0.1-0.2 25 6-25 60 30-60Final Report
For cassava, it was found that the total land area that could potentially be considered for its
production amounts to 11.65 million ha; this represents about 22.7% of Thailand’s total land surface.
Based on the land suitability levels reported in table 1, this breaks into 2.5 million ha of highly
suitable land, 4.3 million ha of moderately suitable land and 4.7 million ha of lowly suitable land.
Therefore, low to medium land quality conditions appear to dominate the overall land quality
conditions potential for cassava production. When comparing the existing cassava plantation
situation with the above zoning area map, it was observed that about 70% of the current (existing)
area of cassava (1.3 Mha) is produced on suitable land while the remaining 30% is grown on
unsuitable land.
For sugarcane, it was found that about 15.02 million ha of land could potentially be considered for
its production; this represent about 29.3% of Thailand’s total surface. Based on land suitability
levels, this breaks into 4.4 million ha of highly suitable land, 6.4 million ha of moderately suitable
land and 4.2 million ha of lowly suitable for sugarcane production. As for cassava, these results
indicate that low to medium land quality conditions seem to dominate the overall land quality
conditions potential for sugarcane. When comparing the existing sugarcane plantation with the
above zoning area map, it was observed that about 78% of the current (existing) area of cassava (1.4
Mha) is produced on suitable land while the remaining 22% is grown on unsuitable land.
4. Scenarios for Cassava and Sugarcane Production for Bioethanol
4.1 Scenario for cassava production
The scenario for maximized production of cassava was established based on the methodology
framework identified in section 2, and following the next set of considerations:
• Theoretical potential area
It corresponds to the area that meets the requirements for cassava production. Based on
LDD information, only the areas that are highly suitable (S1) and moderately suitable (S2)
were kept as part of this potential.
• Available potential area assessment
It corresponds to:
3) The area that is currently used for cassava plantation. This constitutes the based-line
area of cassava plantation and this area will remain unchanged for as long as farmers do
not switch to other crops.
4) The area that has a high potential for switching to cassava plantation. This corresponds
to the additional area that could be used for cassava plantation. Within this, there are 2
sub-groups:
• The area that is highly (S1) or moderately (S2) suitable for cassava and the area that is
lowly (S3) or not (N) suitable for sugarcane but currently used for its production.
• The area that is highly (S1) or moderately (S2) suitable for cassava but currently used
for highland rice plantation.
5) The area that can be cultivated with environmental constraints : including, buffer zones
around forest areas of at least 1km and buffer areas around rivers of 10m and 50m
depending on the size of the river (2 main classes of river are considered).
xviiFinal Report
• Technical potential area assessment
The technical potential area is the available potential area in which infrastructural considerations are
included, i.e. location of cassava factories and road accessibility. This corresponds to the available
potential area located within a 50km radius of a cassava-drier yard and accessible to vehicles via
paved-road. Cassava dryer yards were focused on as they are the link between cassava producers
and cassava consumers. Currently, there are 334 cassava-drier yards being operated in Thailand. This
defines the maximum potential area for cassava production.
• Realistic potential area assessment
The realistic potential area was assessed by estimating the share of producers that could have an
interest in switching from sugarcane or highland rice to cassava. This assessment was made by
interviewing farmers and experts, and analyzing sugarcane production systems.
4.2 Scenario for sugarcane production
As for cassava, the scenario for maximized production of sugarcane was established based on the
methodology framework identified in section 2, and following the next set of considerations:
• Theoretical potential area assessment
As for cassava, it corresponds to the area that meets the requirements for sugarcane production.
Based on LDD information, only the areas that are highly suitable (S1) and moderately suitable (S2)
were kept
• Available potential area assessment
It corresponds to:
1) The area that is currently used for sugar cane plantation. This constitutes the based-line
area of sugarcane plantation and this area will remain unchanged for as long as farmers
do not switch to other crops.
2) The area that has a high potential for switching to sugar cane plantation. This corresponds
to the additional area that could be used for sugarcane plantation. Within this, there are 2
sub-groups:
• The area that is highly (S1) or moderately (S2) suitable for sugarcane and the area that
is lowly (S3) or not (N) suitable for cassava but currently used for its production.
• The area that is highly (S1) or moderately (S2) suitable for sugarcane but currently
used for highland rice plantation.
3) The area that can be cultivated with environmental constraints : including, buffer zones
around forest areas of at least 1km and buffer areas around rivers of 10m and 50m
depending on the size of the river (2 main classes of river are considered)
xviiiFinal Report
• Technical potential area assessment
The technical potential area is the available potential area in which infrastructural considerations are
included, i.e. location of sugar mills and road accessibility. This corresponds to the available potential
area located within a 50 km radius of sugar-mill factories and accessible to vehicles via paved-road.
Currently, there are 51 of sugar-mill factories being operated in Thailand. This defines the maximum
potential area for sugarcane production.
• Realistic potential area assessment
The realistic potential area was assessed by estimating the share of producers that could have an
interest in switching from cassava or highland rice to sugarcane. This assessment was made by
interviewing farmers and experts, and analyzing sugarcane production systems.
5. Assessment results of suitable areas for cassava and sugarcane
Based on the methodology and assumptions detailed previously, the results obtained for the cassava
and sugarcane scenarios are reported in Tables 2 and 3.
Table 2 Assessment results of suitable areas for cassava plantations
Area (million ha)
Theoretical potential area for cassava 6.800
- Highly and moderately suitable areas (LDD) 6.800
Available potential area for cassava 1.959
- Existing cassava crop 1.916
- Switching from sugarcane to cassava (scenario-based) 0.013
- Switching from highland rice to cassava (scenario-based) 0.192
- Environmental constraints (area switches from sugarcane -0.010
to cassava)
- Environmental constraints (area switches from highland -0.152
rice to cassava area)
Technical potential area for cassava 1.948
- Existing cassava crop 1.916
- Switching from sugarcane to cassava area 0.002
- Switching from highland rice to cassava area 0.030
Realistic potential area for cassava 1.934
- Existing sugarcane crop (100%) 1.916
- Switching from sugarcane (100%) and highland rice (53%) 0.018
xixFinal Report
Table 3 Assessment results of suitable areas for sugarcane plantations
Area (million ha)
Theoretical potential area for sugarcane 10.800
- Highly and moderately suitable areas (LDD) 10.800
Available potential area for sugarcane 3.354
- Existing sugarcane crop 1.850
- Switching from cassava to sugarcane (scenario-based) 0.040
- Switching from highland rice to sugarcane (scenario-based) 3.219
- Environmental constraints (area switches from cassava to -1.73
sugarcane)Environmental constraints (area switches from
highland rice to sugarcane area)
Technical potential area for sugarcane 2.553
- Existing sugarcane crop 1.850
- Switching from cassava to sugarcane area 0.015
- Switching from highland rice to sugarcane area 0.688
Realistic potential area for sugarcane 2.126
- Existing sugarcane crop (100%) 1.850
- Switching from cassava (100%) and switching from highland 0.276
rice (38%)
Results regarding the realistic potential of cassava, as detailed in Table 2, indicate that there is little
potential for expansion with only about 18,000 ha of additional land that could be converted to
cassava. About 11% of this additional area is contributed by sugarcane and 89% by highland rice.
This cassava expansion potential is equivalent to about 0.9% of the existing cassava plantation area.
For sugarcane plantation, focusing on the realistic potential, the results reported in Table 3 indicate
that the potential for sugarcane expansion is greater than cassava. This additional area amounts to
about 270,000 ha of land, 5% of which is contributed by cassava and 95% by highland rice. This is
equivalent to about 15% of the existing sugarcane plantation area.
In either of the two cases, it is observed that highland rice provides the highest potential for cassava
and sugarcane expansion; the potential for the switching of sugarcane plantation to cassava and
vice-versa is minor. The limited potential for cassava and sugarcane expansion is in part due to the
fact that there is a saturation of the land used for agricultural production in Thailand (the availability
of uncultivated land is limited).
xxFinal Report
1. Introduction
1.1 Background
Energy consumption in Thailand has been continuously increasing over the years. In 2012, final
energy consumption was about 73,316 ktoe, a 3.9% increase as compared to the previous year [1].
Petroleum products contribute the largest share of final energy consumption with about 48% of the
total consumption. Over the past 15 years, biofuels have become the subject of increasing attention
to substitute fossil fuels and so reduce import of crude oil, which Thailand heavily relies on, and
therefore enhance national energy security. Among the liquid biofuels promoted for transportation
in Thailand, bioethanol is one such renewable fuel. It can be produced from energy crops, including,
sugarcane, cassava and Jatropha. Sugarcane and cassava are the main feedstock for such production
in Thailand.
The total area of Thailand is 51.3 million ha. About 47% of this area is used for agricultural activity
and 11% of the agricultural area is used for cassava and sugarcane production. Plantations of
sugarcane and cassava are all around Thailand except in the southern region because of too high
precipitation. In 2012, the cassava and sugarcane plantation areas covered about 1.4 million hectare
and 1.3 million hectare respectively. The production of cassava and sugarcane was 29.4 million tons
and 98.4 million tons respectively [2].
The climate and soil conditions of Thailand are quite suitable for agricultural production. This is
notably so for cassava and sugarcane which plantations could potentially be expanded to enhance
biofuel production. This study intends to assess areas of Thailand that are suitable for cassava and
sugarcane plantation and identify scenarios of production that are appropriate to produce
bioethanol.
1.2 Objective
1.2.1 Overall objective
To explore and identify in Thailand appropriate scenarios for cassava and sugarcane production for
bioethanol
1.2.2 Specific objectives
• To review the current status of agricultural sector and bio-energy crop production in
Thailand
• To identify areas that could be used for cassava and sugarcane plantations using GIS
• To identify the most relevant scenarios for suitable production of cassava and sugarcane for
bioethanol based on experts interviews, field surveys with farmers and brainstorming
sessions
• To quantify for each scenario of cassava and sugarcane production the theoretical, available
and technical potential areas
• To determine the realistic potential area for both sugarcane and cassava based on the
theoretical potential area quantified in the previous step and information collected from
expert interviews and field surveys
1Final Report
1.3 Expected Outputs
• The different pathways of appropriate/sustainable cassava and sugarcane production for
bioethanol
• The maximum potential of cassava and sugarcane feedstock production for bioethanol
based on the appropriate/sustainable production pathways identified
2Final Report
2. Current status of agricultural sector and bioenergy crop production in Thailand
2.1 Status of agricultural sector in Thailand
Thailand is located in south-east Asia. The Kingdom covers an area of 51.31 million ha. Nearly half of
Thailand’s area (about 23.88 million ha) is used for agricultural activities. [2] In terms of economic
productivity, in 2013, 8.3% of Thailand’s gross domestic product (GDP) came from agricultural and
agricultural-processing products. [3]
Based on records from the National statistical Office (NSO) for the year 2010, it is observed that 41%
of Thai workers are involved in agricultural activities, including, farming, fishing, and forestry [4]. It is
also noticed that most of the farmers have received elementary education and that more than half
of them belong to a large family size category (at least 4-5 persons). The records also indicate that
most farmers plant on their own land by hiring workers and that 90% of the farmers are
independent, i.e. no contract-farming. However, it is important to notice that in the case of
sugarcane farmers, there is usually existence of a contract-farming between a farm leader and a
particular sugar factory (sugar mill). The farm leader signs a contract with the sugar factory to deliver
cane as per a specified quota (quantity). In some cases, a large company may have a contract-
farming to rent the land and also hires farmers to plant and deliver the feedstock to the company in
order to avoid issues of lack of raw material. Details of the characteristics of Thai farmers are
provided in Figures 2.1-2.5.
Bachelor and over; 1%
others; 0%
Diploma; 2%
No education ; 5%
Secondary education; 9%
Lower than elementary
education; 12%
Elementary education;
71%
Figure 2.1 Share of farmers based on education level [4]
3Final Report
>10 persons;
1%
6-9 persons; 1 person;
13% 7%
2-3 persons;
39%
4-5 persons;
40%
Figure 2.2 Share of farmers based on family size [4]
Sale-redeem only;
0.02%
Mortgage; 1.29% More than one kind;
1.39%
Owner only;
97.3%
Figure 2.3 Share of farmers based on status of land tenure [4]
4Final Report
government agency;
private cooperation; 0.04%
0.04%
two or more individuals others; 0.03%
hh; 3.52%
household; 96.37%
Figure 2.4 Share of farmers based on land holder status [4]
Support factor of
Agreement of product Support management of
production; 2%
price; 3% production; 1%
Have contract farming; 4%
Do not have contract
farming; 90%
Figure 2.5 Share of farmers based on contract farming characteristics [4]
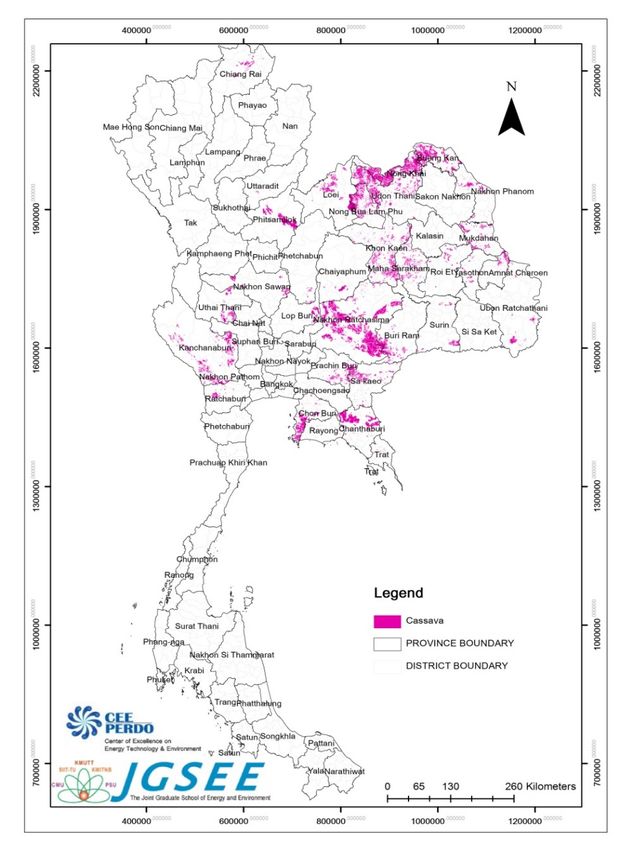
5Final Report 2.2 Current status of bioenergy crop production in Thailand As an agricultural country, a variety of crops are being cultivated in Thailand, including, sugarcane, cassava, maize, sweet sorghum, palm oil, etc. In terms of energy crops, cassava and sugarcane are the most suitable for ethanol production. 2.2.1 Cassava Thailand is the second largest exporter of cassava in the world (the first exporter is Nigeria.) In 2013, the export value of cassava and cassava products amounted to 95,692 million Thai baht (or about 3,190 million US dollars), 4th rank of the top 10 main agricultural products [5]. Cassava is mainly planted in the northeastern, central, and northern part of Thailand with a total harvested area covering 1.4 million ha (as sown in Figure 2.6). About 95% of the plantation area is harvested and the average yield of cassava roots is about 21.9 tonnes per ha. This yield is still lower than the one expected in the AEDP, i.e. 31.25 tonnes per ha. Cassava production is expected to increase with rising demand especially in the alcohol and ethanol industries. The trend of harvested area and yield of cassava during 2005 - 2014 are shown in Figure 2.7. Figure 2.6 Coverage of cassava plantations in Thailand (year 2013) 6
Final Report

                                                   1 600                                                                                       25.0
                                                                                                    22.7
                                                                                                                         21.9 21.8 21.9
                                                   1 400
               Cassava harvested area (1,000 ha)
                                                                                    22.9
                                                                             21.1            21.3          18.6 19.3                           20.0

                                                                                                                                                      Cassava yeild (tonnes/ha)
                                                   1 200

                                                   1 000            17.2
                                                                                                                                               15.0
                                                     800

                                                     600                                                                                       10.0

                                                     400
                                                                                                                                               5.0
                                                     200

                                                          -                                                                                    0.0
                                                               2005 2006 2007 2008 2009 2010 2011 2012 2013 2014

                                                                                           Harvested area          Yield

Figure 2.7 Harvested area and yield of cassava roots in Thailand during 2005-2014 [5]

Cassava is planted all year round. About 65% is planted at the beginning of the rainy season (over
the period going from March to May) and about 35% during the dry season (during June to October).
Most of the planting is done at the beginning of the rainy season as the starch content of the root
becomes highest by the time of harvesting at the beginning of the winter season (around November
up to January). The usual age for harvesting is between 9 to 12 months depending on the cassava
price. In general, the largest share of the production (about 50% of the total production) occurs over
the period January - March. An illustration of the temporal distribution of cassava production for the
season 2012-2013 is given in Figure 2.8.

                                                   20.0                                        18.7
                                                                                      17.7
                                                   18.0
          Percentage of cassava production (%)

                                                   16.0
                                                                                                      14.4
                                                   14.0                       12.7
                                                   12.0

                                                   10.0
                                                                       8.5                                   8.1
                                                    8.0

                                                    6.0       5.3
                                                                                                                                         3.3         3.7
                                                    4.0                                                                3.1
                                                                                                                             2.2   2.3
                                                    2.0

                                                    0.0
                                                              Oct     Nov     Dec      Jan     Feb    Mar    Apr   May       Jun   Jul   Aug         Sep
Figure 2.8 Temporal distribution of cassava production during 2012-2013 [2]

7
Final Report
In Thailand, cassava roots are mainly processed into starch, cassava chips or pellets, and ethanol
respectively. About 23% of the production is for domestic consumption in the form of flour (16%),
animal feed (5%), and energy (2%). About 77% of the production is exported to countries, including,
China, Japan, USA, South Korea, and Indonesia (only flour) in the form of cassava chips, pellets and
flour. The flow of cassava and related products is summarized in Figure 2.9.
Domestic
consumption
(14.42%)
Chip/Pellet
(36.38%)
Export
(85.58%)
Harvested Fresh root
area production Domestic
1.36 Mil. ha 29.4 Mil. tons consumption
(28.86%)
Starch
(60.73%)
Export
(71.14%)
By product
Peels Feed/Fertilizer
Ethanol (3.27%)
(2.89%)
Pulps Feed/Fuel
(16.42%) (Ethanol)
Effluent
Figure 2.9 Flow of cassava and related products (year 2012) [6]
2.2.2 Sugarcane
Thailand is the second largest exporter of sugar and sugar products (the first exporter is Brazil.) In
2013, the export value of sugar and sugar products was about 67,717 million Thai baht (or about
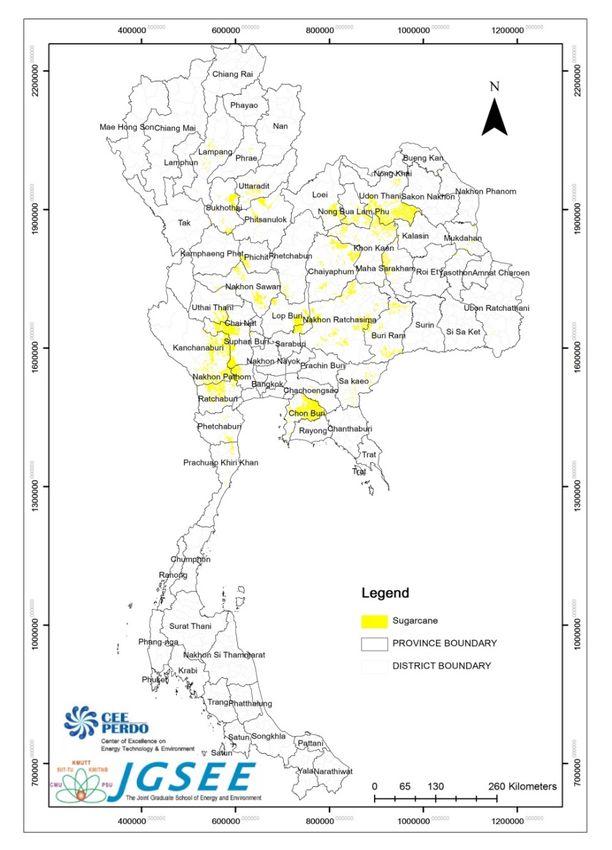
2,257 million US dollars). Sugarcane is mainly planted in the northeastern, central, and northern part
of Thailand with a total harvested area covering 1.3 million ha (2013) (see Figure 2.10). This was an
increased figure as compared to the previous year as the price of sugarcane reached 1,000 baht per
tonne (it was in the range 520 to 924 Thai baht per tonne in previous years, i.e. 2005-2012) whereas
the other crops, including, maize and cassava, had lower returns [5]. The yield of sugarcane is about
75.7 tonnes per ha; this is lower than the 93.75 tonnes per ha targeted in the AEDP. Sugarcane
production is expected to increase in accordance with the expansion of the food and fuel industry,
and its market price. The trend of harvested area and yield of sugarcane production during 2005-
2014 are shown in Figure 2.11.
8Final Report
Figure 2.10 Coverage of sugarcane plantations (year 2013)
1 600 90.0
76.8 75.7 76.9 80.0
Sugarcane harvested area (1,000 ha)
1 400 76.2
69.3 68.2
Sugarcane yeild (tonnes/ha)
1 200 70.0
63.7 69.7
60.0
1 000
49.4 50.0
800
46.5 40.0
600
30.0
400 20.0
200 10.0
- 0.0
2005 2006 2007 2008 2009 2010 2011 2012 2013 2014
Harvested area Yield
Figure 2.11 Harvested area and yield of sugarcane in Thailand [5]
9Final Report
The seasonality of sugarcane plantation varies by region. Sugarcane is planted during October to
November in the northeastern region, during November to February in the central region and during
December to May in the northern region. The usual age for harvesting is about 10 to 14 months
depending on the starting date of the cane crushing season which is set by the Office of the Cane
and Sugar Board (OCSB). All sugar mill factories are under the OCSB. There are currently 51 sugar
mill factories in operation. All sugarcane farmers are members of the sugarcane grower association
which is under the supervision of the OCSB. The starting period of the cane crushing season, the
amount of cane crushed, and the price of sugarcane depend on the announcement from the OCSB.
Normally, the cane crushing season starts at the beginning of November or December and lasts up
to the end of April. During the cultivation season of 2012-2013, the OCSB announced the beginning
of the cane crushing season to be on 15 November 2012 with a total sugar production of 94.64
million tonnes; with different quota of production for each region of the country. The temporal
distribution of sugarcane production over the season 2012-2013 is shown in Figure 2.12.
30
Percentage of sugarcane production (%)
24.49
25 23.47
22.3
20.73
20
15
10
6.84
5
1.67
0.5
0
Nov Dec Jan Feb Mar Apr May
Figure 2.12 Temporal distribution of sugarcane production over the season 2012-2013 [2]
All of the sugarcane is processed into sugar with about 70% of the total production being exported.
Bagasse and molasses are major by-products of the sugar production process. Bagasse is mainly
used as fuel for power production. Molasses are mainly used for ethyl alcohol or ethanol production
which can be used in the food and fuel industry. The Flows of sugarcane and related products are
summarized in Figure 2.13.
10Final Report
Domestic
Cane production Sugar consumption
100.15 Mil. tons 10.02 Mil. tons 2.6 Mil. tons (26%)
Crushing Export
Harvested area
1.3 Mil. ha 7.42 Mil. tons
By product (74%)
Bagasse Fuel
(30%) (Electricity)
Molasses Fuel
(4.5%) (Ethanol)
Filter cake Fertilizer
(3.4%)
Figure 2.13 Flow of sugarcane and related products (year 2012) [6]
2.3 Agricultural zoning area
The Land Development Department (LDD) of Thailand has developed a project entitled “Zoning area
of main economical crop of Thailand”. The objective of this project is to assess the zoning area of 5
main economic crops of Thailand, including rice, sugarcane, cassava, para-rubber, and palm oil by
assessing the suitability of land to meet a particular crop requirement (in terms of climatic and soil
conditions). For each crop, the suitability of area is ranked into 4 levels, including, highly suitable
area, moderately suitable area, lowly suitable area, and unsuitable area. The details of the zoning
area of cassava and sugarcane are as detailed below:
2.3.1 Zoning area of cassava
Based on the land quality conditions of LDD for cassava production (as demonstrated in Table 2.1), it
has been found that the total land area that could potentially be considered for cassava production
amounts to 11.65 million ha (ignoring what that land may currently be used for); this is about 22.7%
of Thailand’s total surface. This coverage is referred in this section as “cassava zoning area” and
shown in Figure 2.14. It is observed from this figure that about 2.5 million ha (or 22% of this total
cassava zoning area) is highly suitable for cassava production (see crimson color), 4.3 million ha (or
37% of the total cassava zoning area) is moderately suitable (see red color), and 4.7 million ha (or
41% of cassava zoning area) is lowly suitable (see light-pink color). These results indicate that most
of the potential areas identified would provide low to medium land quality conditions for cassava
production and therefore soil quality improvement would be important to enhance root yields.
11Final Report
Table 2.1 Land quality suitability classes for cassava
Crop requirement in each level
Diagnostic
Land quality Highly suitable Moderately Lowly suitable
factor Unsuitable
(S1) suitable (S2) (S3)
Water Annual 1,100-1,500 900—1,100 500-900 4,000
(mm/yr)
Physical Soil depth >100 50-100 25-50 8.4
property of
5.1-6.0 4.0-4.5 0.2 0.1-0.2 25 6-25 60 30-60Final Report Figure 2.14 Cassava zoning area 13
Final Report

2.3.2 Zoning area of sugarcane

Based on the land quality conditions of LDD for sugarcane production (as demonstrated in Table
2.2), it has been found that the total land area that could potentially be considered for sugarcane
production amounts to 15.02 million ha (ignoring what that land may currently be used for); this is
about 29.3% of Thailand’s total surface. This coverage is referred in this section as “cassava zoning
area” and shown in Figure 2.15. It is observed from this figure that about 4.4 million ha (or 30% of
this total sugarcane zoning area) is highly suitable for sugarcane production (see crimson color), 6.4
million ha (or 42% of the total sugarcane zoning area) is moderately suitable (see red color), and 4.2
million ha (or 28% of sugarcane zoning area) is lowly suitable (see light-pink color). These results
indicate that most of the potential areas identified would provide medium to low land quality
conditions for sugarcane production and therefore soil quality improvement would be important to
enhance cane yields.

Table 2.2 Land quality suitability classes for sugarcane

                              Crop requirement in each level
               Diagnostic
Land quality                  Highly suitable Moderately         Lowly suitable
               factor                                                           Unsuitable
                              (S1)            suitable (S2)      (S3)

Water          Annual         1,600-2,500        1200-1600       900-1200          < 900
availability   rainfall
               (mm/yr)

Physical    Soil depth >100               50-100                 25-50             8.4
property of
                                                 5.1-6.0         4.0-4.5           0.2               0.1-0.2         25                6-25            60                30-60
Final Report Figure 2.15 Sugarcane zoning area 15
Final Report

2.4 Current status of ethanol production and consumption

2.4.1 Ethanol production

In 2013, Thailand produced 949.1 million litres of ethanol or about 2.9 million litres per day which
represents about 69.3% of the full production capacity. The raw materials for ethanol production are
molasses, cane juice, and cassava with a share of 66%, 6%, and 28% respectively. Thailand has 21
ethanol factories (as demonstrated in Figure 2.16) with a total production capacity of 4.2 million
litres per day, including 14 factories that are molasses-based, 1 factory that is cane juice-based, and
6 factories that are cassava-based. An additional 3 ethanol factories are being constructed providing
a combined extra 1.3 million litres per day ethanol to the current total production capacity. The
amount of feedstock and volume of ethanol produced for the years 2011, 2012 and 2013 are
detailed in Table 2.3. The locations of the ethanol factories are shown in Figure 2.16.

Table 2.3 Amount of feedstock and volume of ethanol produced during 2011-2013

               Amount of feedstock                 Volume of ethanol production

               (million tonnes)                    (million litres of ethanol)
Year
               Molasses    Cane        Cassava     Molasses- Cane                Cassava-   Total
                           juice                   based     juice-              based
                                                             based

2011           1.6         0.5         0.6         381.4        36.5             102.6      520.5

2012           2.2         0.6         0.5         531.8        49.0             74.7       655.5

2013           2.6         0.8         1.7         627.0        56.9             265.2      949.1

Source: [7]

16
Final Report Figure 2.16 Locations of ethanol factories in Thailand (year 2013) [7] 2.3.2 Ethanol consumption Ethanol is used as a fuel in transport engine by blending it with gasoline; it is referred to as gasohol. Gasohol in Thailand was originally introduced by His Majesty the King Bhumibol in 1985. Currently in Thailand there are 4 types of gasohol blends, including, E10-gasohol 95 (a blend of 90% gasoline 95 and 10% ethanol), E10-gasohol 91 (a blend of 90% gasoline 91 and 10% ethanol), E20 (a blend of 80% gasoline and 20% ethanol), and E85 (a blend of 15% gasoline and 85% ethanol). In 2013, the amount of gasohol consumption was about 7,469 million litres, an increase of about 67% as compared to the previous year; this was mainly because of the termination of the sale of octane 91 regular gasoline at the beginning of 2013. This resulted in increasing the annual demand for ethanol to 948.7 million litres or about 2.6 million litres per day. About 85% of ethanol is used in the form of E10 (both E10-gasohol 91 and E10-gasohol 95), 13% as E20, and 2% as E85. The ethanol demand was 17
Vous pouvez aussi lire


