Les villes dans la perspective net-zero - Prof François Marechal Industrial Process and Energy Systems Engineering - local-energy.swiss
←
→
Transcription du contenu de la page
Si votre navigateur ne rend pas la page correctement, lisez s'il vous plaît le contenu de la page ci-dessous
Les villes dans la perspective
net-zero
 Prof François Marechal
Industrial Process and Energy Systems
 Engineering
 Institute of Mechanical Engineering
 Faculty of Engineering
 EPFL Valais Wallis
 CH-1950 Sion
AND THEY KNEW : CO2 AND GREENHOUSE EFFECT
 Svante Arrhenius’ 1896 Paper

1896

 2x CO2 in the atmosphere,
 T goes up by 50 C
 Later refined his calculation
 to include feedbacks to get 2.10 C

 TheSeptember
 Monday, Berkeley Lectures
 22, 14 on Energy M Went 1/21/2016
NOS BESOINS ÉNERGÉTIQUES

 47% Import

 36%
 Export
 17%
 products 2%
100 l gasoline/hab/year Electricity
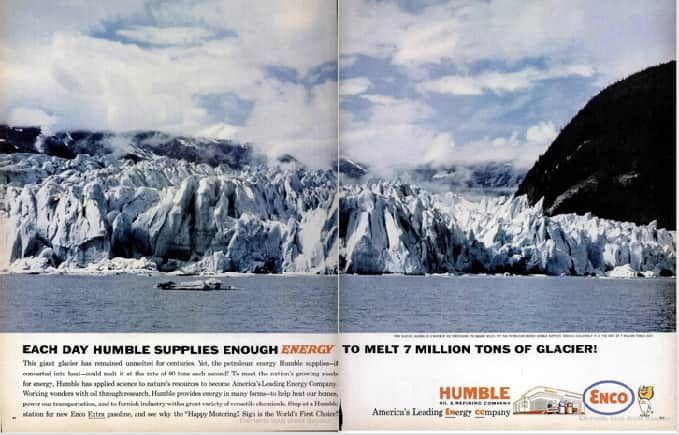
1960 : PUBLICITÉ HUMBLE (PREV EXXON)
Energy Balance : ice melting [355 kJ/kg]

75 kg ice melted/l Oil

 (1)
 Inc, T. LIFE; Time Inc, 1962.
LES BESOINS ÉNERGÉTIQUES D’UN BÂTIMENT

 3.8
 170 tonnes CO2 /an/100 m2
 70 CHF/mois/100 m2
CHF/mois/100 m2

 Energie

140 CHF/mois/100 m 2

 ! 75% import

 Chaudière
 30 CHF/mois/100 m2

 Maison unifamiliale typique
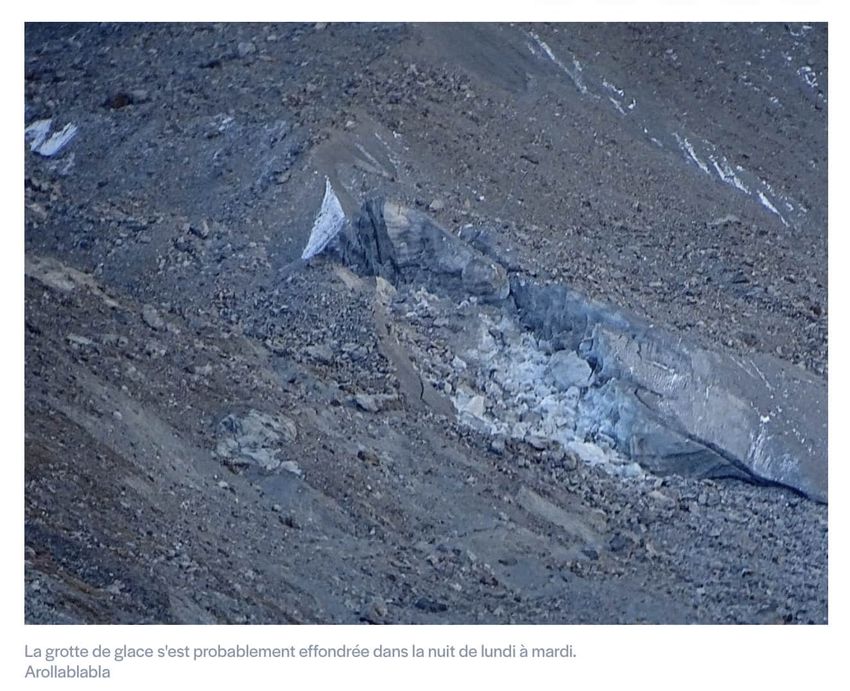
EN RÉALITÉ

 7
 kg glacier/kg CO2

18.8 kg / litre d’essence
1 kg glacier / km (6l/100 km car)
From 1970-2021 : Glacier inventory vs CO2 emissions
URGENCE CLIMATIQUE
How Many Gigatons of Carbon Dioxide...?
 !
 7 GtCO /year
 2 33 GtCO /year2 -10 %/an
have we released more can we are left to release?
to date? “safely” release*?
 what’s in the ground: 2755

1010 GtCO 2 500 335 710 780 1,265
added added our in fossil fuel remaining other reserves
1850-1999 2000-2015 ‘carbon reserves company (including state-owned)
 budget’ of all energy reserves that
 companies could be
 55%

 27%
 developed

 18%
 * before 2050 and still have an 80% chance
 CURRENT ANNUAL
 FOSSIL FUEL EMISSIONS 36 gigatons
 of staying below 2°C warming

 TIME BEFORE WE BREAK
 OUR ‘CARBON BUDGET’ 8 YEARS
 if emissions continue to increase at 2.5% per year

 All data & workings: http://bit.ly/CO2Gigatons2016
EST CE QUE NOUS AVONS UN PROBLÈME
 D’ÉNERGIE ?

 1.5 heures
 Soleil temps nécessaire pour fournir nos besoins annuels

 La centrale nucléaire
 de mère nature

 6500 ans
 Notre survie si nous utilisons 1 an d’énergie solaire
Our chalenge : Engineering the Ef ciency for a Net-Zero future
Renewable resources Investments Demand
 Where-When-How much ? (New) Technologies Products
 sizes : conversion and storage Services
 Infrastructure => synergies & mutualisation Security of supply
 Management
 Operation + Storage

 Circularity
 Waste to products
 CO2 to products
 Waste to energy
Waste-Water-Energy
 Citizens Sustainability metrics
 • Behaviours
 • Needs Wealth
 • Services Economy
 • Values Environment
 resiliency

 CO2 sequestration
 ©Francois Marechal -IPESE-IGM-STI-EPFL 2014
 fi
previous two years (Figure 1.1). Investment in all sectors of the economy as a share of GDP

 Est-ce que ca coûtera trop cher ?
 has been stable, suggesting that availability of capital generally has not been a constraint.
 The power generation sector accounted for most of the decline, due to fewer additions of
 10

 1 :Investment by industry 2.5 :Subsidies by countries 4.0

 François Maréchal – francois.marechal@epfl.ch
 coal, hydro and nuclear power capacity, which more than offset increased investment in
 solar PV. Capital spending on fossil fuel supply also stagnated at 34% below 2014.
 :Social cost
 Figure 1.1 Global energy investment in 2017 and percent change from 2016 to be paid by next gen

 1’800 Others
 1'602 bUSD 4’700 China
 1'400 bUSD 7’200
 bUSD (2017) bUSD (2015)
 bUSD (2015)
 repairing the damages
 EU
 289 bUSD
 USA
 India 649 bUSD
 RT&H (-13%) 20
 209 bUSD Russia
ME-409 ENERGY CONVERSION AND RENEWABLE ENERGY

 551 bUSD
 (-44%) 17
 Nuclear

 Global energy investment in 2017 fell for the third consecutive year, to USD 1.8 trillion, with declines in
 electricity and coal supply, while oil and gas grew marginally and efficiency rose 3%.

 Notes: RT&H = Renewable transport and heat. All values in USD (2017) billion. “Networks” includes battery 200 USD/t CO2
 storage.

 World energy investment 2018 IEA.org World energy subsidies 2015 imf.org Jarmo S Kikstra et al 2021 Environ. Res. Lett. 16
1830 : LA FORMULE MAGIQUE
 · · Tsource
 E = Qchauffage ⋅ (1 − )
 Tchauffage
Pour 10 unités de chaleur, 9 viennent de l’environnement et 1 sous forme de travail
 21 °C Besoins de chaleur
 Energie à acheter
 1

 Nicolas Léonard Sadi CARNOT (F)
 1796 - 1832
 0 °C

 Source : chaleur de l’environnement
RENEWABLE ENERGY HUB
 Big data - Forecasting

 J A D

 Predictive control
 *renovation
 Batteries Heat pumps

 Import
 Export
 Direct
 Hot water tanks Peak power
 Electrical grid
RENEWABLE ENERGY HUBS
 75+ % CO2 EMISSIONS REDUCTION
 1.10 0.25 - 0.04
 tons CO2 /y/cap tons CO2 /y/cap
 3.8
 m2PV/cap

 *renovation
 10 cts/kWh

 592 493
 CHF/y/cap
 CHF/y/cap
Energy : 542 CHF/y/cap Energy : 43 CHF/y/cap
Investment : 50 CHF/y/cap Investment : 450 CHF/y/cap
RENEWABLE ENERGY HUBS
 75+ % CO2 EMISSIONS REDUCTION
 1.10 0.25 - 0.04
 tons CO2 /y/cap tons CO2 /y/cap
 3.8
 m2PV/cap

 10 cts/kWh
 2
 2 02

 1018 493
 CHF/y/cap
 CHF/y/cap
Energy : 968 CHF/y/cap Energy : 43 CHF/y/cap
Investment : 50 CHF/y/cap Investment : 450 CHF/y/cap
RENEWABLE ENERGY HUB
LE DISTRIBUTEUR DÉCIDE DES INVESTISSEMENTS
 Multi-owners dwelling (880m2) - 1980
 22 residents - 6 electrical vehicles

 Electricity:
 feed-in 0.083 CHF/kWh
 retail 0.20 CHF/kWh

 Fuel
 heating oil: 0.9 CHF/L, or 0.09 CHF/kWh
 gasoline: 2 CHF/L, or 0.20 CHF/kWh
 CO2 emissions
 electricity: 0.17 kgCO2/kWh
 heating oil: 0.28 kgCO2/kWh
 gasoline: 0.28 kgCO2/kWh
Data production and energy system 16

 Energy of the human body

 Domestic Hot Water demand
RENEWABLE ENERGY HUB
 AND DATA PRODUCTION
 0.25 + 0.24 0.32
 tons CO2 /y/cap tons CO2 /y/cap
 3.8 4.5
 m2PV/cap m2PV/cap

969= 493 + CHF/y/cap
 476
 CHF/y/cap
 855 (-12%)
 CHF/y/cap
Energy : 43 CHF/y/cap 290 CHF/y/cap Energy : 115 CHF/y/cap
Investment : 450 CHF/y/cap 186 CHF/y/cap Investment : 450 CHF/y/cap
 Building Data center Bits heater : 290 CHF/y/cap
L’approche système 18

 Electricité : in/out

 Coût total : 2021/2023

 PV PV PV PV PV PV PV PV

 HP HP HP Cloud HP HP HP HP Cloud HP
RÉSEAU ANERGIE : MISE EN OEUVRE DANS LA VILLE
Sources de chaleurs Ė = Q̇(1
 Tcold
 ) Utilisateurs
 Thot
 PV
 chaud et froid

 Industrie: >80°C 1.25 kWth/kW
 30 °C

 Data center : 30°C 17°C L
 Eaux usées : 13-20 °C CO2 V
 0.85 kWth/kW
 Distribution : anergie
 Eau Nappe : 10 °C
 Rivières/lac : 7°C
 Géothermie : >10 °C 0.75 kWth/kW
 Refrigeration : < 0°C D. Favrat, C. Weber, CO2 based district energy system, U.S. Patent 2010018668
T
80°C

40°C

15 °C

 Liquide Vapeur
 CO2
 Température = 17°C
5 °C DHvap = 160 kJ/kg
 Pression = 50 bar

-5 °C source :
T
80°C
 Eau Chaude
 Chauffage
40°C

15 °C

 Liquide Vapeur
 CO2
 Temperature = 17°C
5 °C Pression = 50 b

-5 °C S. Henchoz, F. Maréchal and D. Favrat (Dirs.). Potential ofsource
 refrigerant
 : based district heating and cooling networks. Thèse EPFL, n° 6935 (2016)
T
80°C

 Eau Chaude
 Chauffage
40°C

15 °C

 Refroidissement

 Liquide Vapeur
 CO2
 Temperature = 17°C
5 °C Pression = 50 b

-5 °C S. Henchoz, F. Maréchal and D. Favrat (Dirs.). Potential ofsource
 refrigerant
 : based district heating and cooling networks. Thèse EPFL, n° 6935 (2016)
T
80°C
 Eau Chaude

40°C Chauffage

15 °C
 Eaux usées
 Refroidissement

 Lac Liquide Vapeur
 Rivière CO2
 Temperature = 17°C
5 °C Pression = 50 b

 Géothermie
-5 °C S. Henchoz, F. Maréchal and D. Favrat (Dirs.). Potential ofsource
 refrigerant
 : based district heating and cooling networks. Thèse EPFL, n° 6935 (2016)
T
80°C
 Eau chaude
 Chaleur résiduelle
 Municipal waste
 Rankine cycle
40°C Industry Chauffage

15 °C
 Eaux usées
 Refroidissement
 data centers
 Lac Liquide Gaz
 Rivière CO2
 Temperature = 17°C
5 °C DHvap = 160 kJ/kg
 Refrigeration
 Pression = 50 bar

 Géothermie commerces
-5 °C S. Henchoz, F. Maréchal and D. Favrat (Dirs.). Potential ofsource
 refrigerant
 : based district heating and cooling networks. Thèse EPFL, n° 6935 (2016)
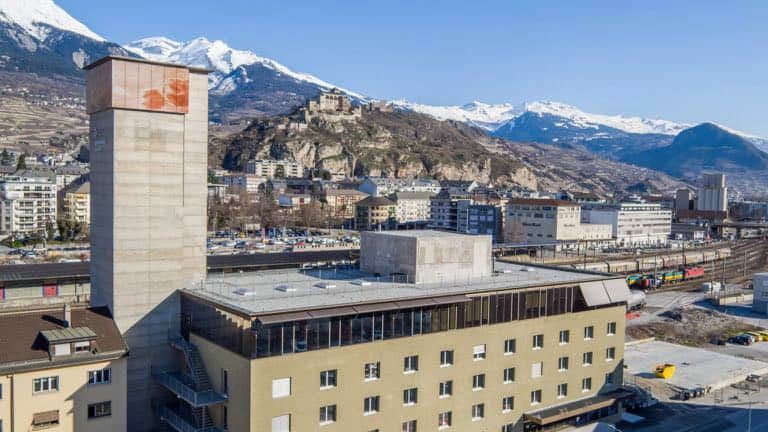
POMPE À CHALEUR URBAINE
 www.exergo.ch
 Demonstrateur Valais

 CO2 17°C
 50 bar

 Récupération de chaleur

 Pompe à chaleur

 Centre ville : bord du lac
 Refroidissement 84 % 6
 ans
 Economie d’énergie
 COP = 5.7 temps de retour

 Environnement
LES HUBS ENERGETIQUES DE LA VILLE

 Source de chaleur
 Industrielle

 H
 ab Bureaux Centre
 it
 at commercial
 STEP io
 ns
 Refrigeration

 Gare

 : aide à la décision pour la plani cation urbaine multi-critère
 fi
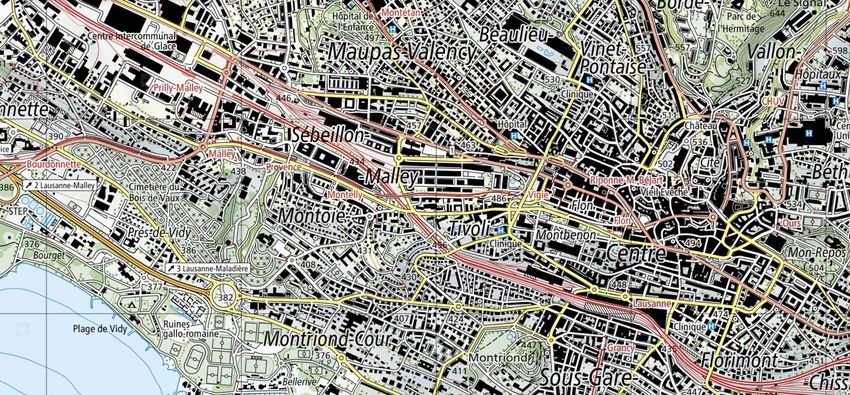
Evaluation de la demande : GIS System 27

 Raphaël Briguet
 ▪ Méthode statistique basée sur le
 travail de Girardin [1]

 ▪ 3 bases de données nécessaires:
 • RegBL
 • SwissTLM3D
 • SwissBuilding3D

 ▪ Attribuer un des 80 bâtiments
 types définis par [1]

 ▪ Signature thermique:
 ˙ = 1+ ⋅ 2 [kW/m2]
 22/09/2022

 Les points rouges représentent le RegBL et les zones bleues les modèles 3D des
 bâtiments
Qui connecter et comment ? 28

 Raphaël Briguet
 Design connexion intra-quartier

 ▪ Estimation de la longueur

 ▪ Utilisation du réseau de gaz pour
 calibrer le K

 ▪ Jusqu’à moins de 5% dans les
 quartiers clés

 Peu de données requises
 Réseau CAD proche du réseau gaz

 Données pas disponibles partout
 Considère un modèle en série
22/09/2022

 L’estimation de la longueur est calibrée grâce au réseau de gaz, représenté en rouge. La Travail diplôme Briguet 2022, Sierre
 couleur indique l’erreur entre l’estimation et la longueur du réseau de gaz.
Qui connecter et comment ? 29

 Raphaël Briguet
 Design connexion entre-quartier

 ▪ Utilisation du Minimum Spanning Tree

 ▪ OpenStreet Map : optimise l’itinéraire

 Tracé réalistique
 Ajout de contraintes possibles

 Temps de calcul plus élevé
 Représentation du réseau de chauffage qui fournit chacun des quartiers sélectionnés. Ne prend pas en compte les puissances
22/09/2022

 [m] [CHF]
 Travail diplôme Briguet 2022, Sierre
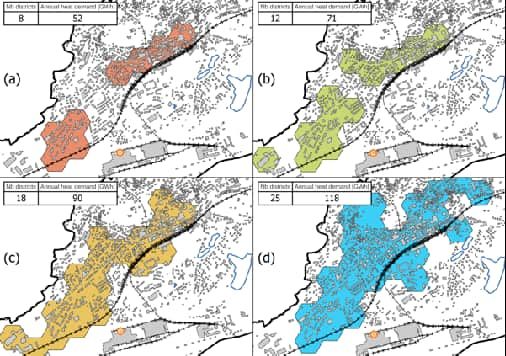
Extension Géographique paramétrique 30

 Raphaël Briguet
 ▪ (a) s’étend depuis le centre
 ville et depuis la zone Rossfeld

 ▪ (b) s’étend à l’hôpital

 ▪ (c) connecte le sud de la gare

 ▪ (d) zone résidentielle faible
 densité
22/09/2022

 Représentation de l’expansion du réseau.
 Travail diplôme Briguet 2022, Sierre
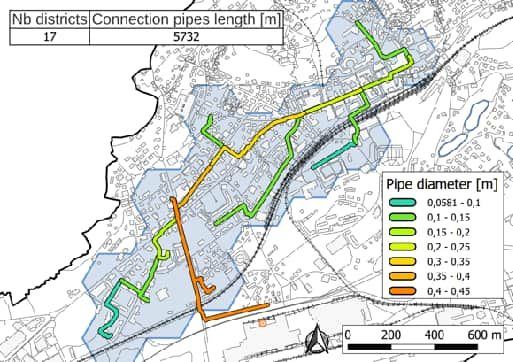
Infrastructure énergétique 31

 Raphaël Briguet
 ▪ Accès à la ville depuis
 l’ouest

 ▪ Rejoint le sud de la
 gare depuis le centre
 ville
22/09/2022

 Tracé optimisé du CAD pour un système à 55/45 oC
 Travail diplôme Briguet 2022, Sierre
Choisir le système de distribution de chaleur 32

 Raphaël Briguet
 4 systèmes comparés

 • 95/75 : pas d’unité décentralisée
 • 55/45 : pas unité décentralisée pour
 les bâtiments modernes (12% de la SRE)
 • 25/20 : unité décentralisée pour tous
 • 15/15 (CO2) : unité décentralisée pour tous

 Source de chaleur industrielle
 • 18 MW
 • 30 oC

 Niveau de température requis par les bâtiments pour le système de chauffage. 12% de la
 surface de référence énergétique (SRE) requiert une température de 40oC.
22/09/2022

 Travail diplôme Briguet 2022, Sierre
Optimisation des configurations 33

 Raphaël Briguet
 Pour chaque niveau de température:

 • Génération paramétrique de solutions
 [cts/kWh]/[GWh/an]

 Anergie : coût total comprend:
 • Investissement PACs décentraliséss
 • Opération PACs
 • Investissement réseau
 • Sources de chaleur

 Coût de l’énergie pour différentes configurations. Chaque point représente
 une configuration de réseau. La ligne rouge indique, pour une taille donnée,
 la solution la moins coûteuse.
22/09/2022

 Travail diplôme Briguet 2022, Sierre
POMPE À CHALEUR URBAINE ET PHOTOVOLTAÏQUE
 www.exergo.ch

 CO2 17°C
 50 bar
 PV
 Récupération de chaleur

 Pompe à chaleur

 Photovoltaïque
 Refroidissement

 Environnement
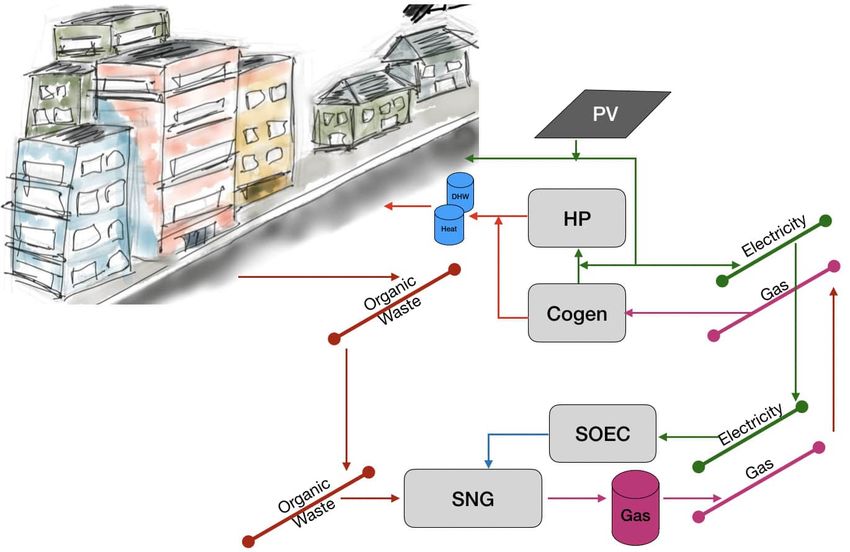
Integrating Renewable Energy Sources : Biogas + PV+ Power2gas
 building vs community
 • District scale => interactions between buildings
 Micro grid integration

 18 W/m2

 8W/m2 +1.3 Wy/y/m2
 Organic Waste

 !40% increase PV
 Waste water
 r
 12W/m2 !20% GWP reduction
 ate y
 a
 w
 ste cove
 r
 Power2Gas !16-40% facades
 W t re
 He
 a !building !district
 SS CN

 Waste water
Treatment plant 12 Wy/y/m2

 BioSNG Seasonal storage
 Current tariffs

 m2 = heated surface
 ©Francois Marechal -IPESE-IGM-STI-EPFL 2014
INTEGRATED ENERGY MANAGEMENT
 System Roundtrip 80%
 Summer
 Liquid CH4

 PV Winter

 CH4

 Co-electrolysis Fuel cell

 Liquid CO2 Fuel cells innovation (K-Valais)
Al-Musleh, Easa I., Dharik S. Mallapragada, and Rakesh Agrawal. "Continuous power supply from a baseload renewable power plant." Applied Energy 122 (2014): 83-93.
FOURNIR L’IMPORT PAR NOS DÉCHETS ?
 Electricity
 Gaz Naturel Synthetique Fuel cell
 (H2O)
 1 CH4

 Heat
Organic waste : 2C(H2O) Heat
 CO2
 1 CO2

 30% : Biomethanisation
 70% : Hydrothermal gasi cation ( )
 70% : Synthetic Natural Gas

 Gassner et al.,, Energy & Environmental Science 4, no. 5 (2011): 1742. Gassner et al., Energy and Environmental Science 5, no. 2 (2012):
 fi
PV
 PV STOCKER L’EXCÈS D’ELECTRICITÉ
 Ef ciency : 20 % O2

 PV
 O2
 Ef ciency : 78%

 captured
 CO2
 CH4
 H2O Stored energy
 Methane
 Co-Electrolysis
 Heat

 Arti cial photosynthesis : 13-16 % Solar ef ciency
 L. Wang, et. al. Optimal design of solid-oxide electrolyzer based power-to-methane systems: A comprehensive comparison between steam electrolysis and co-electrolysis. Applied Energy (211), 2018, 1060-1079.
fi
fi
 fi
 fi
PV COMBINER LES DEUX …
 PV
 Synthetic Natural Gas Gas grid
 1.3 x GN2011
 1 CH4

 Storage capacity
BIOMASS : C(H2O) 1 CO2
 H2O H2
 1 CH4
 4H2+CO2=>CH4+2H2O

 O2
 Electricity Grid
 Power to Gas
 CO2 sequestration
Gassner, Martin, and François Maréchal. "Thermo-economic optimisation of the integration of electrolysis in synthetic natural gas production from wood." Energy 33.2 (2008): 189-198.
Potentiel biomasse et stockage de l’électricité
 40

 160 160
 High Temp Heat from Wood Gasif.

 140 140 Manure & Sludge Digestates (HTG)

 Commercial & Industrial Organic Waste
 120 120
 (HTG)
 Green Waste (HTG)
Natural gas 2011 100 100
 Organic Household Garbage (HTG)

 Electricity (PJ/y)
 Energy (PJ/y)

 80 80 Agricultural Crops (HTG)

 Sewage Sludge (AD)
 60 60

 Manure (AD)
 40 40

 20 20

 0 0
 Primary Energy SNG Producti on SNG Producti on wi th Stored Electricity (P2G)
 Content P2G
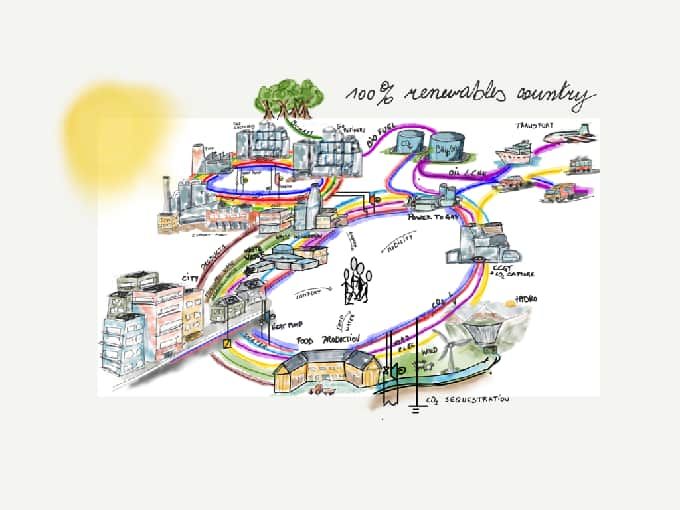
Energy Management
INTEGRATE : AUTONOMOUS CITIES
 Waste to energy CH4 CO2 2.5
 Power to Gas m3/100 m2ERA
 Gas to Power
 s
 Ga
 ste l i n g
 a oo
 ic W g/c
 r gan ati n city Grids
 O h e tr i
 r ic t E lec
 D ist
 PV
 Industrial Waste Heat
 Heat pumps
 Photovoltaic
 E-mobility
 Fuel cells
 Cooling 25 12.5 100 %
 Refrigeration m2 PV/hab k€/100 m2ERA Renewable

 Environnement
 Schorcht et al., 2013 [128], Pascal et al., 2015 [129], IPCC, 2018 [188], Wang et al., 2017 [130], Suhr et al., 2015 [131], IPESE, 2017 [132], Cusano et al., 2017 [133] , Roudier et al., 2013 [134], IPCC, 2007 [135]
CIRCULAR ECONOMY
 Construction materials Capture
 Chemicals
 Bio-plastics
 Papers Cx Hy

 Storage tanks
 Woody biomass
 C(H2O) CO2 Industry
 H2O H2
 CH4
 Mineralisation
Renewable Electricity

 O2
 Power to Gas District heating
 CO2 sequestration
Fossil carbon substitution per unit of biogenic carbon 43

 Wood [CHF/kg] 0.146
 Oil [CHF/kWh] 0.087
 Natural Gas [CHF/kWh] 0.024

 0.32

 0.48

 0.84
 Breakeven

 0.31
 (oil boiler)
Fossil carbon substitution per unit of biogenic carbon 44

 Wood [CHF/kg] 0.146
 Oil [CHF/kWh] 0.087

 2.8 - 3
 Natural Gas [CHF/kWh] 0.024

 0.32
 Fossil C substitution/C biogenic vs
 Burning wood
 District heating

 0.48

 0.84
 Breakeven

 0.64

 0.31 0.9
 (oil boiler)
Fossil carbon substitution per unit of biogenic carbon 45

 Do not burn wood !
 Wood [CHF/kg] 0.146
 Oil [CHF/kWh] 0.087
 Natural Gas [CHF/kWh] 0.024

 0.32

 0.48

 0.84
 Bio-Refinery : 5.5 times
 Breakeven

 0.64

 0.31 1.34 1.75
 0.9
 (oil boiler)
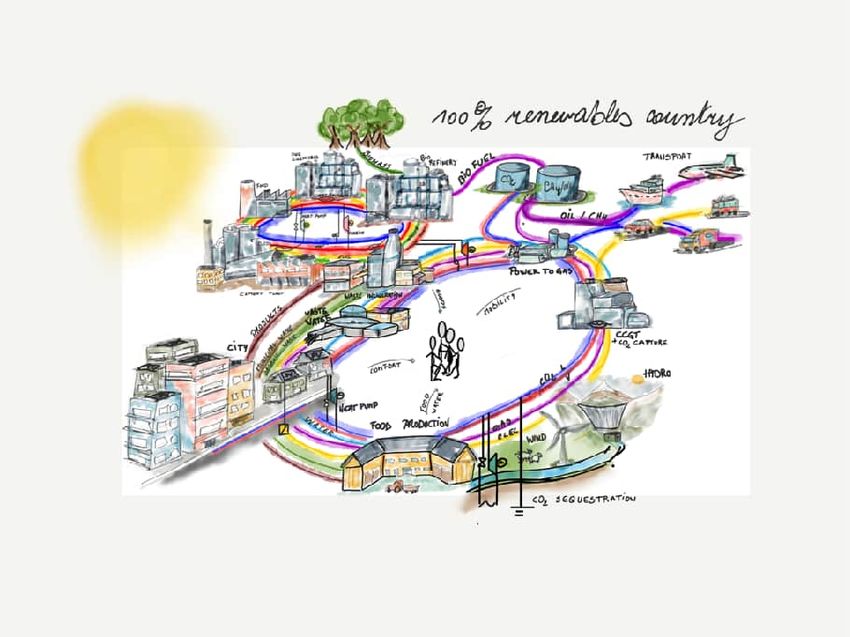
energyscope.ch : Systemic vision of independent and neutral Switzerland
 Investment
 Technologies : 1000 - 2000 [CHF/y/cap]
 Infrastructure : 1450 [CHF/y/cap]
 Biomass : 290 - 340 [W/cap]
 Waste : 180 - 230 [W/cap]

Liquid fuel : 20 - 90 [W/cap]
 CH4 : 60 - 170 [W/cap]
 H2: 20 - 110 [W/cap]

 Transport Air : 240 - 290 [W/cap]
 Freight : 70 - 90 [W/cap]
 Public: 60 - 90 [W/cap]
 Industry Elec: 110 - 140 [W/cap] Private: 100 - 140 [W/cap]
 Industry heat: 210 - 250 [W/cap]

 Building Elec: 270 - 320 [W/cap]
 Building heat : 630 - 740 [W/cap] PV : 230 - 570 [W/cap]
 Wind : 20 - 80 [W/cap]
 Hydro : 380 - 500 [W/cap]

 HP : 460 - 680 [W/cap] (21 - 34 %)
 CO2 seq : 1 - 1.5 [t/y/cap]
 DHN : 340 - 460 [W/cap] (48 - 72 %)
 Net CO2 emission: -0.6 - 0 [t/y/cap]
 Other : 110 - 170 [W/cap] (19 - 33 %)
Conclusions : net zero city 47

▪ Renewable energy hubs
 ▪ Efficacité
 ▪ Energie renouvelable
 ▪ Autoconsommation
 ▪ Intégration système
▪ Réseaux de chaleur
 ▪ Anergie
 ▪ Collecte de l’inefficacité
 ▪ Symbiose système
 ▪ Resources locales
 ▪ Retrofit et evolution
▪ Intégration système énergétique
 ▪ Gestion de l’énergie (multi-énergie)
Vous pouvez aussi lire