Overview on impact models, data needed and methodologies used for - impact assessment - UM6P_Ghani_24-27oct2018
←
→
Transcription du contenu de la page
Si votre navigateur ne rend pas la page correctement, lisez s'il vous plaît le contenu de la page ci-dessous
Overview on impact
models, data needed and
methodologies used for
  impact assessment
       Ghani Chehbouni , PhD
       Directeur de Recherche
             IRD/CESBIO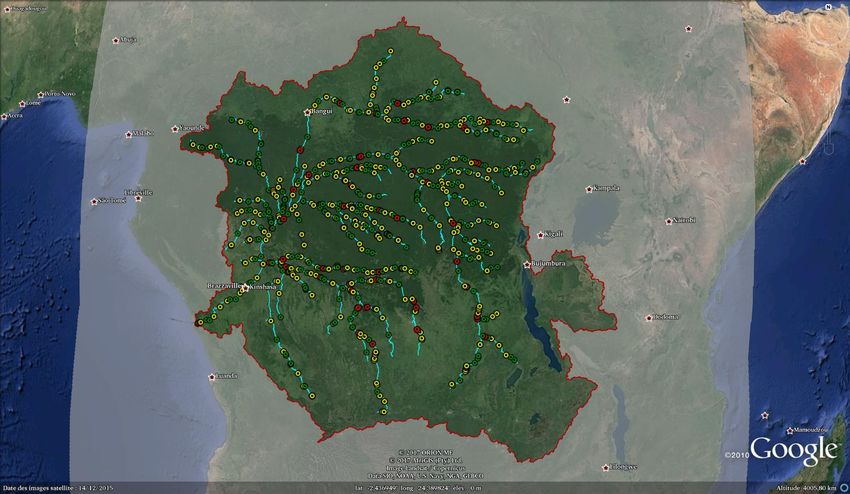
Water Cycle

   Evapotranspiration      Ville

La description des flux d’eau à la surface: l’humidité du sol
                  contrôle les échanges entre le sol, la végétation et l’atmosphère.

                 Soutenance de Thèse Y. Malbéteau - 18 Novembre 2016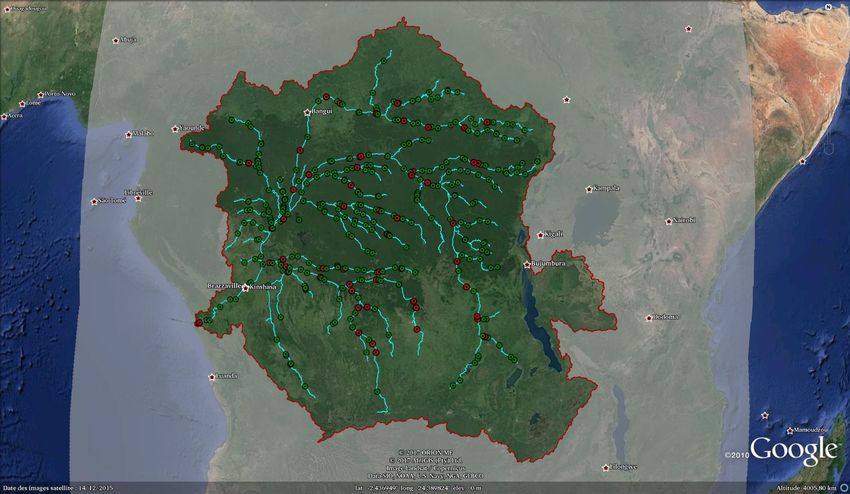
Précipitations

   Evapotranspiration      Ville

La description des flux d’eau à la surface: l’humidité du sol
                  contrôle les échanges entre le sol, la végétation et l’atmosphère.

                 Soutenance de Thèse Y. Malbéteau - 18 Novembre 2016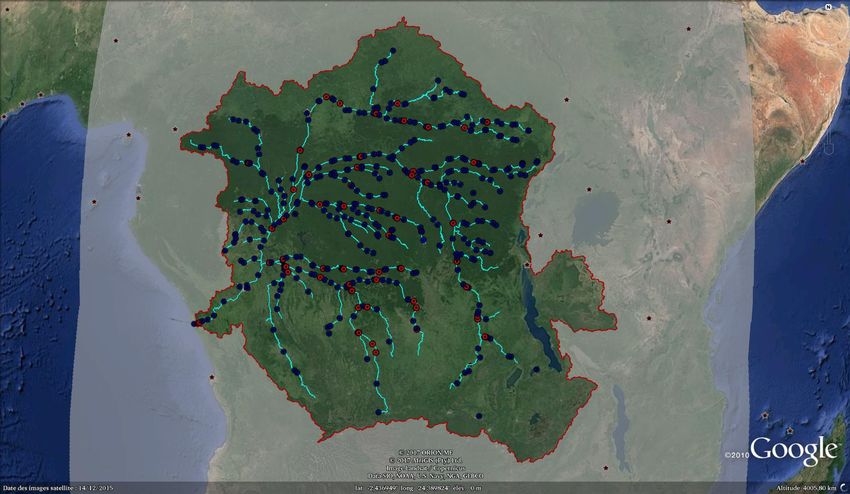
Précipitations

   Evapotranspiration      Ville

              Irrigation

La description des flux d’eau à la surface: l’humidité du sol
                  contrôle les échanges entre le sol, la végétation et l’atmosphère.

                 Soutenance de Thèse Y. Malbéteau - 18 Novembre 2016
Précipitations

   Evapotranspiration      Ville

                                     Ruissellement
              Irrigation

                Infiltration
La description des flux d’eau à la surface: l’humidité du sol
                  contrôle les échanges entre le sol, la végétation et l’atmosphère.

                 Soutenance de Thèse Y. Malbéteau - 18 Novembre 2016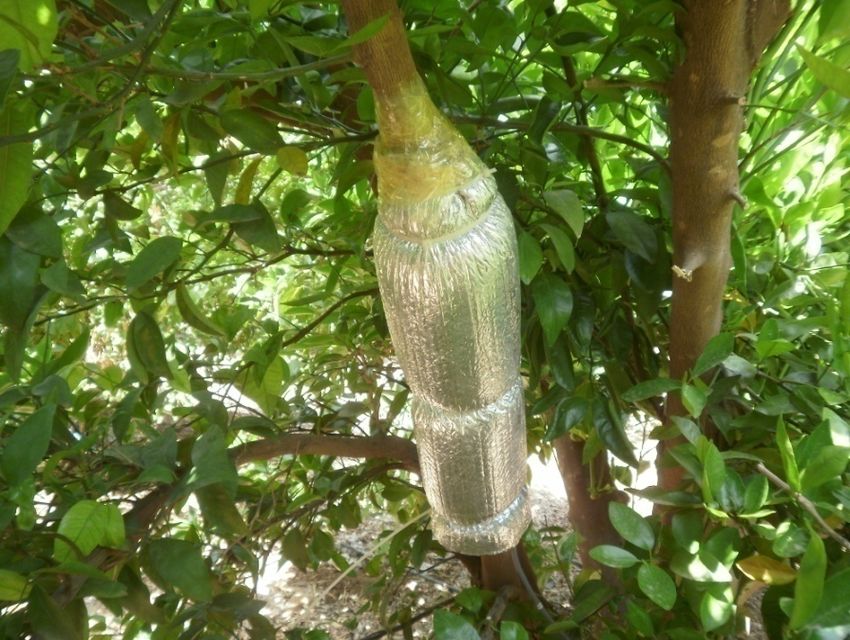
Autour de l’humidité du sol

                            Précipitations

   Evapotranspiration      Ville

La description des flux d’eau à la surface: l’humidité du sol
                  contrôle les échanges entre le sol, la végétation et l’atmosphère.

                 Soutenance de Thèse Y. Malbéteau - 18 Novembre 2016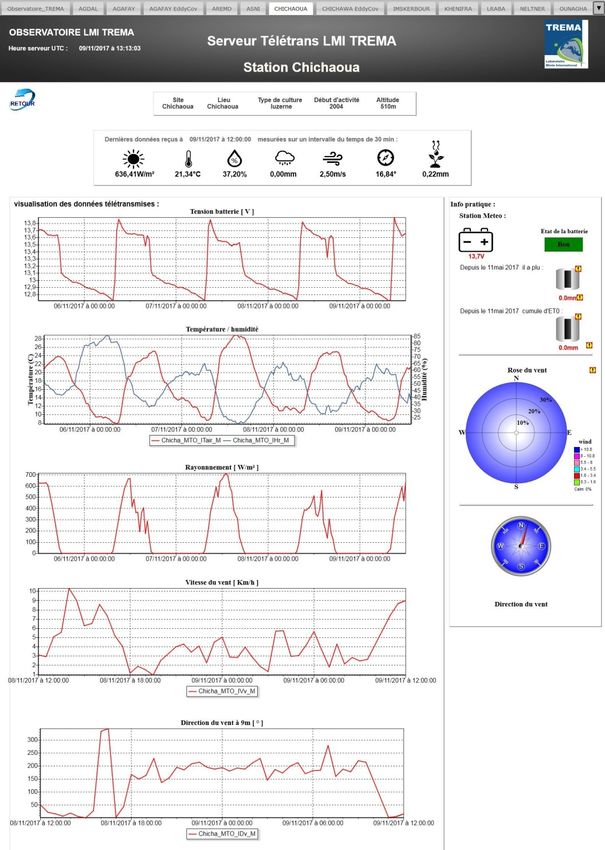
Upstream-downstream hydrological functioning

                                                 Spatialisation of snowpack
                                                  Précipitations
                                                            dynamic
                                   evapotranspiration
                                                              Snow
               Water flux in foothils
                   - Thermal tracking
evapotranspiration - Géochemistry
                                                        Improve water budget of
                   - Piézométry                         mountainous areas
                   - Scintillometry                     Þ Evapotranspiration
                                                        Þ Deep drainage
                Infiltrations
                       wadis
        groundwater
                                Deep drainage

     Improve the knowledge of the water budget of mountainous areas
      Précipitations = Streamflow + Infiltrations + Evapotranspiration
      (Infiltration= groundwater recharge, Evapotranspiration = loss !)       7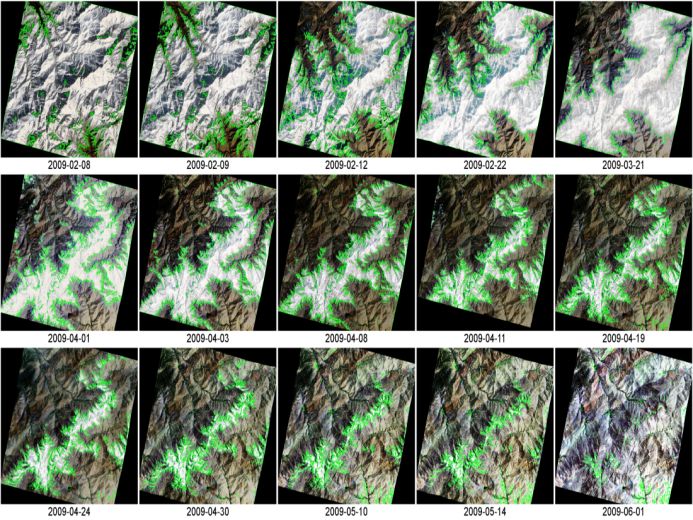
Snow station

  Meteorological Station
                               Runoff measurement
Sap flow
                           Isotopic                    LAI
                           measurements                               Scintillometry:
                                                                      Evapotranspiration
                                                                      over transects

 Crop water and energy          Water and energy soil fluxes                      8
 fluxes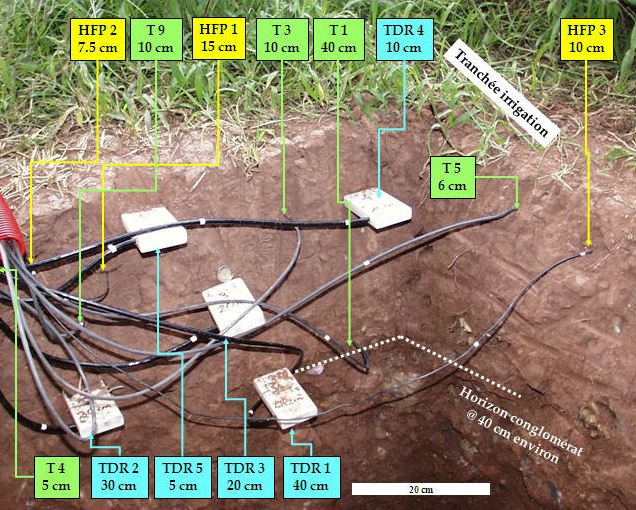
Observatoire
   Suivi temps réel sur
http://trema.ucam.ac.ma/

                           Télétransmission

      Base de
   données hydro-
   météorologiqu
         e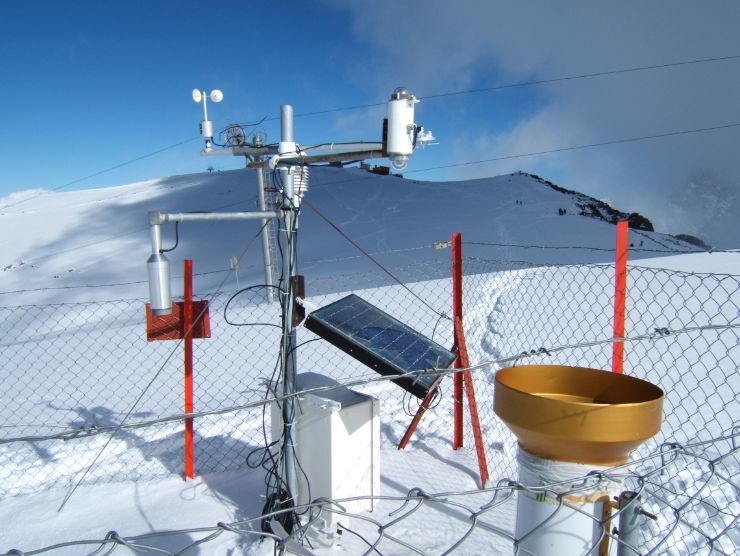
Climate spatialization
Main inputs for hydrological models
                                                                  Tensift

    •   SAFRAN system: optimal interpolation

                                                  Precipitation
        between meteorological stations and
        weather forecasting (ALADIN, DMN)

                                                Temperature
    •   Sparse meteorological network,
        particularly in the mountainous areas
How remote sensing helps monitoring natural resources
Remote Sensing
Spatialized and
repeated
observations
Complementarity
Ground =
reference
(calibration)
Remote Sensing =
spatialization
Synergy
Ground Processes
measurements modeling
Processes Physical exchanges
observation at surfaceConcept MODE DIRECT
Forçages
Observable y
Variable d’état x - Coefficient de
Modèle - Humidité(t) Modèle rétrodiffusion (t)
dynamique -Température (t) d’observation - Réflectances (t)
-Biomasse(t) - Température de
brillance (t)
Conditions
Paramètres
initiales
1) Assimilation
2) Identification de paramètres
3) Analyse du forçage
MODE INVERSE
Observations
Satellites
Visite des tutelles 12/09/2018Time frequency vs pixels resolution
PIXEL RESOLUTION (m)
FIEL OF VIEW (km)Multi-spectral/-resolution remote sensing
Low spatial resolution Visible/Near infrated
Thermal infrared
Diffusiomètres
ERS, ENVISAT, Microwave
Spatial resolution (metre)
10000
QuickScat
Medium spatial resolution
High spatial resolution
AVHRR
MODIS ASTER
1000 SPOT MODIS
VGT
SAR
100
HR² SPOT
10 HRV
Sentinel-1
Sentinel-2
1
1 10 20 30
Revisit time (days)
High dynamic à low revisit timeSoil surface moisture monitoring
Daily estimation of soil moisture
Þ An indicator of the hydrological functioning of continental surfaces
Þ Useful for irrigation monitoring
Exemple of the
Haouz plain
(Marrakech)Produit satellitaire humidité du sol
(CESBIO, Centre Aval de Traitement des données SMOS www.catds.fr)
Suivi journalier de l’humidité du sol :
=> Enjeu majeur en météorologie, hydrologie, agriculture, risque acridien…
Illustration du produit
CATDS sur une tuile MODIS
Algorythme DISPATCH – Processeur C4DIS au CATDSMonitoring of snow cover areas from space (1)
Daily MODIS product: free and real-time
Ø Cloudy images and snow/cloud discrimination
problemsà filtering based on time and space
MODIS neighbours
Band B4 and B6
Band MIR/B3/B0
Journalier Ø Validation: in situ data (SUDMED and IMPETUS
programs) and High resolution remote sensing
(FORMOSAT-2)
Before correction After correction
Cloud
Snow index:
NDSI
HR images
MOD10A1, 07/01/2001
Snow fraction(%)
Réduction Precision
du nombre ofde pixels
89%
occultés de 22.8% à 0.8%
Thèse A. Marchane, Marchane et al., 2015Hydrological modelling Mechanistic hydrometeorological chain (Habets et al., 2008)
Impact des changements climatiques sur la recharge

qEvolution de la recharge estimer par les débits
                         Hist (1990-2009)   RCP 4.5 (2020-2040)   RCP 8.5 (2020-2040)
                   0,2

                  0,15
   Recharge (m)

                   0,1

                  0,05

                    0

Initiative MedCORDEX (2 scénarios RCP4.5 et RCP8.5                                      19
Controlling the water budget of irrigated areas
Principle: exploiting synergies between sensors
to monitor crops functioning
Thermal remote sensing Optical remote sensing Microwave remote
(ex Landsat, Sentinel-3) (ex Sentinel-2) sensing (ex Sentinel-1)
Evaporation
Transpiration
Evaporation and Vegetation
transpiration development
efficiency
(through hydric
stress assessment)
Surface soil moisture
Root zone soil moisture 20Map of Annual Evapotranspiration (mm)
from 10/2008 to 09/2009
The average evapotranspiration from irrigation for the whole delta is 1150 mm, with
marked heterogeneities.
The area of crops obtained from MODIS images is 2.58 Mha
=> ~80%of available water is consumed by irrigation.Decision support system for water
distribution inside irrigated perimeters
Time to next water turn… Water height to input…
1ère semaine 2ieme semaine
1-25mm 25-40 mm 40-50 mm
3ieme semaine 4ieme semaine 50-60 mm 60-70 mm >70 mm
Simulation in the R3 sector (Haouz plain, 2800 ha)Impact on grain Yield
Impact on grain Yield
Irrigation water requirements for each sowing date, taking into
account temperature, precipitation and CO2 concentration
variations
Water productivity for each sowing date taking into account
changes in temperature, precipitations and CO2
Bridging the gap between spacial hydrology experts and Basin
                   agencies ……. In Africa
   1995 < /35 d < 2016 (~500 SV)          Congo River : building a data base and
   since 1992 /10d (~ 100 SV)
                                          developping operationnal applications,
                                          downstream services ,
                                          In one of the largest and less monitored basin in
              Since 2016 /27d (~400 SV)
                                          the world !

                                   from 2018 /27d
Constat d’un déficit d’information des gestionnaires pour prendre les bonnes décisions. => Communication d’information sur les flux d’eau dans un système aux décideurs (donc rien de révolutionnaire…)
Vous pouvez aussi lire