Sustainable development through climate leadership - Opportunities for LDCs in the transition to renewable energy
←
→
Transcription du contenu de la page
Si votre navigateur ne rend pas la page correctement, lisez s'il vous plaît le contenu de la page ci-dessous
Sustainable development through climate leadership-
Opportunities for LDCs in the transition to renewable
energy
By Anne Zimmer, Claire Fyson, Emily Theokritoff, Ziaul Haque and Tenzin Wangmo

    The climate action and sustainable development agendas are intrinsically linked. Limiting
    warming to 1.5°C will require systemic change that is integrated with sustainable development;
    at the same time, climate change action is itself one of the sustainable development goals.
    Taking these linkages into account can yield important opportunities for LDCs. So-called “co-
    benefits” arise when climate change mitigation measures create positive synergies with
    sustainable development. Incorporating these co-benefits when designing NDCs and making
    climate finance applications could help LDCs to achieve both ambitious climate action and
    sustainable development.

    This briefing identifies areas where such positive synergies exist, and explores the potential for
    a transition to a more sustainable and efficient energy system based on renewable energy to
    generate sustainable development co-benefits in the LDCs.

Key findings
Economic benefits: taking advantage of the renewable energy revolution
▪   Energy independence: Energy imports are a substantial burden to Least Developed Countries (LDCs)
    and a number of LDCs pay more for fuel imports than for education on a per capita basis. If all LDCs
    halved their spending on fuel imports by installing more domestic renewable energy capacity and
    enhancing energy efficiency, they could in total save over 7 billion USD per year in fuel import
    expenditures. Such savings could be used to finance necessary investments in renewable energy roll-
    out, or could be invested in other areas of development, e.g. in education and health.

                    Total spending on fuel imports by LDCs in 2017: over 15 billion USD

▪   Energy access: As shown in practice around the world, off-grid renewable energy technologies can
    provide opportunities to improve access to electricity even in remote areas.

           Total number of people lacking access to electricity in LDCs: over half a billion people
                 Share of rural population in LDCs lacking access to electricity in 2016: 66%
             Population lacking access to clean fuels and technologies for cooking: over 80%
                Only one out of three primary schools in LDCs has an electricity connection

▪   Reliability of electricity supply: An increase in renewable power generation could improve the
    reliability of electricity supplies and reduce losses in revenue caused by power outages.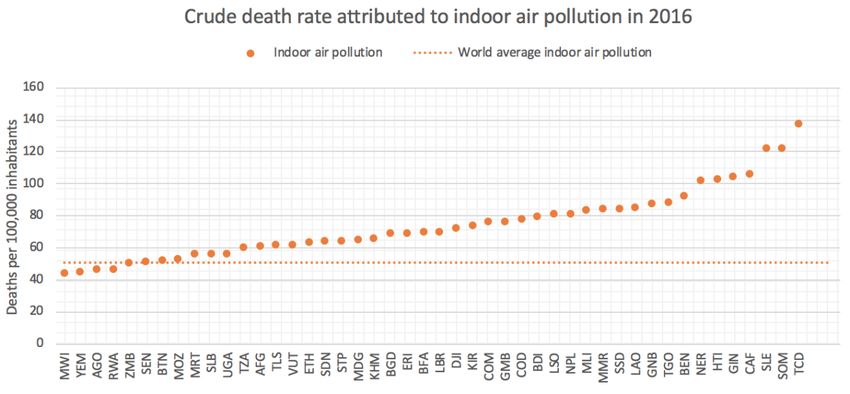
Over 75% of businesses in LDCs experienced power outages in 2017, resulting often in substantial
                                                revenue losses

▪     Energy prices: The costs of both on- and off-grid renewable power generation have fallen dramatically
      over the past decade. Solar photovoltaic (PV) module costs have dropped by 80% since 2009, and
      battery costs have fallen by over 70%, making off-grid options cost-competitive in currently
      unelectrified areas. From 2020, new solar PV and wind power installations will produce cheaper
      power than existing fossil fuel power plants, including the cheaper coal-fired options.

Employment benefits: sustainable job creation
▪     Investing in renewable energy can contribute to creating local employment opportunities in
      construction and installation as well as in Operations and Maintenance (O&M). The distributed nature
      of renewable energy technologies has great potential for job creation in rural areas.
      If doubling of electricity consumption was covered by new wind and solar capacity, total job creation
      potential across 18 LDCs is estimated to be:
          ▪   In construction and installation: between 1.8 million and 4.3 million job years
              (i.e. between about 365,000 and 870,000 annual jobs building up renewable energy
              capacities over a period of 5 years)
          ▪   In O&M: between over 100,000 and 250,000 jobs over the lifetime of the installations

Health benefits: air pollution reduction
▪     Indoor air pollution: Renewable energy technologies provide opportunities to reduce the exposure
      to health damaging household air pollution.

           Total number of deaths in LDCs from indoor air pollution in 2016 (estimates): over 685,000
      On average, 86% of the population in LDCs does not have access to clean technologies or clean fuels
                                                 for cooking

▪     Outdoor air pollution: Reducing fossil fuel combustion, e.g. from coal power plants or transportation,
      can reduce emissions of health damaging air pollutants.

               Total number of deaths in LDCs from outdoor air pollution in 2016: over 410,000
         Almost all of the population in LDCs is exposed to fine particulate matter (PM 2.5) concentration
                                           levels exceeding WHO1 limits

Development benefits: synergies with Sustainable Development Goals (SDGs)
▪     The roll-out of a more efficient, renewables-based energy system could substantially contribute
      towards achieving SDG 7 ‘clean, reliable and affordable energy for all’, SDG 3 on ‘good health and well-
      being’, SDG 8 ‘decent work and economic prospects’, SGD 9 ‘industry, innovation, and infrastructure’
      and SDG 11 ‘sustainable cities and communities’. Moreover, it could help reduce inequality (SDG 10),
      for instance between rural and urban areas, foster education (SDG 4), and reduce gender inequality
      (SDG 5).

1   WHO – World Health Organisation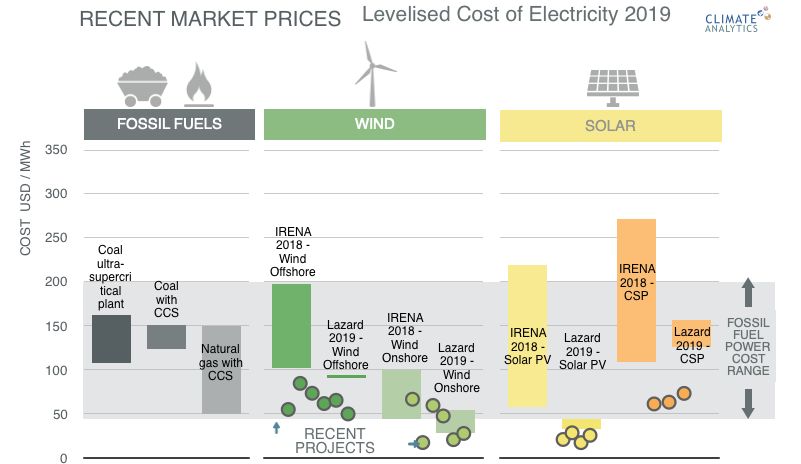
Développer durablement par le biais d’un engagement
climatique – Opportunités pour les PMA dans la transition
énergétique
Par Anne Zimmer, Claire Fyson, Emily Theokritoff, Ziaul Haque et Tenzin Wangmo

    Les agendas de l’action climatique et du développement durable sont intrinsèquement liés. Limiter
    le réchauffement à 1,5°C nécessite un changement systémique intégré au développement
    durable; en même temps, l'action climatique est elle-même un des objectifs du développement
    durable. La prise en compte de ces liens peut offrir d'importantes opportunités aux PMA. On
    appelle "co-bénéfices", les mesures d'atténuation au changement climatique qui créent des
    synergies positives avec le développement durable. L'intégration de ces co-bénéfices lors de la
    conception des CDN et de demandes de financements climat pourrait aider les PMA à réaliser des
    actions ambitieuses au niveau du climat et du développement durable.

    Ce rapport met en avant les domaines dans lesquels de telles synergies existent et explore le
    potentiel pour une transition vers un système énergétique plus durable et efficace basé sur les
    énergies renouvelables afin de générer des co-bénéfices durables pour les PMA.

Conclusions clés
Avantages économiques : tirer parti de la révolution des énergies
▪   Indépendance énergétique : Les importations d'énergie représentent un fardeau considérable pour
    les pays les moins avancés (PMA) et un certain nombre d'entre eux paient davantage pour les
    importations de combustibles que pour l'éducation par habitant. Si tous les PMA réduisaient de moitié
    leurs dépenses d'importation de combustibles en installant davantage de capacités nationales
    d'énergie renouvelable et amélioraient leur efficacité énergétique, ils pourraient économiser au total
    plus de 7 milliards USD en dépenses d'importation de combustibles par an. Ces économies pourraient
    servir à financer les investissements nécessaires au déploiement des énergies renouvelables ou être
    investies dans d'autres domaines de développement, comme l'éducation et la santé.
             Dépenses des importations de combustibles pour les PMA en 2017: plus de 15 milliards USD

▪   Accès à l'énergie : Comme le montre les pratiques autour du monde, les énergies renouvelables hors-
    réseau peuvent offrir des possibilités d'améliorer l'accès à l'électricité même dans les régions reculées.

            Personnes n’ayant pas accès à l'électricité dans les PMA: plus d’un demi-milliard de personnes
                   Population rurale dans les PMA n’ayant pas accès à l'électricité en 2016: 66%
       Population n’ayant pas accès à des combustibles et aux technologies propres pour la cuisine: plus de 80%
                        Seule une école primaire sur trois dans les PMA a accès à l’électricité
▪   Fiabilité de l'approvisionnement en électricité : Une augmentation de la production d'énergie
    renouvelable pourrait améliorer la fiabilité de l'approvisionnement en électricité et réduire les pertes
    de revenus causées par les pannes d’électricité.
Plus des trois quarts des entreprises des PMA ont connu des pannes d'électricité en 2017, entraînant des
pertes de revenus considérables
▪ Prix de l'énergie : Les coûts de la production d'énergie renouvelable pour le sur-réseau et hors-réseau
ont chuté de façon spectaculaire au cours de la dernière décennie. Les coûts des modules
photovoltaïques solaires ont chuté de 80 % depuis 2009 et les coûts des batteries ont chuté de plus
de 70 %, rendant les options hors-réseau compétitives en termes de coûts dans les zones actuellement
non électrifiées. A partir de 2020, les nouvelles installations solaires et éoliennes produiront de
l’électricité à un coût plus bas que les centrales à combustibles fossiles existantes, y compris les
options au charbon les moins chères.
Avantages sociaux : création d’emplois durables
▪ Investir dans les énergies renouvelables peut contribuer à la création d'emplois locaux pour la
construction et l'installation, ainsi que pour les opérations et l'entretien. La répartition des
technologies pour les énergies renouvelables offre également un grand potentiel de création
d'emplois dans les zones rurales.
Si le double de la consommation d’électricité était issue des nouvelles installations éoliennes et solaires, le
potentiel de création d’emplois dans les 18 PMA considérés est estimé à :
▪ Pour la construction et l’installation: entre 1.8 million et 4.3 million d’emplois
(c'est-à-dire entre 365,000 et 870,000 emplois annuels pour le renforcement des capacités d’énergie
renouvelables sur une période de 5 ans)
▪ Pour les opérations et l’entretien: entre plus de 100 000 et 250 000 emplois sur la durée de vie des
installations
Bienfaits sur la santé: réduction de la pollution de l’air
▪ Pollution de l'air intérieur : Les énergies renouvelables offrent la possibilité de réduire l'exposition à
la pollution de l'air intérieur qui est nuisible à la santé.
Décès dans les PMA en raison de la pollution de l’air intérieur en 2016: plus de 685,000
En moyenne, 86% de la population dans l'ensemble des PMA n'a pas accès à des technologies ou à des
combustibles propres pour la cuisine
▪ Pollution de l'air extérieur : La réduction de l’utilisation de combustibles fossiles, par exemple dans
les centrales à charbon ou le secteur du transport, peut réduire les émissions de polluants
atmosphériques nocifs pour la santé.
Décès dans les PMA en raison de la pollution de l’air extérieur en 2016: plus de 410,000
Presque toute la population des PMA est exposée à des concentrations de particules fines (PM2,5) supérieures
aux limites de l'OMS2
Avantages de développement : Synergies avec les Objectifs de Développement Durable (ODD)
▪ La transition énergétique pourrait considérablement contribuer à la réalisation de l’ODD 7
« Énergie propre et d'un coût abordable» , l’ODD 3 « Bonne santé et bien-être», l’ODD 8 « Travail
décent et croissance économique», l’ODD 9 « Industrie, innovation et infrastructure» et l’ODD 11
« Villes et communautés durables». De plus, cela pourrait contribuer à réduire les inégalités (ODD
10), notamment entre les zones rurales et urbaines, à promouvoir l'éducation (ODD 4) et à réduire
les inégalités entre les sexes (ODD 5).
2 Organisation Mondiale de la Santé1. The urgent need for more ambitious climate action
In 2018, the Intergovernmental Panel on Climate Change (IPCC) released its groundbreaking Special
Report on Global Warming of 1.5°C. The report’s messages are very clear: climate change poses a severe
threat, with risk being lower at 1.5°C than at 2°C or higher mean temperature increases. The impacts of
warming will hit the most vulnerable the hardest. However, avoiding these more severe risks is still
feasible, but requires cutting global CO2 emissions by about half by 2030, to reach net-zero by mid-
century. The report has found that current Nationally Determined Contributions (NDCs), if locked in until
2030, would render 1.5°C unachievable.
To achieve such a rapid reduction in emissions, the IPCC found that rapid and far-reaching transitions of
our energy, land, urban and industrial systems will be required globally. These include:
• A rapid scaling up of near-term action up to 2030. Total greenhouse gas emissions need to be
reduced by about 50% by 2030 compared to today (45% below 2010 levels).
• A phase out of coal by mid-century, while renewables grow to provide over three quarters of
electricity globally
• Electrification of energy use in transport, industry and buildings
• Enhanced agricultural management combined with reduced food wastage and a shift to
healthier, more sustainable diets
• A steep reduction in deforestation, accompanied by conservation and restoration of natural
ecosystems and land carbon stocks
Both the impacts of climate change and options for its mitigation are closely linked to sustainable
development. Climate change threatens to wipe out progress already made in sustainable development
and poverty eradication. Conversely, there is potential for synergies between achieving sustainable
development objectives and climate change mitigation action, provided that emissions reductions policies
are planned and implemented in a way that does not leave the poor and vulnerable behind. There is
therefore a clear case for climate action to be made a core component of any country’s sustainable
development plans.
Any delay in reducing emissions through such transformations will make it costlier and more difficult to
limit warming. Continuing to develop in a carbon intensive manner will lead to lock-in into high carbon
development trajectories, raising the risk of stranded assets that cannot be used in a low carbon world.
Instead, an early steering towards a low carbon, sustainable development pathway can prevent such lock-
ins, enabling a balance between economic prosperity, social well-being and environmental protection.
Current pledges under the Paris Agreement are collectively heading for a warmer-than 3°C world3 – a level
of warming that would be devastating, in particular for vulnerable populations such as those living in the
LDCs. All countries need to secure faster, deeper emissions reductions to keep the 1.5°C warming limit
within reach, and the IPCC’s Special Report provides a clear roadmap for how to do this. This message was
further amplified in the run up to the Climate Action Summit by the UN Secretary-General, António
3 https://climateactiontracker.org/global/temperatures/Guterres, who called on world leaders to bring forward concrete, realistic plans for enhancing their NDCs
by 2020, to be consistent with the IPCC’s findings of reducing greenhouse gas emissions by 45 per cent
below 2010 levels by 2030, and to net zero emissions by 2050.
While LDCs have not contributed much to historical emissions, the development pathways any country
chooses – in particular for those LDCs with rapidly growing populations and energy needs – can shape
future chances of mitigating dangerous climate change and thereby influence future development
prospects for all countries.
This briefing outlines how the LDCs themselves can benefit from following a low carbon development
trajectory, focusing on the transition to a more efficient energy system powered by renewables.
Additionally, Annex 1 provides country specific information for all LDCs on the potential for low carbon
development to generate co-benefits, and Annex 2 provides links to tools on climate change impacts at
the national and regional levels.
2. Co-benefits – a way of achieving multiple socio-economic goals
Historically, countries have often perceived climate change mitigation measures to be in conflict with
economic development, prioritizing economic growth over environmental or climate objectives. However,
research shows that many options for reducing CO2 emissions can yield synergies for achieving other
societal objectives.4 These positive side effects of climate change mitigation measures are often called
‘co-benefits’.
There are many different forms of co-benefits. There can be economic co-benefits such as creation of
employment and increasing the quality of jobs, labour savings for households, improving livelihoods,
increasing entrepreneurship opportunities, reducing expenditures on fossil fuel imports, thereby reducing
susceptibility to market price volatility and stimulating innovation and technological change. Co-benefits
can relate to the environment, such as improving air, water and soil quality, and protecting biodiversity.
Co-benefits of climate action can also have social dimensions, including enhanced access to clean energy
and reduced health impacts, as well as positive political and institutional impacts, for example improving
institutional structures or enhancing cooperation between different institutions or ministries.
The way a climate policy or measure is designed, as well as the national context and circumstances, can
strongly affect the impact of the policy or measure, both with regard to reducing carbon emissions as well
as building resilience to potential negative side effects. Potential trade-offs, such as unwanted
distributional impacts, can be avoided or lessened if policies are carefully designed and complemented by
other measures (IPCC Special Report on 1.5°C, 2018). 5
For most LDCs, energy generation from imported fossil fuels is costly and exposes electricity costs to
international price fluctuations6. At the same time, burning fossil fuels and traditional biomass contributes
to air pollution, with associated health problems, and produces over 90% of CO2 emissions7. A
4 See e.g. Ürge-Vorsatzet al. (2014): Measuring the Co-Benefits of Climate Change Mitigation Annu. Rev. Environ.
Resour. 39 549–82 Online: http://www.annualreviews.org/doi/10.1146/annurev-environ-031312-125456
5 https://www.ipcc.ch/sr15/
6 UNCTAD 2017. The Least Developed Countries Report 2017: Transformational Energy Access
https://unctad.org/en/PublicationsLibrary/ldcr2017_en.pdf
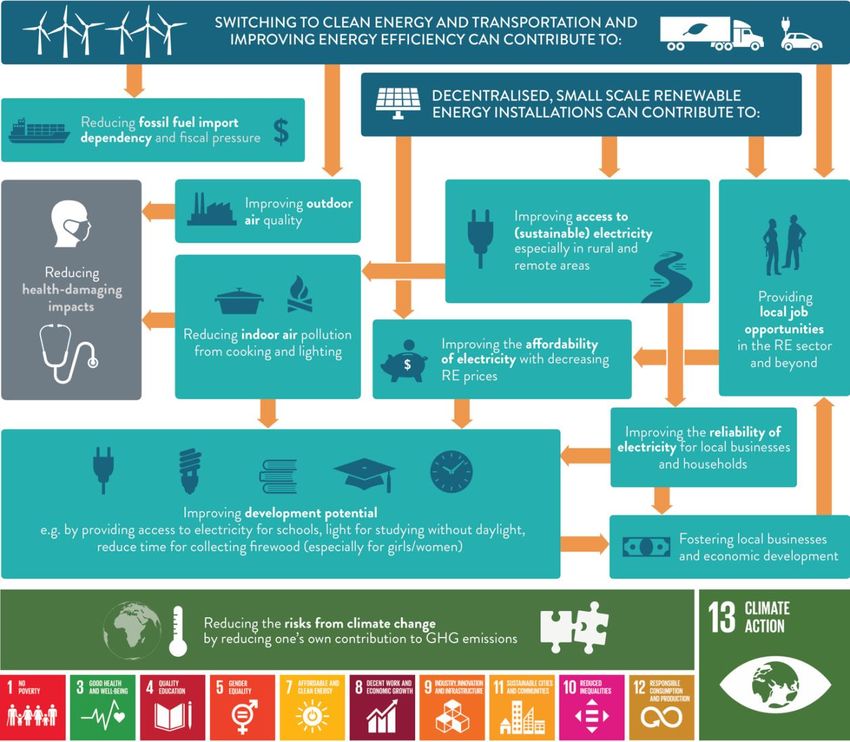
7 Data from the PRIMAP-hist dataset, see https://www.pik-potsdam.de/primap-live/primap-hist/transformation of the energy system towards increased use of sustainable renewable energy sources, such as solar PV and wind energy, combined with energy efficiency measures, can therefore come with a host of economic and social co-benefits for sustainable development, as illustrated in Figure 1. Figure 1: How the transformation of the energy system can contribute to other sustainable development objectives. Source: Climate Analytics8. The importance of the energy sector for the LDCs in achieving sustainable development is reflected in the current NDCs brought forward by LDCs, all of which include the energy sector. 44 out of 47 NDCs include renewable energy targets, and 31 include targets for energy efficiency. However, only four LDC NDCs mention the co-benefits that could come with such measures. 8 Climate Analytics (2019). Decarbonising South and South East Asia: Shifting energy supply in South Asia and South East Asia to non-fossil fuel-based energy systems in line with the Paris Agreement long-term temperature goal and achievement of Sustainable Development Goals. https://climateanalytics.org/media/decarbonisingasia2019- fullreport-climateanalytics.pdf
Understanding the impact of these benefits could help LDCs to redirect domestic energy finance away
from inefficient fossil fuel subsidies and mobilise private and international climate finance to fund the
shift to a renewables-based energy system. While the number of climate and green financing facilities
with a focus on sustainable development and climate action has been growing, a recent UNFCCC report
found that the identification of co-benefits of climate action remains a key challenge in mobilising and
delivering finance 9. This briefing and accompanying country-specific data sheets (Annex 1) therefore
outline the multiple socio-economic co-benefits that can arise from a transition towards renewable
energy in LDCs.

    Availability of international finance under the UNFCCC
    The 1.5 Special Report from the IPCC (2018) states that to meet the 1.5°C target, the annual average
    investment needed in the energy system is around 2.4 trillion USD2010 between 2016 and 2035.
    All LDC NDCs mention energy, 44 mention renewable energy and 31 mention energy efficiency, whereas
    only 22 mention clean cooking and heating. International support for the full implementation of these
    NDCs is critical as many targets are conditional – even though the costs of renewable energy have come
    down, access to finance remains a significant barrier to implementation.
    Only 4 LDC NDCs mention co-benefits of mitigation. Putting a greater focus on mitigation co-benefits is
    therefore a possible area for improvement in new and updated NDCs to be communicated by 2020, as
    funders seek to mainstream climate change objectives into their development funding or identify
    benefits for sustainable development from climate finance.
    Finance institutions have been increasingly focusing on sustainable development and climate action.
    Under the UNFCCC, finance mechanisms are available for LDCs, mainly through the Green Climate Fund
    (GCF) and the Global Environment Facility (GEF).
    The GCF is the biggest global climate fund that supports developing countries to address climate change
    by shifting towards a low emission and climate resilient development. The GCF aims to allocate about
    half of its portfolio to mitigation, and a large share of its recent mitigation funding has been allocated to
    energy access and power generation10. Of the 124 projects approved by the GCF as of November 2019,
    47 (38%) involve LDCs11. Of these, 17 (36 %) were energy projects.
    More information on GCF funding: https://www.greenclimate.fund/gcf101
    The GEF funds are available to developing countries and countries with economies in transition to meet
    the objectives of the international environmental conventions and agreements.
    More information on GEF funding: https://www.thegef.org/about/funding

9 UNFCCC 2018. Report of the Standing Committee on Finance to the Conference of the Parties, 23 November 2018,
FCCC/CP/2018/8 https://unfccc.int/sites/default/files/resource/FCCC_CP_2018_8_0.pdf
10 8th Report of the GCF to the Conference of Parties to the UNFCCC, 2019.

https://unfccc.int/ttclear/misc_/StaticFiles/gnwoerk_static/tn_meetings/ea7aa7cfc8b84e709342cb7d1b2fbf8d/fe
7006766ab247e2b5cef9fb52ebdf72.PDF
11 https://www.greenclimate.fund/what-we-do/portfolio-dashboard
3. Energy security – reducing fossil fuel import dependency,
improving energy access and affordability
3.1 Energy independence through reducing reliance on fossil fuel imports
In 2017, LDCs spent more than 15 billion USD on importing fossil fuels such as oil products, coal and gas
for energy generation. At least 12 LDCs (mostly African LDCs) spend over 5% of their total GDP on such
imports, which in many cases is in a similar order of magnitude as expenditure on health care. On a per
capita basis, a number of LDCs spend more on fuel imports than on education. This fuel import
expenditure could be reduced by investing in renewable energy and energy efficiency. Since renewable
energy is generated domestically, its deployment reduces the need to import fuels. More renewables
would therefore reduce this economic burden and contribute to energy independence, freeing up
valuable resources for investments in, for example, health (contributing to SDG 3) and education
(contributing to SDG 4) as well as to invest in building up additional renewable energy infrastructure and
energy efficiency measures (SDG 7 on clean energy).
Improved energy efficiency can also lower the need for fuel imports and facilitate the shift to renewable
energy by reducing energy demand and improving the efficiency of the power supply system. This will be
particularly important as demand for energy grows in the future. For example, the government of
Bangladesh’s energy efficiency and conservation master plan12 anticipates that a reduction in power
demand, to reach 20% below business-as-usual levels by 2030, would lead to an annual saving of BDT 135
billion (equivalent to ~1.6 billion USD, or about 1 % of GDP in 2013).
If all LDCs reduced their fuel imports by half (from 2017 levels), this could free up over 7 billion USD per
year for expenditure elsewhere. Bangladesh, Myanmar, Tanzania, Ethiopia and Nepal could each save
more than half a billion USD per year if they cut their fuel imports in half, according to data from 2015-
2017). In terms of the proportion of total GDP, Mozambique, Togo and Mauritania have the highest saving
potential, each having spent more than 8% of their GDP on fossil fuel imports in 2017 (own calculations
based on WDI data, see country data tables in Section 3).
3.2 Energy Access
Energy access is currently a big challenge for many LDCs, with over half a billion people lacking electricity
access in 2016 according to the World Banks’s World Development Indicators (WDI). For 32 LDCs, more
than 50% of the population still lives without access to electricity (Figure 2, left), despite progress in
increasing in electricity access over the last two decades. For comparison, the world average was only 13%
of the population without electricity access in 2016, shown by the pink line in Figure 2 (left). Rural
populations have the lowest levels of electricity access – across all LDCs, around 65% of the population
living in rural areas does not have access to electricity, and in 23 LDCs this number goes up to more than
80% of the population (Figure 2, right).
12
Energy efficiency and conservation master plan up to 2030, 2016.
http://www.sreda.gov.bd/d3pbs_uploads/files/policy_2_energy_efficiency_and_conservation_master_plan_up_to
_2030.pdfTotal population Rural and urban population Figure 2: Population lacking access to electricity. National level (left) and differentiated by urban and rural population (right). Source: Data from WDI. Moreover, even households with access may have electricity for only limited hours a day. Lack of connectivity also affects education – looking at the years 2015-2017, only about a third of primary schools across LDCs reported that they have access to electricity during this time (Figure 3, left). Moreover, access to electricity, for example provided by off-grid solar home systems in remote areas, can also benefit rural households by creating the opportunity to make use of stored electricity during night time for studying, income generating activities or recreation (see also Box below on off-grid renewables for improving energy access). Looking beyond electricity, access to clean fuels for cooking and lighting is also important. In most LDCs, more than 80% of the population lack access to clean fuels and technologies for cooking, often causing severe indoor air pollution (Figure 3, right). The damaging impacts of continued use of polluting fuels on health, as well as options for shifting to cleaner fuels, are explained in the section on air pollution below.
Primary schools without access to electricity                 Population without access to clean fuels and
                                                                            technologies for cooking

Figure 3: Left: lack of access to electricity in primary schools, source: SDG database, data for years 2015-2017. Right: lack of
access to clean fuels and technologies for cooking in 2016, LDCs grouped by share without access, source: Data from WDI.

Distributed renewable power generation (for example, off-grid solar home systems and mini-grids) offers
a fast and cost-effective way of providing people in rural areas with electricity in a way that can be tailored
to local conditions (see Box below), which can directly contribute towards achieving SDG 7 by improving
access to electricity and clean modern technologies. By improving energy access in off-grid areas,
distributed renewables can moreover contribute to development and reduce inequality (SDG 10) by
providing energy services such as lighting, cooking, cooling and also access to information technology for
homes, shops, companies, and public institutions like schools (SDG 4) or healthcare facilities (SDG 3).

 Off-grid renewables for improving energy access
 Compared with other groups of countries, LDCs have a much less diversified energy supply (UNCTAD
 201713), with traditional biomass (wood, agricultural waste, dung) forming the main source of energy.
 Currently, most of the modern renewable energy deployed in the LDCs is hydroelectricity, for example
 in Bhutan and Lao People’s Democratic Republic. However, off-grid renewables such as solar home
 systems have become increasingly widespread in a number of countries, including some LDCs, leading
 to improvements in access to energy services such as lighting, cooking, appliances, heating and cooling.
 Distributed renewable power generation can also ameliorate local health services, provide opportunities
 for enhancing women’s active engagement (SDG 5 on gender equality), and create local job
 opportunities (IRENA 2019 14) and can foster education by allowing to study without daylight (SDG 4 on
 education).
 The last decade has seen exponential growth in the market for off-grid solar systems. In 2016, 9% of the
 population of Bangladesh and 6% of the population of Nepal had access to off-grid solar PV (REN21,

13   UNCTAD (2017): The Least Developed Countries Report 2017, Transformational Energy Access, Chapter 2.
https://unctad.org/en/PublicationChapters/ldcr2017_ch2_en.pdf
14IRENA (2019): https://www.irena.org/-/media/Files/IRENA/Agency/Publication/2019/Jan/IRENA_Off-
grid_RE_Access_2019.pdf
201915). In African LDCs the shares are lower (3% for Uganda and Rwanda), but in many cases are growing rapidly (REN21, 2019). In Tanzania, the installed capacity of off-grid solar PV grew five-fold between 2013 and 2016; the Democratic Republic of Congo (DRC) saw sales more than triple between 2016 and 2017, while in Uganda more off-grid systems were deployed in 2017 than the number of grid connections made by utility companies and rural electrification agencies (REN21, 201816). Solar home systems are not the only option – mini-grids are also growing in popularity, bringing solar powered electricity to off-grid communities in Bangladesh, Myanmar and Tanzania. Afghanistan and Madagascar have even installed hydro-power based mini-grids to electrify rural mountainous communities (REN21, 2018). Use of waste-derived biogas as a clean cooking fuel has been growing in a number of LDCs, including Bangladesh, Nepal, Ethiopia, Tanzania, Burkina Faso and Uganda (REN21, 2018), with reported benefits such as reduced workload, boosted farm productivity and reduced lighting and cooking costs (IRENA, 201717). 3.3 Reliability of energy supply Related to this is the reliability of electricity supply, especially for businesses, where more frequent power outages can inhibit economic success. In 2017, over three quarters of firms in LDCs experienced power outages – on average 10 outages per month – with those businesses affected losing on average 8% of their sales as a result. As Figure 4 shows, affected firms in some LDCs report losses of over 15% of sales due to power cuts – well above the global average. Such challenges slow down LDCs as they grow and transform their economies. An increase in renewable energy generation could provide more reliable electricity access and reduce these losses, contributing to fostering economic prospects (SDG 8). Figure 4: Indicators on the reliability of electricity supply and implications for business prospects. Left: LDCs grouped by the share of businesses that report to have been affected by power outages. Right: LDCs grouped by the reported share of value lost due to power outages (in % of sales of affected businesses). Source: Data from WDI. 15 REN21 (2019): Renewables 2019 Global Status Report: https://www.ren21.net/gsr- 2019/chapters/chapter_04/chapter_04/#target_2 16 REN21 (2018): Renewables 2018 Global Status Report. http://www.ren21.net/wp-content/uploads/2018/06/17- 8652_GSR2018_FullReport_web_final_.pdf 17 IRENA (2017): Biogas for domestic cooking technology brief. https://irena.org/publications/2017/Dec/Biogas- for-domestic-cooking-Technology-brief
3.4 Affordability of energy
Between 2000 and 2017, the average global costs of electricity generated from renewable sources has
declined by 25 % for onshore wind and 72 % for solar PV (see Table 1 and Climate Analytics’ policy brief).
It is now commonly cheaper to deploy bioenergy, hydropower, onshore wind and solar PV projects than
new fossil fuel power generation; Figure 5 illustrates how recent renewable energy projects exhibit
lower costs (see Figure 5).

The International Renewable Energy Agency (IRENA) projects that from 2020 onwards new solar and wind
projects are set to be even cheaper than the cost of continuing to operate existing fossil fuel power plants.
More than three-quarters of new wind and solar installations coming into service around the world next
year are cheaper than the fossil fuel alternatives.18 Off-grid technologies are also cost-competitive for
expanding electricity access into currently unelectrified areas, with solar PV module costs having fallen by
80% since 2009 and the prices of LED lights and batteries – key components of solar home systems – have
fallen by 80% and 73% respectively19. Renewables can therefore contribute to providing affordable
modern energy to all (SDG 7), particularly if they are combined with highly efficient appliances, which use
less energy and therefore drive costs down even further REN21, 201820.

These economic cost estimates do not even include social costs of climate impacts, health issues from air
pollution and damages to the environment, e.g. from resource extraction. Such social costs are much
higher for conventional energy sources than for renewable energy, meaning that a switch to renewables
has economic benefits beyond the affordability of energy.

 Costs of renewable electricity (LCOE) 21                                       Onshore wind          Solar PV
 Average cost of renewable electricity in Africa (2014)                         0.09 USD/kWh          0.19 USD/kWh
 Average cost of renewable electricity in Asia (2014)                           0.06 USD/kWh          0.16 USD/kWh
 Global cost development 2000-2017 (%)                                          -25%                  -72%

Table 1: Regional costs of onshore wind and solar PV (LCOE) and global cost development. Source: IRENA dashboard22

18 IRENA 2019: https://www.irena.org/publications/2019/May/Renewable-power-generation-costs-in-

2018?utm_source=All+IRENA+contacts&utm_campaign=46ce6f632c-
EMAIL_CAMPAIGN_2019_05_21_06_13&utm_medium=email&utm_term=0_29b5801035-46ce6f632c-66498829
19 IRENA 2019: https://www.irena.org/-/media/Files/IRENA/Agency/Publication/2019/Jan/IRENA_Off-

grid_RE_Access_2019.pdf
20 REN21 (2018): Renewables 2018 Global Status Report. http://www.ren21.net/wp-content/uploads/2018/06/17-

8652_GSR2018_FullReport_web_final_.pdf
21 Levelized costs of electricity (LCOE) describe the cost per unit of electricity (e.g. one kilowatt-hour kWh),

accounting for the total costs of a technology that accrue over its lifetime. LCOE allows comparing the costs of
different technologies.
22 http://resourceirena.irena.org/gateway/dashboard/?topic=3&subTopic=9
Figure 5: Comparison of cost ranges for electricity production (levelized cost of electricity - LCOE) for different renewable and
non-renewable generation technologies in 2019. While the LCOE cost ranges are based on international cost ranges for already
operating projects, the dots are based on recent auction results (each dot represents the lowest cost in an auction in a
particular country). Sources: Calculations by Climate Analytics based on data from IRENA23 and Lazard24

A key challenge for the LDCs with regards to electricity affordability is that electricity supply can suffer
from high inefficiencies, which affect overall costs. According to WDI, LDCs lost almost 16% of electricity
output due to electric power transmission and distribution losses – about double the world average.25
Reducing these losses would have benefits for both reducing costs and increasing the efficiency of
electricity supply.

23 IRENA (2019): Renewable Power Generation Costs in 2018.
https://www.irena.org/publications/2019/May/Renewable-power-generation-costs-in-
2018?utm_source=All+IRENA+contacts&utm_campaign=46ce6f632c-
EMAIL_CAMPAIGN_2019_05_21_06_13&utm_medium=email&utm_term=0_29b5801035-46ce6f632c-66498829
24 Lazard (2019): Lazard’s levelized cost of energy analysis (version 13.0, Nov. 2019).

https://www.lazard.com/media/451086/lazards-levelized-cost-of-energy-version-130-vf.pdf
25 World Bank World Development Indicators (Series Code EG.ELC.LOSS.ZS)

https://databank.worldbank.org/data/reports.aspx?source=world-development-indicators#
4. Job creation potential in renewable energy deployment
Many LDCs are currently building up new energy system infrastructure on a large scale to meet increasing
energy demands. The choice of which energy sources to invest in can play a crucial role for regional and
local economic development and job perspectives. With energy system infrastructure typically being built
to remain for decades, decisions on newly built infrastructure need to be considered carefully to both
avoid lock-in effects and stranded assets (i.e. investments that are regretted at a later stage), and to make
the most of the economic development opportunities.

Investing in renewable energy can create local employment opportunities26, contributing to achieving
SDG 8 on decent work. Wind turbines and solar panels need to be installed and operated domestically,
thus providing opportunities to foster local job creation. The distributed character of renewable energy –
being spatially spread instead of concentrating on a specific region or major plant site like fossil-based
power plants – could moreover enhance the local job creation potential throughout the country and
especially in rural areas. Moreover, renewable energy technologies are generally considered more labour
intensive compared to conventional power plants such as coal power plants. This means that more
workers are needed and thus more jobs are created when investing in renewable energy technologies
than in conventional power generation technologies. In order to prepare the local workforce for these
tasks, investments in energy infrastructure need to go hand in hand with training of local people to
develop a qualified local workforce in the renewable energy sector.27

26
   IRENA (2019) Towards 100% Renewable Energy. https://coalition.irena.org/-/media/Files/IRENA/Coalition-for-
Action/IRENA_Coalition_100percentRE_2019.pdf
27 IRENA (2019) Towards 100% Renewable Energy. https://coalition.irena.org/-/media/Files/IRENA/Coalition-for-

Action/IRENA_Coalition_100percentRE_2019.pdf
To provide an idea on the order of magnitude, we calculate the employment potential for LDCs for an
illustrative scenario (see Annex 3: Methodological Note in Annex 3 for more details):

           Illustrative Renewable Energy Scenario:

           How many jobs would be created in LDCs if the current total electricity consumption in LDCs
           doubled, and if this increase was covered solely by installing new solar PV and onshore
           wind capacities28?

           We focus on two different types of jobs that have a high potential to contribute to local job
           creation:

     i)     Jobs in construction and installation: Jobs in construction and installation of wind parks
            and solar PV installations accrue over the period where new renewable energy capacities
            are built up. This includes for example trained workers needed to install wind turbines or
            solar PV panels and bring them into service. As this type of work is limited in time to the
            duration of setting up the facilities, related jobs are measured in job years required for the
            construction period29. The construction period for solar PV is assumed for this illustrative
            scenario to be roughly 1 year.

     ii)    Jobs in Operation & Maintenance (O&M): O&M jobs refer to the workers that are needed
            to keep the installed renewable energy capacities running, e.g. by regularly checking their
            functioning and replacing or repairing components if needed. As these tasks are required
            over the full lifetime of the respective installations, these jobs can be considered
            permanent.

Based on employment factors that indicate the number of jobs or job years per Megawatt (MW) installed
wind or solar PV capacity, we calculate the job potential in this scenario for 18 LDCs for which the
necessary data is available in WDI and IRENA (see Annex 3: Methodological Note). To account for local
differences in solar radiation and wind as well as differences in technical efficiency of different facilities,
we show a range for our employment estimates applying an optimistic capacity factor (i.e. less additional
MW renewables capacity needed to generate the required electricity) and a pessimistic capacity factor
(i.e. more MW needed to generate the required electricity) for solar PV and onshore wind, respectively.
The calculation shows that, for our illustrative scenario, the estimated total job potential in O&M for all
18 LDCs considered in this example ranges from over 100,000 created jobs (high capacity factors) to over
250,000 created jobs (low capacity factors) for solar and wind together over the lifetime of the installed
renewable energy facilities. For construction and installation, the total job potential for these LDCs
together could range from 1.8 million job years (high capacity factors) to 4.3 million job years (low capacity
factor). Assuming that the added renewable energy capacities are built up over a period of 5 years, this

28 For this exemplary scenario, we assumed solar and wind each supply half of the
                                                                                increase in electricity needs.
29Jobs in Construction and Installation do not include jobs in manufacturing the technologies parts beforehand.
These are additional jobs not considered here as manufacturing may not happen locally.
would amount to a range of about 365,000 jobs to 870,000 jobs in construction and installation each year in total over these 5 years. Figure 6 shows the range of the estimated job potential for O&M over the entire lifetime of the facilities for selected LDCs for optimistic and pessimistic capacity factors assumptions. Bangladesh has the highest job potential. We estimate the O&M jobs that could be newly created over the whole lifetime of the facilities in our illustrative scenario to range from close to 24,000 jobs to over 55,000 created jobs in Bangladesh (see Figure 6). Also, Mozambique could potentially create between over 14,000 and close to 33,000 O&M jobs in our scenario. Zambia could create between about 12,500 and almost 29,000 O&M jobs, while Angola and Côte d’Ivoire could create between over 9,000 and over 20,000 O&M jobs for the lifetime of installed solar and wind installations. Figure 6: Job potential for illustrative scenario: jobs in O&M (solar and wind combined). Scenario: Doubling of current electricity demand fully covered by new onshore wind and solar PV capacities. Country names to the ISO codes can be found in Table 2. For jobs in construction and installation of renewable energy, Figure 7 shows the range of the estimated job potential (in job years) for selected LDCs for optimistic and pessimistic capacity factor assumptions. For Bangladesh, we estimate the number of jobs years that could be newly created in our illustrative scenario to range from close to 400,00 to almost 950,000 job years. Assuming that facilities are built up over a period of 5 years this would mean a range of close to 80,000 to almost 190,000 jobs per year for this time period. For Mozambique, the job potential for construction and installation could range between
close to 240,000 and over 566,000 job years in our scenario, i.e. about between about 47,500 and over
113,000 jobs for 5 years.

Figure 7: Job potential for illustrative scenario: Job years in Construction and Installation jobs (solar and wind combined).
Scenario: Doubling of current electricity demand fully covered by new onshore wind and solar PV capacities. Country names
to the ISO codes can be found in Table 2.

Our estimates are conservative given that we do not include indirect jobs created in related industries
further down the supply chain. Literature indicates that these additional indirect jobs would amount to
about the same order of magnitude as direct jobs. 30

30Ortega, M., Río, P. del, Ruiz, P., & Thiel, C. (2015). Employment effects of renewable electricity deployment. A
novel methodology. Energy, 91, 940–951.
5. Reduction of health impacts from air pollution
The WHO has designated air pollution as a “silent killer” – many are unaware of the widespread impacts
that exposure to air pollution has on human health31. Health-damaging air pollution is mainly caused by
use of biomass stoves for cooking, emissions from fossil fuel power plants and road transport. Decreasing
the reliance on biomass and improving access to clean electricity, which can also be used for electric
transport, can strongly lower this pollution and the related health damages. For LDCs, both indoor and
outdoor air pollution have considerable impacts on human health and the environment. Climate change
mitigation has the potential to generate numerous co-benefits also with regards to air pollution such as
reduced morbidity, mortality (SDG 3 - health) and the negative impacts on agriculture (SDG 2 on food
security), which could offset the costs of climate policy.32

5.1 Indoor air pollution - reducing health impacts from cooking and lighting
High levels of indoor air pollution occur when biomass fuels (such as wood, charcoal, animal dung and
agricultural residues) and coal are used for energy needs such as cooking, lighting and heating. Open fires
and traditional stoves result in indoor smoke containing health-damaging pollutants such as small
particles, carbon monoxide and particulate matter pollution, over-proportionately affecting children and
women. In 2016, an average of 74 deaths per 100,000 inhabitants were attributed to indoor air pollution
across all LDCs, compared to a world average of 51 deaths per 100,000 people (Figure 8). In absolute
terms, this resulted in over 685,000 deaths due to indoor air pollution across all LDCs. On average, 86% of
the population in LDCs does not have access to clean technologies or fuels for cooking (2016, see also
Figure 3, right side).

Installation of improved cook stoves can reduce the use of fossil fuel and biomass by almost 30-40% in
rural households and lessen the indoor air pollution to a greater extent thus providing positive health
impacts, as shown in a study evaluating a project installing 500,000 Bondhu Chula across Bangladesh.33

31Schraufnagel, D. E., Balmes, J. R., Cowl, C. T., De Matteis, S., Jung, S.-H., Mortimer, K., et al. (2019).
                                                                                                        Air Pollution
      and Noncommunicable Diseases: A Review by the Forum of International Respiratory Societies’
      Environmental Committee, Part 1: The Damaging Effects of Air Pollution. Chest, 155(2), 409–416.
      https://doi.org/10.1016/j.chest.2018.10.042
32 Vandyck, T., Keramidas, K., Kitous, A., Spadaro, J. V., Van Dingenen, R., Holland, M., Saveyn, B., 2018. Air quality

co-benefits for human health and agriculture counterbalance costs to meet Paris Agreement pledges. Nat. Commun.
9, 1–11. https://doi.org/10.1038/s41467-018-06885-9
33 Bangladesh Institute of Development Studies (BIDS): Impacts of improved cooking stoves: Evidence relating to

Bindhu Chula. http://bids.org.bd/uploads/events/almanac2018/TS-5_P-1.pdf
Figure 8: Crude death rate attributed to indoor air pollution in LDCs, in number of deaths per 100,000 inhabitants. Source: Data from SDG Database (based on WHO estimates). Country names to the ISO codes can be found in Table 2. Energy efficiency and renewable energy can significantly reduce indoor air pollution and its negative health impacts. For example, improved low-emission/high-efficiency stoves are considered to be the most affordable short-term intervention, despite barriers to improved stove adoption and performance variability. There is also experimental evidence that household electrification leads to substantial improvements in indoor air quality.34 Electric stoves have significantly lower levels of pollutants than biomass stoves.35 Households in remote areas too isolated for grid electrification could benefit from other decentralized clean lighting technologies such as solar lamps, which can substantially reduce indoor air pollution.28 5.2 Outdoor air pollution – reducing health impacts from fossil fuel combustion for power generation and transport Globally, outdoor air pollution stemming from the power sectors is a major issue, in particular in regions that have heavily relied on coal. Coal combustion results in a range of pollutants which are accumulated in air and water, leading to a wide range of environmental and health impacts.36 In addition, the transport sector is also responsible for large portions of urban air pollution, aggravating air pollution exposure. The burden of outdoor air pollution is high for LDCs, where strong population growth along with rapid widespread urbanization and industrialization have led to dense urban centers with poor air quality. The use of old and inefficient diesel vehicles and the lack of public transport heavily contribute to this burden. 34 Barron, M., Torero, M., 2017. Household electrification and indoor air pollution. J. Environ. Econ. Manage. 86, 81– 92. https://doi.org/10.1016/j.jeem.2017.07.007 35 Downward, G.S., van der Zwaag, H.P., Simons, L., Meliefste, K., Tefera, Y., Carreon, J.R., Vermeulen, R., Smit, L.A.M., 2018. Occupational exposure to indoor air pollution among bakery workers in Ethiopia; A comparison of electric and biomass cookstoves. Environ. Pollut. 233, 690–697. https://doi.org/10.1016/j.envpol.2017.10.094 36 Munawer, M.E., 2018. Human health and environmental impacts of coal combustion and post-combustion wastes. J. Sustain. Min. 17, 87–96. https://doi.org/10.1016/J.JSM.2017.12.007
Data from the WDI also shows that 100% of the population in LDCs is exposed to fine particulate matter
(PM2.5) concentration levels exceeding WHO guidelines. In 2016, an average of 40 deaths per 100,000
inhabitants were attributed to outdoor air pollution across all LDCs. In absolute terms, over 410,000
deaths are attributed to outdoor air pollution across all LDCs (WDI 2018).

In the context of LDCs, there is great potential for leapfrogging to (decentralized) renewable energy
systems, paving the way forward for sustainable development while reducing air pollution. Cost
reductions of renewable energy present opportunities for the electrification of rural areas, including
through off-grid and mini-grid solutions. The development of efficient, low carbon public transport
networks and electrified transport options in sprawling urban centers is also required to reduce the
exposure to outdoor air pollution. In fact, the electrification of the transport system can be coupled with
the integration of renewables into the power grid, with electric vehicles providing flexibility to the power
system by acting as a form of energy storage (IRENA, 201937).

37IRENA (2019), Innovation landscape brief: Electric-vehicle smart charging, International Renewable Energy
Agency, Abu Dhabi. https://www.irena.org/-
/media/Files/IRENA/Agency/Publication/2019/Sep/IRENA_EV_smart_charging_2019.pdf?la=en&hash=E77FAB742
2226D29931E8469698C709EFC13EDB2
Annexes
Annex 1: What would be the potential in my country to exploit synergies?
Clicking on the country name, you find more information on the country specific potential for co-benefits
of a low carbon development.

Table 2: Links to country-specific information

 ISO        Country name                    Link to country information
 AFG        Afghanistan                     http://cobenefits.climateanalytics.org/output/AFG.html
 AGO        Angola                          http://cobenefits.climateanalytics.org/output/AGO.html
 BDI        Burundi                         http://cobenefits.climateanalytics.org/output/BDI.html
 BEN        Benin                           http://cobenefits.climateanalytics.org/output/BEN.html
 BFA        Burkina Faso                    http://cobenefits.climateanalytics.org/output/BFA.html
 BGD        Bangladesh                      http://cobenefits.climateanalytics.org/output/BGD.html
 BTN        Bhutan                          http://cobenefits.climateanalytics.org/output/BTN.html
 CAF        Central African Republic        http://cobenefits.climateanalytics.org/output/CAF.html
 COD        Congo, Democratic Republic http://cobenefits.climateanalytics.org/output/COD.html
            of the
 COM        Comoros                         http://cobenefits.climateanalytics.org/output/COM.html
 DJI        Djibouti                        http://cobenefits.climateanalytics.org/output/DJI.html
 ERI        Eritrea                         http://cobenefits.climateanalytics.org/output/ERI.html
 ETH        Ethiopia                        http://cobenefits.climateanalytics.org/output/ETH.html
 GIN        Guinea                          http://cobenefits.climateanalytics.org/output/GIN.html
 GMB        Gambia                          http://cobenefits.climateanalytics.org/output/GMB.html
 GNB        Guinea-Bissau                   http://cobenefits.climateanalytics.org/output/GNB.html
 HTI        Haiti                           http://cobenefits.climateanalytics.org/output/HTI.html
 KHM        Cambodia                        http://cobenefits.climateanalytics.org/output/KHM.html
 KIR        Kiribati                        http://cobenefits.climateanalytics.org/output/KIR.html
 LAO        Lao People's      Democratic http://cobenefits.climateanalytics.org/output/LAO.html
            Republic
 LBR        Liberia                         http://cobenefits.climateanalytics.org/output/LBR.html
 LSO        Lesotho                         http://cobenefits.climateanalytics.org/output/LSO.html
 MDG        Madagascar                      http://cobenefits.climateanalytics.org/output/MDG.html
 MLI        Mali                            http://cobenefits.climateanalytics.org/output/MLI.html
 MMR        Myanmar                         http://cobenefits.climateanalytics.org/output/MMR.html
MOZ Mozambique http://cobenefits.climateanalytics.org/output/MOZ.html MRT Mauritania http://cobenefits.climateanalytics.org/output/MRT.html MWI Malawi http://cobenefits.climateanalytics.org/output/MWI.html NER Niger http://cobenefits.climateanalytics.org/output/NER.html NPL Nepal http://cobenefits.climateanalytics.org/output/NPL.html RWA Rwanda http://cobenefits.climateanalytics.org/output/RWA.html SDN Sudan http://cobenefits.climateanalytics.org/output/SDN.html SEN Senegal http://cobenefits.climateanalytics.org/output/SEN.html SLB Solomon Islands http://cobenefits.climateanalytics.org/output/SLB.html SLE Sierra Leone http://cobenefits.climateanalytics.org/output/SLE.html SOM Somalia http://cobenefits.climateanalytics.org/output/SOM.html SSD South Sudan http://cobenefits.climateanalytics.org/output/SSD.html STP Sao Tome and Principe http://cobenefits.climateanalytics.org/output/STP.html TCD Chad http://cobenefits.climateanalytics.org/output/TCD.html TGO Togo http://cobenefits.climateanalytics.org/output/TGO.html TLS Timor-Leste http://cobenefits.climateanalytics.org/output/TLS.html TUV Tuvalu http://cobenefits.climateanalytics.org/output/TUV.html TZA Tanzania, United Republic of http://cobenefits.climateanalytics.org/output/TZA.html UGA Uganda http://cobenefits.climateanalytics.org/output/UGA.html VUT Vanuatu http://cobenefits.climateanalytics.org/output/VUT.html YEM Yemen http://cobenefits.climateanalytics.org/output/YEM.html ZMB Zambia http://cobenefits.climateanalytics.org/output/ZMB.html
Vous pouvez aussi lire