DECARBONISING THE STEAM SUPPLY OF THE DUTCH PAPER AND BOARD INDUSTRY - Rijksoverheid
←
→
Transcription du contenu de la page
Si votre navigateur ne rend pas la page correctement, lisez s'il vous plaît le contenu de la page ci-dessous
DECARBONISING THE STEAM SUPPLY OF
           THE DUTCH PAPER AND BOARD INDUSTRY

8/1/2018   Raising steam for paper and board industry without emitting carbon dioxide

           The Dutch paper and board industry is an energy-intensive sector that is actively searching for possibilities to reduce
           greenhouse gas emissions and to become more sustainable. In the production processes, large amounts of steam are
           used for drying. In the long term, the paper and board industry may be able to implement breakthrough technologies
           that do not require any steam. This report focuses on the medium term (up to 2030) and aims to give an overview of
           options for decarbonisation of the steam supply.
DECARBONISING THE STEAM SUPPLY OF THE DUTCH PAPER AND BOARD INDUSTRY

ACKNOWLEDGEMENTS
This report was commissioned by the Ministry of Economic Affairs and Climate and jointly carried
out by ECN part of TNO and Lux Research. The report is a part of MIDDEN pilot and the collected
data on the paper and board industry contributes to the data system of the MIDDEN knowledge
network. Data has been corrected, and if needed aggregated and rounded off to prevent
confidentiality issues.
This report is summary of the results of both parties their research. Note however that ECN part of
TNO and Lux Research are each only responsible for the content of their own respective work, as
presented in their individual reports.

At ECN part of TNO, the project is registered under project number 060.34013 For more
information, please contact Wouter Wetzels (wouter.wetzels@tno.nl, +31 (0)88 866 28 06). Lux
Research lead analyst Arij van Berkel can be contacted for further information +31 20 808 7540 for
the Lux contributions.

The VNP would like to thank Wouter Wetzels (ECN part of TNO), Marc Marsidi (ECN part of TNO),
Arij van Berkel (Lux Research), Jessica Hernandez (Lux Research), Bart Manders (RVO), Job
Rosenhart (RVO), Willem Teerink (EZK), Laurens de Vries (KCPK), Sigrid Bollwerk (ECN part of
TNO), Ton van Dril (ECN part of TNO), Anton Wemmers (ECN part of TNO) and the members of
the Royal Association of Dutch Paper and Paperboard (VNP) for their cooperation, comments and
suggestions.

                                                                                                         PAGINA 1
DECARBONISING THE STEAM SUPPLY OF THE DUTCH PAPER AND BOARD INDUSTRY

SAMENVATTING
De Nederlandse papier- en kartonindustrie is een energie-intensieve sector die actief op zoek is
naar mogelijkheden om de uitstoot van broeikasgassen te verminderen en te verduurzamen. In de
productieprocessen worden grote hoeveelheden stoom gebruikt om te drogen. Op lange termijn
kan de papier- en kartonindustrie mogelijk doorbraaktechnologieën toepassen waar geen stoom
voor nodig is. Dit rapport richt zich op de middellange termijn (tot 2030) en heeft als doel een
overzicht te geven van mogelijkheden voor decarbonisatie van de stoomvoorziening.

De structuur van dit rapport
Dit rapport bestaat uit twee delen. Het eerste deel geeft een overzicht van gegevens over de
papier- en kartonindustrie in Nederland in 2015. Dit deel bespreekt productieprocessen,
materiaalverbruik, energieverbruik, energieproductie, broeikasgasemissies en productiekosten.
Om dit overzicht te maken hebben de VNP, het KCPK en ECN part of TNO een dataset
samengesteld met gedetailleerde gegevens over de Nederlandse papier- en kartonfabrieken.

Het tweede deel van het rapport bespreekt alternatieve technologieën voor de stoomvoorziening.
Lux Research heeft een inventarisatie gemaakt van technologische opties die een één-op-één
vervanging kunnen zijn van aardgasgestookte stoomketels die stoom produceren tot 200 ⁰C. De
resultaten van Lux Research geven inzicht in de kosten en efficiëntie van deze technologieën en
lichten toe waar deze technologieën ontwikkeld worden.

De mogelijke rol van deze alternatieve technologieën wordt besproken op basis van verwachte
ontwikkelingen in het energiesysteem als geheel, zoals de ontwikkeling van energieprijzen, de
elektriciteitsopwekking en de energie-infrastructuur.

De papier- en kartonindustrie in Nederland
In 2015 bestond ongeveer 68% van de productie van de Nederlandse papier- en kartonindustrie
uit verpakkingsmateriaal (golfkarton, massief karton, vouwkarton), 28% uit grafisch papier (op basis
van primaire vezels en gerecyclede vezels), en 4% uit sanitair papier.

Er waren 21 fabrieken met een totale productiecapaciteit van ongeveer 2.900 kton per jaar. De
fabrieken realiseerden een gemiddelde bezettingsgraad van 92%. De jaarlijkse productie van de
individuele fabrieken varieerde van 5.000 tot 600.000 ton per jaar. Grote fabrieken produceren
meestal bulkproducten, terwijl kleinere fabrieken meestal meer gespecialiseerde producten
maken. Op één na waren alle fabrieken onderdeel van een grotere ondernemingsgroep.

Papier en kartonproductie bestaat uit de productie en voorbereiding van de vezels, de vorming
van papier en droging. Het thermisch drogen van het papier is verantwoordelijk voor het grootste
deel van het stoomverbruik.

PAGINA 2
DECARBONISING THE STEAM SUPPLY OF THE DUTCH PAPER AND BOARD INDUSTRY

Dit rapport presenteert gegevens over energie en emissies in 2015:

   •   Tien fabrieken maakten gebruik van warmtekrachtkoppeling (WKK) om te voorzien in (een
       deel van) hun stoomvraag. Het totaal elektrisch vermogen van deze installaties was 217
       MWe en het totaal thermisch vermogen 496 MWth. De totale brandstofinzet was 14,7 PJ.
   •   Het finaal verbruik van elektriciteit in de Nederlandse papier- en kartonindustrie was 4,6 PJ.
       De totale elektriciteitsopwekking met WKK-installaties was 4,1 PJ.
   •   Het totale verbruik van stoom/warmte was 12,5 PJ, waarvan 62% (7,8 PJ) geproduceerd
       werd met WKK-installaties.
   •   De totale ETS emissies van de papier- en kartonfabrieken in Nederland waren in 2015 1.054
       kton CO2-eq.

Alternatieve technologieën voor stoomproductie
Lux Research heeft enkele van de meest veelbelovende technologie-opties geselecteerd die een
één-op-één vervanging kunnen zijn voor aardgasgestookte stoomketels die stoom produceren
met een temperatuur tot 200 ⁰C. Voor de geselecteerde technologieën heeft Lux Research data
verzameld en inschattingen gemaakt van waarschijnlijke toekomstige eigenschappen.

De volgende technologieën zijn onderzocht:

   •   Terugwinning van restwarmte met een warmtepomp: Warmte uit de omgeving of een
       reservoir wordt met behulp van elektriciteit in temperatuur verhoogd.
   •   Directe elektrische verwarming: Met directe elektrische verwarming kan stoom worden
       geproduceerd. Dit verschilt niet veel van een elektrische ketel, maar dan op een grotere
       schaal en bij hogere temperatuur en druk.
   •   Verbranding van waterstof: De industrie kan waterstof inkopen en verbranden in plaats van
       aardgas.
   •   Elektrolyse: In plaats van de inkoop van waterstof kunnen bedrijven ter plekke waterstof
       maken met elektrolyse. De waterstof kan dan worden verbrand om de gewenste
       temperatuur te bereiken.
   •   WKK-systeem op basis van vergassing van biomassa: Biomassa wordt vergast en het gas
       wordt gebruikt als brandstof voor een warmtekrachtkoppelingseenheid.

Andere opties (zoals geothermie, restwarmte van nabije industrie en biogas) kunnen ook een
belangrijke rol spelen in de decarbonisatie van de stoomvoorziening. Lux Research heeft de
overwegingen ten aanzien van de selectie van de technologieën toegelicht. Geothermie is niet
geselecteerd omdat het alleen toepasbaar is voor industrie op een geschikte locatie. De
mogelijkheid om restwarmte van nabije industrie te gebruiken hangt af van de aanwezigheid van
aanbieders van restwarmte. Biogas wordt als een algemeen haalbare optie gezien, maar de
toegevoegde waarde van het selecteren van biogas is als beperkt gezien omdat er al veel studies
over het gebruik van biogas beschikbaar zijn.

                                                                                                          PAGINA 3
DECARBONISING THE STEAM SUPPLY OF THE DUTCH PAPER AND BOARD INDUSTRY

Discussie
Het doel dat is gesteld voor het Nederlandse Klimaatakkoord is om in 2030 een reductie van de
nationale broeikasgasemissies te bereiken van 49% (ten opzichte van 1990). De huidige Europese
ambitie is om in 2050 een reductie van 80 tot 95% te bereiken. Dergelijke reductiedoelstellingen
kunnen alleen worden bereikt door grote veranderingen in het Nederlandse energiesysteem.

De rol van elektrificatie
In dit rapport zijn drie technologieën onderzocht die kunnen bijdragen aan elektrificatie van de
stoomvoorziening van de industrie: warmtepompsystemen, directe elektrische verwarming en
elektrolyse.

Elektrificatie door middel van elektrische warmtepompen kan leiden tot significante energie-
efficiëntieverbeteringen vergeleken met aardgasketels. Onderzoek- en ontwikkelingsinspanningen
zijn er op gericht om de kapitaalkosten te verlagen en de uitgangstemperaturen te verhogen.

Elektrificatie door middel van weerstandsverwarming of elektrolyse leidt niet tot substantiële
energie-efficiëntieverbeteringen, maar kan toch resulteren in emissiereductie in combinatie met
CO2-vrije elektriciteitsopwekking.

De eerste fase van elektrificatie kan plaatsvinden met hybride systemen. Dergelijke systemen
kunnen gebruik maken van zonne- en windenergie die anders verloren zou gaan door curtailment.

De rol van waterstof
Vergeleken met elektriciteit heeft waterstof enkele voor- en nadelen. Het is gemakkelijker om
waterstof op te slaan en met hoge dichtheid te transporteren. De productie van waterstof uit
elektriciteit kan helpen om overschotten van zonne- en windenergie te benutten.

Een nadeel is dat het energieverbruik toeneemt omdat de ketenefficiëntie doorgaans lager is. Het
gebruik van waterstof maakt meestal aanzienlijke aanpassingen bij energieverbruikers en
veranderingen aan de infrastructuur noodzakelijk.

De technologie om waterstof te gebruiken en te produceren is al beschikbaar (bijvoorbeeld
elektrolyse en waterstofbranders), maar deze technologieën zijn vaak nog niet concurrerend met
de bestaande (fossiele) alternatieven.

De rol van biomassa
Biomassa heeft veel toepassingen in de energieproductie- en energieverbruikssectoren. Het kan
worden gebruikt voor de productie van warmte, waterstof, elektriciteit, biobrandstoffen en voor
specifieke industriële processen.

PAGINA 4
DECARBONISING THE STEAM SUPPLY OF THE DUTCH PAPER AND BOARD INDUSTRY

Vanuit een lange-termijn perspectief kan het gebruik van biomassa in de industrie logisch zijn, in
het bijzonder omdat biomassa in combinatie met CCS kan leiden tot negatieve emissies. CCS is
echter alleen toepasbaar bij voldoende schaalgrootte, zoals bij grote industriële puntbronnen of
industriële agglomeraties.

Het gebruik van biomassa in de industrie in plaats van fossiele brandstoffen maakt het mogelijk om
de CO2-uitstoot te verminderen. Het is echter wel van groot belang om de duurzaamheid van de
biomassa te garanderen en de hoeveelheid broeikasgassen die vrijkomt in de keten te beperken.

De rol van geothermie
De industrie heeft maar beperkte ervaring met geothermie. In de diepe ondergrond is een grote
hoeveelheid warmte beschikbaar. De mate waarin deze warmte kan worden toegepast in de
industrie hangt af van de locatie en mogelijke neveneffecten. Geothermie speelt vaak een rol in
kosten-optimale oplossingen voor diepe decarbonisatie van de industrie.

De rol van restwarmte
Industriële locaties kunnen restwarmte van andere industrie benutten als de restwarmteleverancier
dichtbij genoeg is en warmtedistributie-infrastructuur aanwezig is. In clusters van industriële
activiteit is het vaak mogelijk om aanbod en vraag van restwarmte bij elkaar te brengen. De
industrie kan ook restwarmte leveren aan andere sectoren.

Algemene conclusie
Dit rapport bespreekt veelbelovende opties voor één-op-één vervanging van aardgasgestookte
stoomketels in de industrie. Het biedt geen compleet overzicht van decarbonisatie van de
stoomvoorziening.

Het succes van dergelijke technologieën is afhankelijk van toekomstige ontwikkelingen in het
energiesysteem en energiebeleid, die vaak onzeker zijn. Er kunnen aanpassingen nodig zijn aan de
energie opwekking, distributie en infrastructuur. Het zal niet zo zijn dat er één technologische
oplossing is die in alle gevallen kan worden toegepast.

De klimaatuitdaging voor de energie-intensieve industrie is groot. Om de uitdaging succesvol aan
te gaan is het essentieel om beter inzicht te krijgen in de huidige productiemethodes en de
mogelijke verduurzamingsopties voor de Nederlandse industrie. Om hierover meer duidelijkheid
te scheppen is samenwerking met de industrie essentieel.

                                                                                                          PAGINA 5
DECARBONISING THE STEAM SUPPLY OF THE DUTCH PAPER AND BOARD INDUSTRY PAGINA 6
DECARBONISING THE STEAM SUPPLY OF THE DUTCH PAPER AND BOARD INDUSTRY
SUMMARY
The Dutch paper and board industry is an energy-intensive sector that is actively searching for
possibilities to reduce greenhouse gas emissions and to become more sustainable. In the
production processes, large amounts of steam are used for drying. In the long term, the paper and
board industry may be able to implement breakthrough technologies that do not require any
steam. This report focuses on the medium term (up to 2030) and aims to give an overview of
options for decarbonisation of the steam supply.
The structure of this report
This report consists of two parts. The first part gives an overview of data on the paper and board
industry of the Netherlands in 2015. This part discusses production processes, material
consumption, energy consumption, energy production, greenhouse gas emissions and production
costs. To obtain this overview, the VNP, the KCPK and ECN part of TNO have compiled a dataset
with detailed information on the Dutch paper and board mills.
The second part of the report discusses alternative technologies for the steam supply. Lux
Research has made an inventory of technology options for a drop-in replacement for natural-gas
fired steam boilers that produce steam of up to 200 ⁰C. The results of Lux Research give insights
into the costs and efficiencies of these technologies and explain where these technologies are
being developed.
The possible role of these alternative technologies is discussed, based on expected developments
in the energy system as a whole, such as the developments of energy prices, electricity generation
and energy infrastructure.
The paper and board industry in the Netherlands
In 2015, about 68% of the Dutch paper and board production consisted of packaging paper
(corrugated board, solid board and folding boxboard), 28% of graphic paper (based on virgin and
recovered fibre), and 4% of sanitary paper.
There were 21 mills with a combined production capacity of approx. 2,900 kton per year. The mills
realised an average capacity utilization of 92%. The annual production capacity of the individual
mills ranged from 5,000 to 600,000 tons per year. Large mills typically produce bulk products,
whereas smaller mills tend to produce more specialized products. Except for one, all of the paper
mills are part of a larger corporate group.
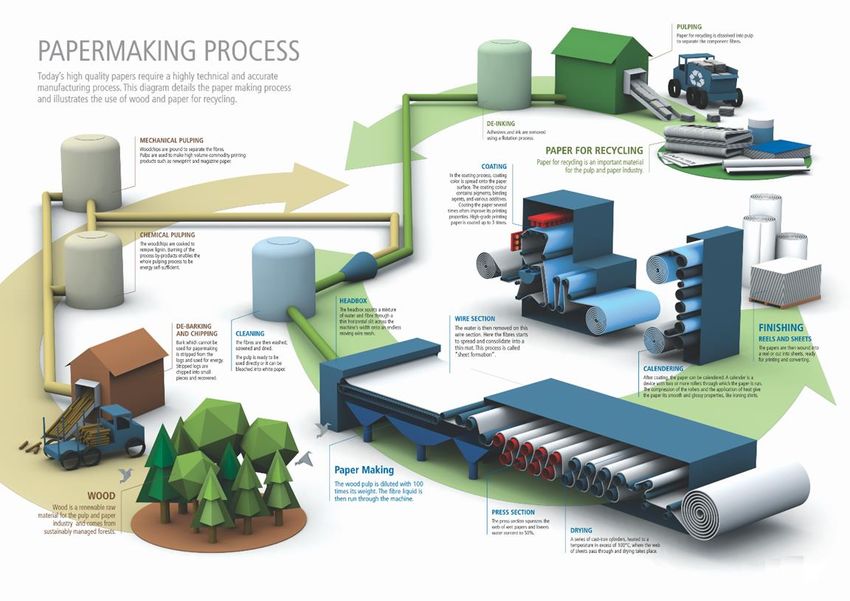
Paper and board production consists of the production and preparation of the fibres, formation of
the paper, and drying. The thermal drying of the paper accounts for most of the steam use.
This report presents figures on energy and emissions in 2015:
PAGINA 7DECARBONISING THE STEAM SUPPLY OF THE DUTCH PAPER AND BOARD INDUSTRY
• Ten paper mills used combined heat and power (CHP) installations to cover (part of)
their steam demand. The total electrical capacity of these installations was 217 MWe
and the total thermal capacity was 496 MWth. The total fuel input was 14.7 PJ.
• The final electricity consumption in the Dutch paper and board industry was 4.6 PJ. The
total electricity generation by CHP installations was 4.1 PJ.
• The total consumption of steam/heat was 12,5 PJ of which 62% (7.8 PJ) was produced by
CHP installations.
• The total ETS emissions of the paper and board plants in the Netherlands in 2015
amounted to 1,054 kton CO2-eq.
Alternative technologies for steam production
Lux Research has selected some of the most promising technology options for a drop-in
replacement for natural-gas fired steam boilers that produce steam of up to 200 ⁰C. For the
selected technologies, Lux Research has collected data and made estimations regarding their
likely future performance.
The following technologies have been studied:
• Heat pump recovering waste heat: Heat from the environment or a reservoir is raised to
a higher temperature level using electricity.
• Direct electric heating: Steam can be raised using direct electric heating. This is not
much different from an electric kettle, just operating on a much larger scale and at
higher temperatures and pressures.
• Hydrogen combustion: The industry could buy hydrogen and burn that instead of
natural gas.
• Electrolysis: Rather than buying hydrogen, companies could generate hydrogen on-site
using electrolysis and then burn the hydrogen to generate the desired temperature.
• Biomass gasification based CHP system: Biomass is gasified and the gas is used to run a
CHP unit.
Other options (such as geothermal energy, waste heat from nearby industry and biogas) can play
an important role in decarbonisation of the steam supply as well. Lux Research has explained the
considerations for the technology selection. Geothermal energy has not been selected as it is only
applicable to industry that is located in a suitable place. The possibility to use waste heat from
nearby industry depends on the availability of suppliers of waste heat. Biogas is considered to be a
viable option, but the added value of selecting biogas was considered to be limited, as there are
already many studies on using biogas.
Discussion
The goal that has been set for the Dutch Climate Agreement is to reach a reduction of the national
emission of greenhouse gases by 49% in 2030 (compared to 1990). The current European ambition
PAGINA 8DECARBONISING THE STEAM SUPPLY OF THE DUTCH PAPER AND BOARD INDUSTRY
is to reach a reduction of 80 to 95% in 2050. Such reduction targets can only be reached through
major changes in the energy system of the Netherlands.
The role of electrification
This report has looked into three technologies than can contribute to electrification of the steam
supply of the industry: heat pump systems, direct electric heating and electrolysis.
Electrification using electrical heat pumps can give rise to significant energy efficiency
improvements compared to natural gas boilers. Research and development efforts are ongoing to
reduce the capital expenditures and to increase the output temperatures.
Electrification using resistors or electrolysis does not lead to substantial energy efficiency
improvements, but can still result in emission reduction when combined with CO2-free electricity
generation.
The first phase of electrification may take place using hybrid systems. Such systems can use the
solar and wind energy that would otherwise be lost through curtailment.
The role of hydrogen
Compared to electricity, hydrogen has some advantages and some disadvantages. It is easier to
store hydrogen and to transport it with high energy density. Production of hydrogen from
electricity can help to make use of surpluses of solar and wind energy.
A disadvantage is that the energy consumption increases because the chain efficiencies are
typically lower. The use of hydrogen usually requires considerable measures on the side of the
energy consumers and changes to infrastructure.
The technology to use and produce hydrogen is already available (e.g. electrolysis, hydrogen
burners), but these technologies are often not yet competitive with the current (fossil) alternatives.
The role of biomass
Biomass has many applications in the energy production and in the energy demand sectors. It can
be used for the production of heat, hydrogen, electricity, biofuels and for specific industrial
processes.
From a long-term perspective, the large scale use of biomass in the industry can be logical,
especially because biomass in combination with CCS can result in negative emissions. However,
CCS can only be applied when the scale is sufficiently large, such as at large industrial point
sources or industrial agglomerations.
The use of biomass in the industry instead of fossil fuels offers the possibility to reduce CO2-
emissions. It is however very important to guarantee the sustainability of the biomass and to limit
the greenhouse gas emissions in the supply chain.
PAGINA 9DECARBONISING THE STEAM SUPPLY OF THE DUTCH PAPER AND BOARD INDUSTRY The role of geothermal energy The industry has only limited experience with geothermal energy. A large amount of heat is available in the deep underground. The extent to which this heat can be used in the industry depends on the location and possible side effects. Geothermal energy often plays a role in cost- optimal solutions for deep decarbonisation of the industry. The role of waste heat Industrial locations can use waste heat from other industry when the waste heat supplier is nearby enough and heat distribution infrastructure is available. In clusters of industrial activity it is often possible to match supply and demand of waste heat. The industry can also deliver waste heat to other sectors. General conclusion This report discusses promising drop-in replacements for natural-gas fired steam boilers in the industry. It does not provide a complete overview of technological options for decarbonisation of the steam supply. The success of such technologies is dependent on future developments in the energy system and energy policies, which are often uncertain. Changes may be required to energy generation, distribution and infrastructure. There will not be one technological solution that can be applied in all cases. The climate challenge for the energy-intensive industry is large. In order to meet the climate challenge, a better overview of the current production methods and possible sustainable improvement options for the Dutch industry is vital. To bring more clarity to these issues, cooperation with the industry is essential. PAGINA 10
DECARBONISING THE STEAM SUPPLY OF THE DUTCH PAPER AND BOARD INDUSTRY

CONTENTS

                                                                       PAGINA 11
DECARBONISING THE STEAM SUPPLY OF THE DUTCH PAPER AND BOARD INDUSTRY CONTENTS ACKNOWLEDGEMENTS .................................................................................................................1 SAMENVATTING .............................................................................................................................. 2 De papier- en kartonindustrie in Nederland ................................................................. 2 Alternatieve technologieën voor stoomproductie ....................................................... 3 Discussie .......................................................................................................................... 4 Algemene conclusie........................................................................................................ 5 SUMMARY ........................................................................................................................................7 The paper and board industry in the Netherlands ....................................................... 7 Alternative technologies for steam production ............................................................ 8 Discussion ........................................................................................................................ 8 General conclusion ....................................................................................................... 10 CONTENTS .................................................................................................................................... 11 INTRODUCTION ............................................................................................................................ 13 THE PAPER AND BOARD INDUSTRY IN THE NETHERLANDS ..................................................... 14 Methodology for data collection ................................................................................. 14 Production processes, energy consumption and material use ................................. 17 Energy consumption, energy production and CO2 emissions .................................. 22 Investments, market prices and O&M costs ............................................................... 27 ALTERNATIVE TECHNOLOGIES FOR STEAM PRODUCTION ...................................................... 31 Heat pumps ................................................................................................................... 34 Biomass gasification ...................................................................................................... 39 Hydrogen combustion .................................................................................................. 41 Electrolysis ..................................................................................................................... 42 Direct electric heating................................................................................................... 44 Overview of selected technologies ............................................................................. 45 Development of energy and CO2 prices ..................................................................... 48 Results per technology ................................................................................................. 51 DISCUSSION .................................................................................................................................. 55 The role of electrification .............................................................................................. 55 The role of hydrogen .................................................................................................... 56 The role of biomass....................................................................................................... 56 The role of geothermal energy .................................................................................... 57 GENERAL CONCLUSION............................................................................................................... 58 REFERENCES.................................................................................................................................. 59 ANNEX 1 LUX METHODOLOGY .................................................................................................... 60 ANNEX 2 THE SENSITIVITY OF THE SCALING RULES .................................................................. 66 PAGINA 12
DECARBONISING THE STEAM SUPPLY OF THE DUTCH PAPER AND BOARD INDUSTRY

INTRODUCTION
The Dutch paper and board industry is an energy-intensive sector that is actively searching for
possibilities to reduce greenhouse gas emissions and to become more sustainable. In the
production processes, large amounts of steam are used for drying. In the long term, the paper and
board industry may be able to implement breakthrough technologies that do not require any
steam. This report focuses on the medium term (up to 2030) and aims to give an overview of
options for decarbonisation of the steam supply.

The energy transition requires completely new approaches. The industry is willing to invest in new
methods of production, but is hindered by a lack of insight into developments in the energy
system as a whole. There is also uncertainty about characteristics of technologies that are in an
early stage of development. These uncertainties make it difficult to determine which technological
options are the most attractive and how the limited financial resources for development can best
be spent.

This report consists of two parts. The first part gives an overview of information on the paper and
board industry of the Netherlands in 2015, which discusses production processes, material
consumption, energy consumption, energy production, greenhouse gas emissions and production
costs. To obtain this overview, the VNP, the KCPK and ECN part of TNO have compiled a dataset
with detailed information on the Dutch paper and board mills.

The second part of the report discusses alternative technologies for the steam supply. Currently,
boilers and combined heat and power (CHP) installations are generally used to produce steam. Lux
Research has made an inventory of alternatives that may contribute to decarbonisation in the
medium term. The results of Lux Research give insights into the costs and efficiencies of these
technologies and explain where these technologies are being developed.

The possible role of these alternative technologies is discussed, based on expected developments
in the energy system as a whole, such as the developments of energy prices, electricity generation
and energy infrastructure.

                                                                                                        PAGINA 13
DECARBONISING THE STEAM SUPPLY OF THE DUTCH PAPER AND BOARD INDUSTRY
THE PAPER AND BOARD INDUSTRY IN THE NETHERLANDS
The Dutch paper and board mills produce different end products, use various input materials and
are also different in their energy consumption and production.
This chapter provides an overview of information on the Dutch paper and board industry for the
year 2015, with respect to:
• Product categories and production capacities;
• Production processes, specific energy consumption and material use;
• Energy consumption, energy production and greenhouse gas emissions;
• Investments, market prices of materials and operating and maintenance costs.
Methodology for data collection
For this report, ECN part of TNO, the Royal Association of Dutch Paper and Paperboard (VNP) and
the Knowledge Centre for Paper and Cardboard (KCPK) have compiled a dataset with information
about the Dutch paper and board industry. Most of the data have been obtained from an existing
dataset of the VNP containing data on capacities, energy, materials and emissions in 2015. The
data has been gapfilled and corrected, and, in some cases, aggregated and rounded off to
prevent confidentiality issues.
Product categories and production capacities
The Dutch paper and board industry produces different types of paper and board, each with their
own characteristics (e.g. in terms of thickness and strength). These characteristics determine the
possibilities for application.
In 2015, about 68% of the Dutch paper and board production consisted of packaging materials
(corrugated board, solid board and folding boxboard), 28% of graphic paper (based on virgin and
recovered fibre), and 4% of sanitary paper.
Product categories
For the data collection, the types of paper and board produced in the Netherlands were
categorized as follows :
• Graphic paper: The high quality of printing and writing paper used in e.g. magazines
requires primary fibre pulp. The quality is related to the end product, as consumers
demand a certain whiteness and brightness. This type is dominated by chemical pulping
because of the requirement for a high level of brightness and good strength;
• Graphic paper made from recovered paper: Similar to graphic paper but produced from
recovered paper. Mainly used for applications such as leaflets;
• Corrugated board: Corrugated board can consist of different combinations of layers of
sheets produced from recovered pulp, mechanical pulp and chemical pulp. In the
PAGINA 14DECARBONISING THE STEAM SUPPLY OF THE DUTCH PAPER AND BOARD INDUSTRY
Netherlands mainly recovered pulp is used. This type of paper has a wide variety of
applications but is mostly used for packaging;
• Solid board: Solid board consists of 100% recovered paper and has multiple
applications e.g. book covers and food plates. Because of its applications, it does not
require deinking;
• Folding boxboard: Folding boxboard can consist of different types of fibres and is
typically used as packaging material of various food products. In the Netherlands this
paper grade consists of recovered paper and mechanical pulp. Because of its
application, the outer layer needs to be representative; the layers therefore undergo
either deinking steps or bleaching;
• Sanitary paper: Sanitary paper can be produced from primary fibre or recovered fibre,
and is used to produce e.g. toilet paper and tissues. The primary fibre is generally from
chemical pulp. Sanitary paper needs to be strong, absorbent and soft.
Production and production capacities
Figure 1 shows the production capacity per product type in 2015. The product types that take the
largest shares of the production capacity are corrugated board (37%), solid board (25%), graphic
paper (20%) and graphic paper from recovered paper (10%).
560
730 280
140
1.055 105
Corrugated board Solid board
Graphic paper Graphic paper (recovered paper)
Folding boxboard Sanitary paper
PAGINA 15DECARBONISING THE STEAM SUPPLY OF THE DUTCH PAPER AND BOARD INDUSTRY
Table 1: The number of mills, paper machine capacity, production and the number of paper
machines by product type in 2015 (source: adapted VNP data)
The production volumes, the number of mills and the number of paper machines are presented in
Table 1. In 2015, there were 21 mills with a total production capacity of approx. 2,900 kton per year.
The mills realised an average annual capacity utilization of 92%.
Product type Number Paper machine Production Number of paper
of mills capacity (kton/yr) (kton/year) machines
Corrugated board 4 1,055 992 221
Solid board 7 730 655 11
Graphic paper 6 560 510 10
Graphic paper from recovered paper 1 280 252 1
Folding boxboard 1 140 133 1
Sanitary paper 2 105 97 4
Total 21 2,870 2,639 49
The annual production capacity of the individual mills ranged from 5,000 to 600,000 tons per year
(see Table 2). Large mills typically produce bulk products, whereas smaller mills tend to produce
more specialized products. Except for one, all of the paper mills are part of a larger corporate
group.
Table 2 Production sites in the paper and board industry in 2015 (source: adapted VNP data)
Product category Name of production site Corporate group Town/locality (ton/year)
Corrugated board DS Smith Paper De Hoop Mill DS Smith EERBEEK 350,000
Huhtamaki Nederland BV Huhtamaki FRANEKER 35,000
Papierfabriek Doetinchem B.V. Papierfabriek Doetinchem DOETINCHEM
70,000
B.V.
Smurfit Kappa Roermond Papier B.V. Smurfit Kappa ROERMOND 600,000
Folding boxboard Mayr-Melnhof Eerbeek B.V. Mayr Melnhof EERBEEK 140,000
Crown Van Gelder B.V. Andlinger Company VELSEN 240,000
1
Note that this figure cannot be compared directly to the other categories, as it includes the machines of a paper mill that has a very
different production process.
PAGINA 16DECARBONISING THE STEAM SUPPLY OF THE DUTCH PAPER AND BOARD INDUSTRY
Graphic paper Marsna Paper B.V. Marsna MEERSSEN 5,000
Papierfabriek Schut B.V. Exacompta Clairefontaine SA HEELSUM 5,000
Sappi Maastricht BV Sappi MAASTRICHT 280,000
VHP Ugchelen B.V. VHP UGCHELEN 5,000
W.A. Sanders Coldenhove Holding Neenah EERBEEK
25,000
B.V.
Graphic paper from Parenco B.V. H2 Equity Partners RENKUM
280,000
recovered paper
Sanitary paper SCA Hygiene Products Cuijk B.V. Essity KATWIJK A/D
60,000
MAAS (NB)
Van Houtum Holding B.V. WEPA SWALMEN 45,000
Solid board Eska Graphic Board Hoogezand Andlinger Company HOOGEZAND 170,000
Eska Graphic Board Sappemeer Andlinger Company SAPPEMEER 110,000
Smart Packaging Solutions B.V. VPK Packaging Group LOENEN 70,000
Solidus Solutions Board B.V. loc. Bad Solidus Solutions BAD
Nieuweschans NIEUWESCHA 120,000
NS
Solidus Solutions Board B.V. locatie Solidus Solutions COEVORDEN
110,000
Coevorden
Solidus Solutions Board B.V. locatie Solidus Solutions HOOGHERK
90,000
Hoogkerk
Solidus Solutions Board B.V. locatie Solidus Solutions OUDE PEKELA
60,000
Oude Pekela
Production processes, energy consumption and material use
Paper and board production consists of the production and preparation of the fibres, formation of
the paper, and drying. The thermal drying of the paper accounts for most of the steam use. The
specific electricity consumption varies much more between paper types than the specific steam
consumption. Depending on the required quality and characteristics of the end-product, each
paper and board type uses a different set of material inputs.
Production processes
The production process consists of the production of pulp (from wood or recovered paper), and
the production of paper or board. In the Netherlands, there is, with the exception of one mill, no
pulp production from wood. The pulp is produced from either recovered paper or from imported
PAGINA 17DECARBONISING THE STEAM SUPPLY OF THE DUTCH PAPER AND BOARD INDUSTRY virgin fibre. Therefore, the energy consumption in the Dutch paper and board industry is almost exclusively due to paper and board production processes. For virgin fibres the preparation step consists mainly of refining of the fibres to create the required characteristics of the fibres for the paper or board product. For pulp produced from recovered paper, cleaning steps are required to remove unwanted elements (plastics, ash etc.) and, in some cases, de-inking and dispersion steps to remove inkt. The pulp (~1% dry matter content) is then spread over the wire to form paper. After the press section, in which water is mechanically removed, the pulp (with now a dry matter content of ~50%) is guided over hot cylinders for thermal removal of the remaining water. For some products a coating is applied after the (pre) drying section to increase the strength or to improve the writability of the product. In the case of applying a coating, the paper, or board, is dried again using another set of cylinders (after-drying section). PAGINA 18
DECARBONISING THE STEAM SUPPLY OF THE DUTCH PAPER AND BOARD INDUSTRY

 There are different types or qualities of steam. We distinguish here between two types based
 on the pressure or temperature level:
 •       Low and medium temperature steam
 This is steam with temperatures up to 200°C and pressures up to 15 barg
 •       High temperature steam
 This is steam with higher temperatures than 200°C
 Low and medium temperature steam represents approximately 75% of the energy used as
 steam in industry. This type of steam is used in sectors as diverse as pulp and paper, food and
 nutrition, fine chemicals, and textiles. High temperature steam is much more prevalent in the
 energy sector. This type of steam is used in steam turbines for electricity generation for
 example. In the manufacturing industry it is used for mechanical drive trains (and the effluent
 low-pressure steam for heating) and for heating high temperature processes such as cracking.
 The energy transition calls for a drop-in carbon free alternative
 Steam boilers are thus still an indispensable energy resource for many industrial processes and
 will remain to be so for the foreseeable future. It will be impossible to reach the goals of the
 COP-21 agreement (UNFCC, 2015) without addressing CO2 emissions from steam boilers.
 Steam as an energy carrier is usually embedded in the core production process by means of
 heat exchangers and nozzles. Switching to another energy carrier (e.g. electric heating) in the
 process means replacing most or all or the equipment and reinventing the production process.
 These represent considerable costs and a very high risk to product quality and cost price.
 For this reason, it is desirable to have a drop-in replacement for just the steam boiler. That way,
 the bulk of the manufacturing process can remain the same; only the boiler needs to be
 replaced.

                                                       • Cleaning
                                                       • De-inking
                                                       • Dispersion
                                           Stock       • Refining
                                        preparation

                                                       • Forming
                                                       • Pressing
                                                       • Pre-drying
                                       Paper/board     • Coating
                                                       • After-drying
                                        production

FIGURE 1: STEPS IN THE PAPER AND BOARD PRODUCTION PROCESS

                                                                                                                  PAGINA 19
DECARBONISING THE STEAM SUPPLY OF THE DUTCH PAPER AND BOARD INDUSTRY
Steam is used to attain the required dry matter content of the end product. The steam
temperature varies between 150 and 180°C (see Table 3). The steam is typically produced using a
boiler or a combined heat and power (CHP) installation.
Table 3: Overview of used steam temperature per paper type (source: adapted VNP data)
Company name Steam temperature drying section (max) Steam pressure drying section
(max) [barg]
[°C]
Corrugated board 180 10
Graphic paper 150 5
Sanitary paper 165 7
Solid board 180 10
Folding boxboard 180 10
Graphic paper made from recovered paper 150 5
Specific energy consumption
Analysis of the data shows that the process step with the highest energy consumption is the drying
step. The specific energy consumption for the drying step generally varies between 3.6 and 6.2
GJ/ton, and depends on the dry matter content of the pulp before going into the drying section,
the need for coating, and the amount of energy recovery from the heat coming out of the drying
section (Laurijssen, 2013). After evaporation of the water, the energy (in the form of waste heat) is
only partially recovered via heat exchangers, due to a lack of application possibilities.
The specific electricity consumption varies much more between paper types than the specific
steam consumption, as can be seen in Figure 2. The specific electricity consumption in the stock
preparation can be high if (for quality reasons) deinking and dispersion is required, as is the case
for graphic paper produced from recovered paper, and for sanitary paper.
Solid board and corrugated board production use relatively little electricity compared to their heat
consumption, whereas sanitary paper and graphic paper made from recovered paper use a
relatively large amount of electricity (mostly related to the energy required for the deinking steps
of these mills).
PAGINA 20DECARBONISING THE STEAM SUPPLY OF THE DUTCH PAPER AND BOARD INDUSTRY
Specific electricity consumption Specific consumption of heat/steam
6,2
5,7
5,3
5,2
4,5
4,0
4,0
[GJ/TON]
3,8
2,9
2,2
1,1
1,0
CORRUGATED FOLDING GRAPHIC GRAPHIC SANITARY SOLID BOARD
BOARD BOXBOARD PAPER PAPER PAPER
(RECOVERED
PAPER)
FIGURE 2 SPECIFIC ENERGY CONSUMPTION OF HEAT/STEAM AND ELECTRICITY PER PRODUCT TYPE IN 2015 (SOURCE: ADAPTED VNP
DATA)
Material use
Depending on the required quality and characteristics of the end-product, each paper and board
type uses a different set of material inputs (see Table 4). Graphic paper uses virgin pulp (chemical
pulp) in order to obtain the required brightness, but also uses a large amount of filler material
(CaCO3). Folding boxboard also uses virgin fibre, but it uses mechanical pulp instead of chemical
pulp. The other paper and board products are produced almost completely from recovered paper.
Many mills also apply a coating to provide their product with strength or writability qualities.
Especially maize or potato starch is utilized for coating.
TABLE 4: OVERVIEW OF MATERIAL CONSUMPTION PER PAPER TYPE IN 2015 (SOURCE: ADAPTED VNP DATA)
Recovered paper Virgin fibre Other
Corrugated board 96% 4%
Folding boxboard 32% 61% 7%
Graphic paper 63% 37%
Graphic paper made from recovered paper 89% 11%
PAGINA 21DECARBONISING THE STEAM SUPPLY OF THE DUTCH PAPER AND BOARD INDUSTRY
Sanitary paper 99% 1%
Solid board 100%
Energy consumption, energy production and CO 2 emissions
Energy consumption
Steam/heat consumption and the final electricity consumption demonstrates large differences in
scale between the mills. The bulk producing corrugated board and graphic paper mills (both virgin
fibres and recovered paper based) have a significantly larger need for energy than the other mills.
This is in stark contrast to the more specialized paper mills that produce a larger variety of
products in much lower quantities.
Combined heat and power (CHP)
In 2015, ten paper mills used combined heat and power (CHP) installations to cover (part of) their
steam demand. The total electrical capacity of these installations was 217 MWe. The total fuel input
was 14.7 PJ. The total electricity production was 4.1 PJ and the total steam/heat production was
7.8 PJ.
Fuel input (PJ) Steam/heat production (PJ) Electricity production (PJ)
5,7
4,9
[PJ]
3,1
2,6
2,2
1,6
1,6
1,6
1,1
0,6
0,5
0,4
0,3
0,2
0,1
CORRUGATED GRAPHIC PAPER SOLID BOARD FOLDING SANITARY PAPER
BOARD BOXBOARD
FIGURE 3 FUEL INPUT, STEAM PRODUCTION AND ELECTRICITY PRODUCTION OF CHP INSTALLATIONS IN 2015 (SOURCE: ADAPTED
VNP DATA)
PAGINA 22DECARBONISING THE STEAM SUPPLY OF THE DUTCH PAPER AND BOARD INDUSTRY
Electrical CHP capacity [MW e] Thermal CHP capacity [MW th]
Graphic paper 93 213
Corrugated board 84 131
Solid board 24 115
Folding boxboard 13 22
Sanitary paper 4 15
Graphic paper from recovered paper 0 0
Total 217 496
FIGURE 4 ELECTRICAL AND THERMAL CAPACITY OF CHP INSTALLATIONS IN THE PAPER AND BOARD INDUSTRY IN 2015 (SOURCE:
ADAPTED VNP DATA)
According to Statistics Netherlands (CBS), in 2015 there were 25 CHP-installations in the Dutch
paper and board industry with a total electrical capacity of 309 MWe.2 The Dutch paper and board
industry has previously invested heavily in combined heat and power installations to meet their
energy demand. Due to unfavorable gas and electricity prices, some of these have been
decommissioned, and therefore no longer appear in the database of the VNP, but are still
included in the statistics of CBS.
Final electricity consumption
The final electricity consumption in the Dutch paper and board industry was 4.6 PJ in 2015. The
total electricity generation by CHP installations was 4.1 PJ. Part of the electricity produced by the
CHP installations is sold to the grid.
For the product types ‘Graphic paper’ and ‘Corrugated board’, there are several mills whose
production of electricity (by their CHP installations) exceeds their final electricity consumption. The
net electricity consumption of these mills is negative.
2
Source: Elektriciteit; productie en productiemiddelen, Statistics Netherlands (CBS) (preliminary data for 2015).
PAGINA 23DECARBONISING THE STEAM SUPPLY OF THE DUTCH PAPER AND BOARD INDUSTRY
Final electricity consumption Electricity production CHP Net electricity consumption
1,6
1,6
1,1
1,1
1,0
1,0
0,7
0,5
0,4
0,4
0,3
0,3
[PJ]
0,1
0,1
0,1
0,0
-0,5
-0,5
GRAPHIC CORRUGATED GRAPHIC SOLID BOARD SANITARY FOLDING
PAPER BOARD PAPER FROM PAPER BOXBOARD
RECOVERED
PAPER
FIGURE 5 FINAL ELECTRICITY CONSUMPTION, ELECTRICITY PRODUCTION OF CHP AND NET ELECTRICITY CONSUMPTION PER
PRODUCT TYPE IN 2015 (SOURCE: ADAPTED VNP DATA)
Steam/heat consumption
Figure shows the consumption of steam/heat per product type in 2015. The total consumption of
steam/heat was 12.5 PJ of which 62% (7.8 PJ) was produced by CHP installations.
Most boilers and CHPs in the Dutch paper and board industry use natural gas to convert water into
steam. One mill uses deinking sludge and biomass as fuel input. Aside for steam production,
natural gas is also used for other forms of drying. Mills producing sanitary paper blow hot air
against the paper in the drying section. There is one mill producing a type of packaging board that
does not use any cylinders but uses mostly hot air for the drying of its products.
PAGINA 24DECARBONISING THE STEAM SUPPLY OF THE DUTCH PAPER AND BOARD INDUSTRY
Steam/heat consumption Steam/heat production CHP
4,5
3,1
2,7
2,6
[PJ]
2,2
1,6
1,4
0,7
0,6
0,6
0,2
0,0
CORRUGATED GRAPHIC SOLID BOARD GRAPHIC FOLDING SANITARY
BOARD PAPER PAPER FROM BOXBOARD PAPER
RECOVERED
PAPER
FIGURE 6 STEAM/HEAT CONSUMPTION AND STEAM/HEAT PRODUCTION OF CHP PER PRODUCT TYPE IN 2015 (SOURCE: ADAPTED
VNP DATA)
Greenhouse gas emissions
The greenhouse gas emissions of the paper mills that participate in the EU Emissions Trading
System (EU ETS) are publicly available (see Table 5). The dataset of the Dutch Emissions Authority
(NEa) has been linked to the dataset which has been compiled for this study.
In 2015, the total ETS emissions of the paper and board plants amounted to 1,054 kton CO2-eq.
Only VHP Ugchelen B.V. and Papierfabriek Schut B.V. did not participate in the ETS.
TABLE 5: OVERVIEW OF ETS EMISSIONS PER PRODUCTION SITE (SOURCE: DUTCH EMISSIONS AUTHORITY (NEA))
Production site Town/locality ETS emissions 2015 [kton CO2-eq.]
DS Smith Paper De Hoop Mill EERBEEK 216,5
Smurfit Kappa Roermond Papier B.V. ROERMOND 162,7
Sappi Maastricht BV MAASTRICHT 151,3
Crown Van Gelder B.V. VELSEN 142,7
Mayr-Melnhof Eerbeek B.V. EERBEEK 67,6
Eska Graphic Board Hoogezand HOOGEZAND 59,6
Solidus Solutions Board B.V. loc. Bad Nieuweschans BAD NIEUWESCHANS 37,4
Eska Graphic Board Sappemeer SAPPEMEER 32,8
PAGINA 25DECARBONISING THE STEAM SUPPLY OF THE DUTCH PAPER AND BOARD INDUSTRY Solidus Solutions Board B.V. locatie Oude Pekela OUDE PEKELA 24,3 Van Houtum Holding B.V. SWALMEN 23,4 Solidus Solutions Board B.V. locatie Coevorden COEVORDEN 21,9 Papierfabriek Doetinchem B.V. DOETINCHEM 20,2 SCA Hygiene Products Cuijk B.V. KATWIJK A/D MAAS (NB) 19,5 Parenco B.V. RENKUM 18,8 Solidus Solutions Board B.V. locatie Hoogkerk HOOGHERK 17,2 Huhtamaki Nederland BV FRANEKER 12,9 Smart Packaging Solutions B.V. LOENEN 12,6 W.A. Sanders Coldenhove Holding B.V. EERBEEK 10,1 Marsna Paper B.V. MEERSSEN 2,7 VHP Ugchelen B.V. UGCHELEN - Papierfabriek Schut B.V. HEELSUM - Totaal 1054,2 Figure shows the share of each product type in the EU ETS greenhouse gas emissions of the paper mills in 2015. The contributions of production of corrugated board (42%) and graphic paper (31%) are the largest. PAGINA 26
DECARBONISING THE STEAM SUPPLY OF THE DUTCH PAPER AND BOARD INDUSTRY

                                        29%

                                                                                      20%

                                                                                       2%

                                                                                         6%

                                                                                    4%

           Corrugated board               39%                        Graphic paper
           Solid board                                               Graphic paper (recovered paper)
           Folding boxboard                                          Sanitary paper

FIGURE 7 SHARE OF ETS GREENHOUSE GAS EMISSIONS PER PRODUCT TYPE IN 2015 (SOURCE: ADAPTED VNP DATA AND NEA DATA)

Investments, market prices and O&M costs
In 2015, the paper and board industry had 3.896 employees and a total revenue of 1.7 billion EUR
(Koninklijke VNP, 2017). A large share of the total cost of paper and board production comes from
the cost for raw materials. This section also discusses investments and operation and maintenance
(O&M) costs.

Investments
The paper and board industry is a sector that is characterized, for the most part, by bulk
production. The investments per paper machine can exceed half a billion euro (see Table 6). The
frame of the paper machine can generally last a very long time, but its individual components (wire
section, presses, drying hood, cylinders, etc.) need to be replaced more regularly. An overhaul is
assumed to take place every 15 years.
Investments are necessary for the stock preparation as well as the paper machine. Table 6 shows
that the paper machine equipment, consisting of the heavy machinery needed to form, press and
dry the paper and high speed drives, is far more capital intensive than the equipment required for
the stock preparation. The table also shows that larger paper machines are less expensive than
smaller ones, when compared per installed unit of capacity.

                                                                                                              PAGINA 27
DECARBONISING THE STEAM SUPPLY OF THE DUTCH PAPER AND BOARD INDUSTRY
TABLE 6 INVESTMENT COSTS FOR PAPER MACHINES AND STOCK PREPARATION (SOURCE: ESTIMATE BY VNP)
Capacity (ton/yr) Investment (mln euro) Investment per unit of annual capacity (euro/ton)
New paper machine 80,000 250 3,125
New paper machine 400,000 500 1,250
New paper machine 500,000 600 1,200
Stock preparation 400,000 3.0 8
Stock preparation 500,000 4.0 8
Market prices for materials
Much of the production cost in paper and board production is related to the cost of raw materials
(Technopolis group, 2016). Note that the prices for virgin fibres can be higher, per ton, than the
market price of the graphic paper for which it is the feedstock. The reason for this is that a
significant amount of the input material for these types of paper consists of fillers, which cost far
less, thereby compensating for the price of the pulp.
TABLE 7: MARKET PRICES FOR MATERIALS IN 2017 (SOURCE: RISI)
Material Market price (€/ton)
Old paper (mixed) 129
Pulp; Cellulose, Northern bleached softwood kraft (NBSK) 788
Pulp; Cellulose, Bleached eucalyptus kraft pulp (BEKP) 836
Graphic paper 628
Newsprint 431
Uncoated mechanical 550
Coated mechanical 619
Uncoated woodfree 811
Coated woodfree 729
Corrugated board 629
Containerboard Virgin fibre 699
Containerboard Recycled Paper 559
Sanitary paper (Frankrijk) 920
Solid board 375
Folding boxboard 891
Cartonboard coated duplex 1,065
PAGINA 28DECARBONISING THE STEAM SUPPLY OF THE DUTCH PAPER AND BOARD INDUSTRY
Cartonboard White-lined chipboard 717
Specialty paper 900
Operation and maintenance costs
Operation and maintenance (O&M) costs3 are an important part of the operational costs in paper
and board production. Estimates for the operation and maintenance costs (see Table 8) were
provided by the Knowledge Centre for Paper and Cardboard (KCPK), using a report of the
Technopolis Group (Technopolis group, 2016). The O&M costs are relatively high for sanitary
paper and relatively low for corrugated board.
TABLE 8 ASSUMPTIONS ON OPERATING AND MAINTENANCE COSTS (SOURCE: KCPK/CEPI)
€ in 2014 per ton product Operating and maintenance
costs (O&M)
Corrugated board 64
Graphic paper 84
Sanitary paper 132
Solid board 94
Folding boxboard 94
Graphic paper made from recovered paper 83
3
The costs for energy and raw materials are not included in the O&M costs.
PAGINA 29DECARBONISING THE STEAM SUPPLY OF THE DUTCH PAPER AND BOARD INDUSTRY PAGINA 30
DECARBONISING THE STEAM SUPPLY OF THE DUTCH PAPER AND BOARD INDUSTRY
ALTERNATIVE TECHNOLOGIES FOR STEAM PRODUCTION
This chapter gives an overview of the selected technology options. It considers the technology
characteristics and the cost of generating steam. The results are discussed in the context of the
targets for greenhouse gas emissions reductions in the industry.
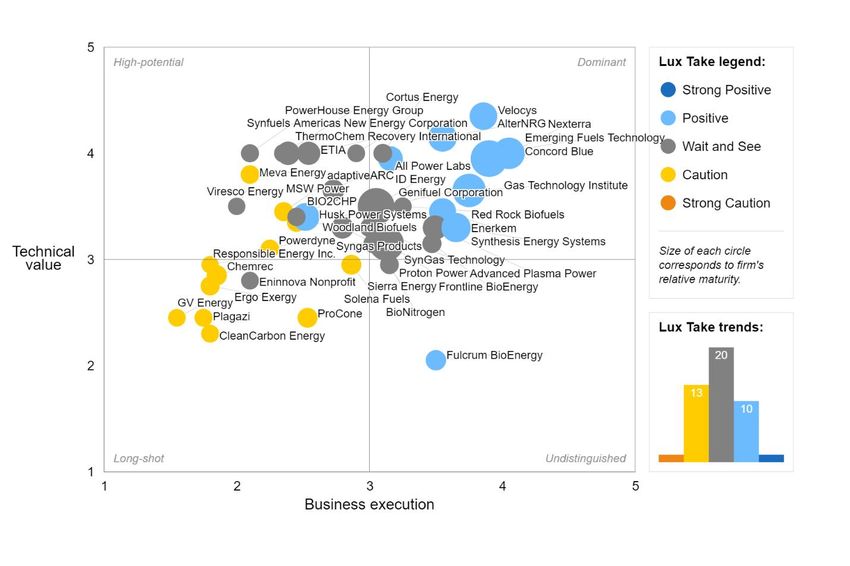
Lux Research provided information on new (energy) technology to improve company’s innovation
investment decisions. Lux has much data on individual technology developments. To model future
performance of a technology, Lux looked at all this data, picked representative high performing
developers and assessed the potential performance of their technology. The methodology and
procedure that Lux used is described in more detail in the Annex 1.
To select and subsequently describe future technologies to include in the system model, Lux used
the following procedure:
• Identify all possible technology options that could replace a steam boiler
• Select the most promising options together with industry and government
• Collect data on each of the selected technologies
• Select one or two representative developments to extrapolate to future performance
• Extrapolate the key metrics of the technology to a fully developed state
• Calculate mass and energy balances for each technology
Identifying technology options based on a defined function
To find suitable technology options, Lux break the technology to be replaced down to its core
function. In this case, the core function for the pulp and paper industry. Steam is primarily used in
the pulp and paper industry to dry sheets of pulped cellulose. Steam flows through rotating drums.
The paper is pulled over these drums. The steam keeps the drum surface temperature constant at
the saturation temperature of the steam and transfers heat to the paper while condensing steam.
The condensate is returned to the boiler, where the hot water is evaporated again. In this way, heat
generated in the boiler by burning fuel is transferred to the wet sheets of proto-paper at the right
temperature and rate.
This understanding of the core function of steam still leaves room for three different definitions of
the function of this technology to be replaced:
1. The function is to supply saturated steam of a given temperature to the process
2. The function is to keep the drum surface temperature constant and transfer heat to the
paper through the drum
3. The function is to dry the paper
These definitions would all be valid for the paper industry. From option 1 to 3 the definitions
become increasingly “invasive” for the paper making process itself. The likelihood that the paper
making equipment will need to be adapted increases from definition 1 to 3. At the same time, the
number of technologies to choose from will probably also increase from definition 1 to 3.
PAGINA 31Vous pouvez aussi lire