The Mw 7.1, Hector Mine, California earthquake: surface rupture, surface displacement field, and fault slip solution from ERS SAR data
←
→
Transcription du contenu de la page
Si votre navigateur ne rend pas la page correctement, lisez s'il vous plaît le contenu de la page ci-dessous
C. R. Acad. Sci. Paris, Sciences de la Terre et des planètes / Earth and Planetary Sciences 333 (2001) 545–555
2001 Académie des sciences / Éditions scientifiques et médicales Elsevier SAS. Tous droits réservés
S1251-8050(01)01658-5/FLA
Tectonique / Tectonics
The Mw 7.1, Hector Mine, California earthquake:
surface rupture, surface displacement field, and fault
slip solution from ERS SAR data
Gilles Peltzera,b,∗ , Frédéric Crampéa,b , Paul Rosenb
a Earth and Space Science Department, University of California, Los Angeles, CA 90095, USA
b Jet Propulsion Laboratory, California Institute of Technology, Pasadena, CA 91109, USA
Received 21 May 2001; accepted 8 August 2001
Abstract – The Mw7.1, Hector Mine, California earthquake of October 16, 1999
produced a 50 km-long surface rupture, ∼20 km east of the surface rupture of the
1992 Landers earthquake. ERS2 radar data acquired before and after the event provide
geodetic measurements of two components of the co-seismic surface displacement field.
(1) Interferometric processing of the data provides the range (radar line of sight) component
of the displacement field with a precision of a few millimeters. (2) The sub-pixel correlation
of the before and after amplitude images provides a second component of the surface
displacement field, parallel to the satellite track, with a precision of ∼20 cm. The azimuth
offset map reveals a ∼50 km long, NNW surface rupture formed of three sections: a N40◦ W
southern section following the Bullion fault, a N10◦ W central section cutting through the
Bullion Mountains, and a northern N40◦ W section extending up to the Lavic Lake. A north–
south-trending, localized gradient in the azimuth offset field suggests that the central section
of the fault extends to the north at depth over a distance of ∼10 km. The slip distribution
curve constructed using the azimuth offsets has a bell shape, with a maximum of 6.5 m at
the north end of the central fault section. The fault slip model derived from the inversion
of the azimuth and from range displacement data indicates that 3–5.8 m of right-lateral slip
occurred between the depths of 0 and 8 km along the northern and the central sections of the
fault. The solution bears a down-dip component of slip of ∼2 m, west side down, along the
southern part of the northern fault section. The down-dip component of slip is consistent
with compression on a northeast dipping fault. 2001 Académie des sciences / Éditions
scientifiques et médicales Elsevier SAS
earthquake / Hector Mine / radar interferometry / geodesy / California
Résumé – Le tremblement de terre de Hector Mine, Californie, de magnitude 7,1 : rupture de
surface, champ de déplacement et modèle de glissement sur la faille à partir de données SAR
du satellite ERS. Le tremblement de terre de Hector Mine, en Californie, de magnitude 7,1, survenu
le 16 octobre 1999 a produit une rupture de surface de 50 km de long, à ∼20 km à l’est de la rupture
du tremblement de terre de Landers de 1992. Des images radar acquises par le satellite ERS2 avant
et après l’événement fournissent la mesure de deux composantes du champ de déplacement co-
sismique. (1) Le traitement interférométrique des données fournit la composante le long de l’axe de
visée du radar avec une précision de quelques millimètres. (2) La corrélation des images d’amplitude
fournit la composante du déplacement en azimut, parallèle à la trace du satellite, avec une précision
de ∼20 cm. La carte des déplacements en azimut révèle une rupture de surface de ∼50 km de
∗ Correspondence and reprints.
E-mail address: peltzer@ess.ucla.edu (G. Peltzer).
545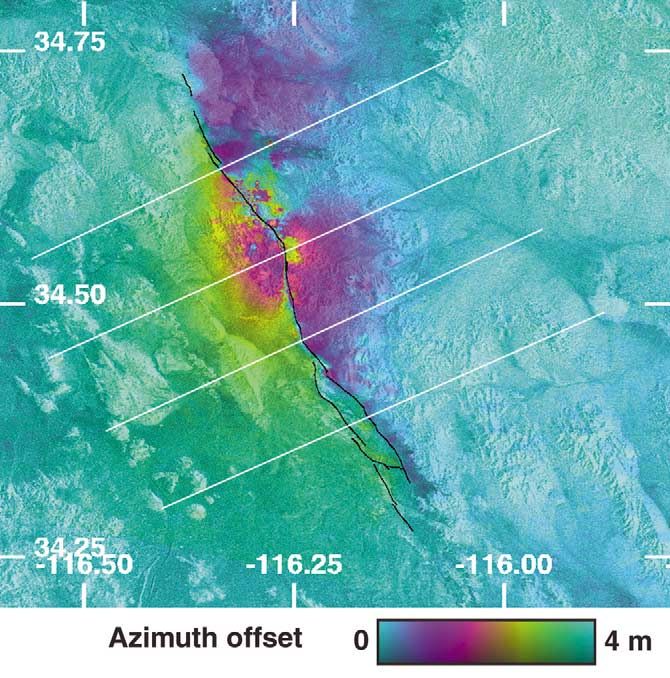
G. Peltzer et al. / C. R. Acad. Sci. Paris, Sciences de la Terre et des planètes / Earth and Planetary Sciences 333 (2001) 545–555
long, de direction NNW, constituée de trois sections : une section sud, de direction N40◦W, une
section centrale de direction N10◦ W, passant au travers du massif de Buillon, et une section nord, de
direction N40◦ W, allant jusqu’au lac de Lavic. Une zone de gradient localisée de direction nord–sud
suggère que la section centrale de la faille s’étende en profondeur vers le nord, sur environ 10 km.
La courbe de distribution de glissement, construite à partir des données de déplacement en azimut, a
une forme en cloche et atteint un maximum de 6,5 m le long de la partie nord de la section centrale
de la faille. Le modèle de glissement sur la faille, calculé par inversion des deux composantes du
déplacement de surface, indique qu’un glissement dextre de 3 à 5,8 m s’est produit entre 0 et 8 km
de profondeur, le long des sections nord et centrale de la faille. La solution indique également une
composante de glissement d’environ 2 m dans la direction du pendage de la faille, abaissant le
compartiment ouest le long de la partie sud de la section nord de la faille. Une telle composante est
en accord avec un régime compressif sur une faille à pendage vers le nord-est, comme le suggère
la distribution en profondeur des répliques sismiques. 2001 Académie des sciences / Éditions
scientifiques et médicales Elsevier SAS
tremblement de terre / Hector Mine / interférométrie radar / geodésie / Californie
Version abrégée avec une précision de quelques millimètres (figure 2) ;
(2) la corrélation des images d’amplitude, qui fournit une
1. Introduction estimation de la composante horizontale du déplacement
de surface, parallèle à la trace du satellite au sol (figure 3).
L’interférométrie radar est une technique d’imagerie La précision de cette composante, dite en azimut, est
qui permet de construire des cartes de la topographie d’environ 20 cm pour ce système.
et des déplacements de la surface de la Terre. Depuis
l’avènement des systèmes radar embarqués sur satellites 4. Rupture de surface et distribution de
(principalement les satellites ERS, JERS et Radarsat, glissement
ainsi que les missions SAR de la navette spatiale), les
images radar sont utilisées pour étudier de nombreux La trace de la rupture de surface s’observe directement
phénomènes géophysiques, comme les tremblements de dans la carte des déplacements en azimut (figure 3). Ces
terre, les volcans, les glissements de terrain et l’écoulement données fournissent également une bonne estimation des
des glaciers. Cet article présente un exemple d’application glissements le long de la faille en surface. La distribution
de cette nouvelle technique à l’étude du tremblement de de glissement est bimodale, le segment principal étant situé
terre d’Hector Mine, en Californie, de magnitude 7,1, le long de la section nord, longue de 40 km (figure 4).
survenu le 16 octobre 1999. Ces observations sont en général en accord avec les
observations faites sur le terrain.
2. Le tremblement de terre d’Hector Mine,
5. Champ de déplacement de surface
Californie bi-dimensionnel
Le tremblement de terre d’Hector Mine a produit une L’analyse des données radar par interférométrie et cor-
rupture de surface de 50 km de long dans la zone de rélation des images d’amplitude fournit deux composantes
cisaillement de Californie de l’Est, à environ 20 km à l’est du champ de déplacement : l’une, précise à quelques milli-
de la rupture du séisme de Landers de juin 1992 (figure 1). mètres, le long de l’axe de visée du radar, l’autre, précise à
La rupture complexe est formée de trois segments, dont environ 20 cm, le long de l’axe de la trace au sol du satel-
certains suivent les failles quaternaires de Buillon et de lite. La composante le long de l’axe de visée est principa-
Lavic. L’enregistrement sismique et les observations de lement sensible aux déplacements verticaux et également
terrain indiquent que la faille a produit un déplacement à la composante horizontale, perpendiculaire à la trace du
dextre, avec un déplacement de surface maximum de plus radar. L’observation de ces deux composantes montre les
de 5 m. complexités de la rupture et des déplacements proches (fi-
gures 2a, 3a et 5). En accord avec la distribution des ré-
3. Analyse des données radar pliques sismiques, elle suggère en particulier que la rup-
ture se divise en deux branches vers le nord, la branche est
Le satellite ERS-2 de l’Agence spatiale européenne a
n’atteignant pas la surface.
acquis des images de la région le 15 septembre 1999, 30
jours avant l’événement, et le 20 octobre 1999, quatre 6. Solution de glissement sur la faille en
jours après. Deux traitements ont été conduits : (1) un
profondeur
traitement interférométrique avec le logiciel ROI_PAC,
développé au JPL, qui donne accès à une mesure du Les deux composantes du champ de déplacement ont
déplacement co-sismique dans l’axe de visée du radar, été inversées pour résoudre le glissement sur la faille en
546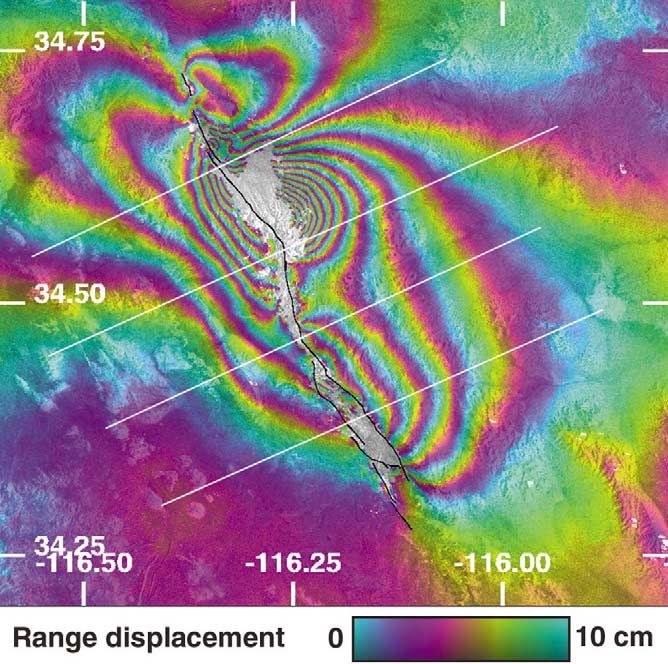
G. Peltzer et al. / C. R. Acad. Sci. Paris, Sciences de la Terre et des planètes / Earth and Planetary Sciences 333 (2001) 545–555

profondeur. La faille est modélisée par des sections ver-                7. Conclusions
ticales planes de ∼5 km de long et de 4 km en ver-
tical, suivant la rupture de surface. La solution indique                   Une paire d’images radar ERS encadrant le tremblement
que le déplacement est essentiellement dextre et loca-                   de terre de Hector Mine a permis de carter la rupture de
lisé entre les profondeurs de 0 et 8 km sur les sec-                     surface, d’estimer la distribution de glissement en surface
tions centrale et nord de la faille (figure 6). La solution              le long de la faille, de déterminer deux composantes du
montre également une composante verticale du déplace-                    champ de déplacement sur une zone de 100 km par 200 km,
ment le long des sections au nord du point de change-                    et de résoudre le glissement en profondeur par inversion du
ment abrupt de la direction de la faille (figure 6). Cette               champ de déplacement de surface. Ces résultats, en bon ac-
composante est compatible avec un mouvement chevau-                      cord avec les enregistrements sismologiques et les observa-
chant sur une faille à fort pendage vers le nord-est,                    tions de terrain, ont été obtenus dans les semaines qui ont
comme le suggère la distribution des répliques en profon-                suivi l’événement, grâce à l’acquisition et à la distribution
deur.                                                                    rapide des données par l’Agence spatiale européenne.

1. Introduction                                                          2. The Hector Mine, California
                                                                         earthquake
   Synthetic aperture radar interferometry (InSAR) is
an imaging technique providing maps of the topogra-                         The Hector Mine earthquake produced a N150◦ E,
phy and displacement of the Earth’s surface. Since the                   50 km-long surface rupture within the East Califor-
advent of space borne radar instruments (essentially                     nia Shear Zone, approximately 20 km east of the Lan-
the European Space Agency Earth Remote Sensing                           ders earthquake surface break of June 1992 (figure 1).
Satellites (ERS), the Japanese JERS-1, the Canadian                      The rupture follows sections of the Lavic Lake fault
RADARSAT, and the US Shuttle radar missions), In-                        in the North and of the Bullion fault in the South [6,
SAR has been used to study a variety of geophysi-                        20]. Centroid moment tensor solution and inversion
cal phenomena including earthquakes, volcanic activ-                     of broadband seismic data show a right-lateral sense
ity, ground subsidence, landslides, and glacier flow.                    of slip on a NNW oriented fault [3]. Field obser-
Several reviews of the theory and applications of In-                    vations indicate more than 5 m of right-lateral slip
SAR have been published [1, 11, 12, 18]. The prin-                       along the central part of the rupture [20]. The af-
cipal advantage of InSAR over geodetic techniques                        tershock distribution [5] follows the mapped surface
relying on ground-based instrument arrays is to pro-                     break and defines a north–south alignment that lies
vide a spatially continuous view of the radar line-                      east of the northern section of the main rupture (fig-
of-sight component of the surface displacement field                     ure 1). Geodetic measurements collected at 36 sta-
over broad areas. This unique capability allows sci-                     tions of the Southern California Integrated GPS Net-
entists to measure with millimeter precision surface                     work (SCIGN) were used to constrain a uniform-
displacement features with spatial signatures rang-                      slip fault model with trace and dip consistent with
ing from a few tens of meters to 100 km. In rela-                        observed ground rupture and seismic focal mecha-
tively well-instrumented regions like Southern Cal-                      nism [7].
ifornia, InSAR is complementary to geodetic arrays
using continuously operating Global Positioning Sys-
tem (GPS) instruments at array nodes. In addition                        3. Radar data analysis
to providing accurate line of sight change measure-
ments, radar images also provide along-track ground                         The European Space Agency ERS-2 satellite im-
displacement measurements from sub-pixel correla-                        aged the area of the earthquake on September 15,
tion of amplitude images (e.g., [2, 14]). As an example                  1999, 30 days before the event, and October 20, 1999,
of application of the InSAR and the amplitude corre-                     four days after the event. The short spatial separation
lation techniques, we present here the results of the                    of ∼25 m between the ERS orbits (interferometric
study of the Mw7.1 Hector Mine, California earth-                        baseline) and the short time interval covered by this
quake of October 16, 1999. The analysis of a single                      image pair are particularly appropriate for interfero-
pair of ERS SAR images covering the earthquake al-                       metric analysis (e.g., [18]). The data were processed
lowed us to map the surface break produced by the                        into an interferogram using the JPL ROI_PAC soft-
earthquake and two components of the surface dis-                        ware. The topographic phase was removed using the
placement field over an area of 120 × 200 km2 , and                      USGS 30 m digital elevation map and the resulting
to derive a variable slip model of the static displace-                  surface displacement map was registered to a geo-
ment on the fault at depth.                                              graphic coordinate system (figure 2a). The dry envi-

                                                                                                                                     547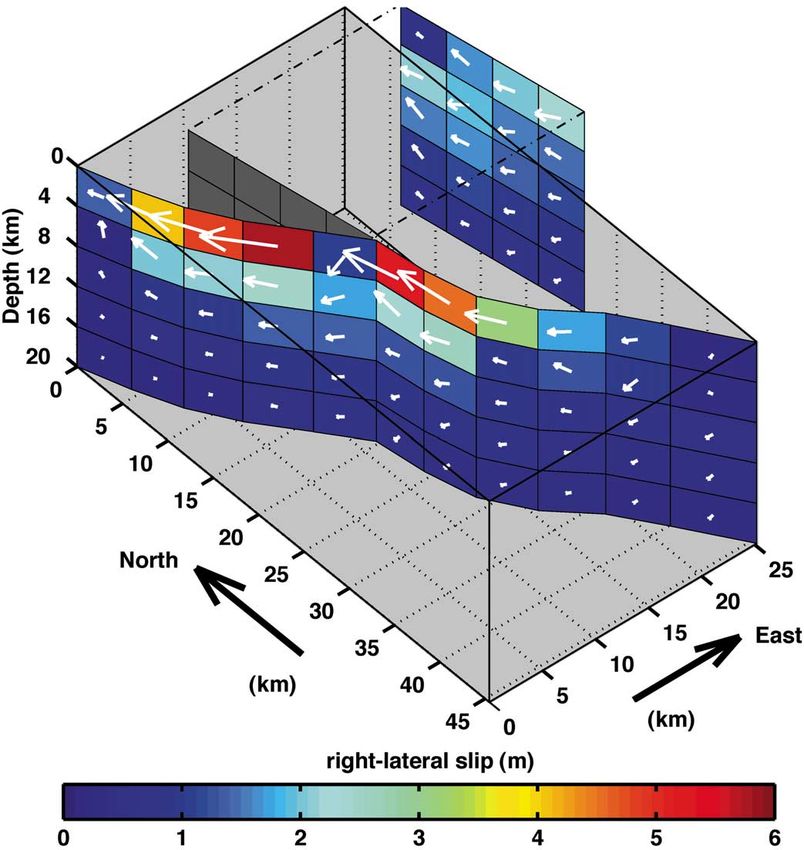
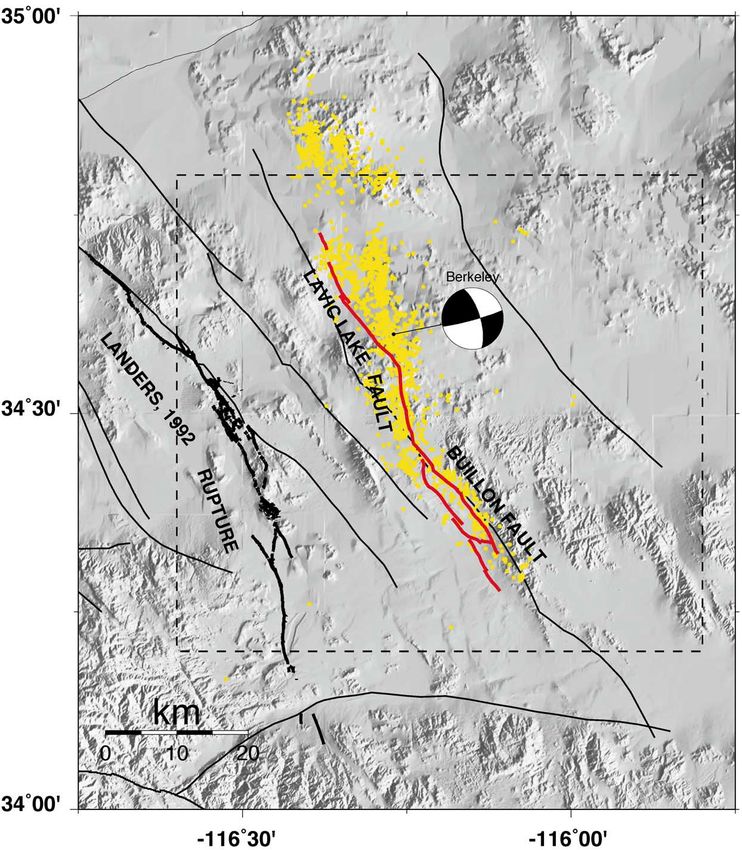
G. Peltzer et al. / C. R. Acad. Sci. Paris, Sciences de la Terre et des planètes / Earth and Planetary Sciences 333 (2001) 545–555

Figure 1. Fault map and seismicity associated with the Hector Mine earthquake. Yellow dots are relocated aftershocks [5]. Red, solid line is surface
break produced by earthquake and mapped using azimuth offsets and phase data (see text). Black, heavy line is Landers, 1992 surface break [19].
Thin, solid lines are Quaternary faults [8]. Epicenter location and focal mechanism are shown. Dashed line box indicates area covered by figures 2a
and 3a.
Figure 1. Carte de la faille et de la sismicité associées au tremblement de terre de Hector Mine. Les points jaunes sont les répliques sismiques
relocalisées [5]. Les lignes rouges représentent la rupture de surface produite par le séisme et cartée à partir des données radar (voir texte). Les lignes
noires et épaisses représentent la rupture du tremblement de terre de Landers de 1992 [19]. Les fines lignes noires sont les failles quaternaires [8].
L’épicentre et la solution focale sont représentés. La ligne en pointillés indique la zone couverte par les figures 2a et 3a.

ronment of the Mojave Desert, the short interferomet-                            ence throughout the image. Except in the vicinity of
ric baseline, and the short time interval of 35 days of                          the break, the interferometric phase was successfully
the image pair contributed to the high phase coher-                              unwrapped over the entire scene, providing an accu-

548
G. Peltzer et al. / C. R. Acad. Sci. Paris, Sciences de la Terre et des planètes / Earth and Planetary Sciences 333 (2001) 545–555

                                       (a)                                                                    (b)
Figure 2. a. Interferogram formed with ERS images acquired on September 15, 1999 and October 20, 1999 showing co-seismic displacement
produced by earthquake. Unwrapped interferometric phase is displayed here with one color cycle for 10 cm of ground shift parallel to radar line of
sight. At latitude N34◦ , ERS radar is pointing at ground from an azimuth of ∼N102◦ E and an incidence angle of 23◦ off nadir in center of imaged
swath. Origin of displacement is arbitrary and is chosen by assuming no displacement in far field. Grey areas are zones of low phase coherence that
have been masked before phase unwrapping. Solid lines represent surface breaks mapped using offset field (see text). White lines indicate location
of profiles shown in figure 2b. b. Range displacement profiles perpendicular to fault (see figure 2a for location). Black dots are observed range
displacement at image pixels within 1 km from profile axis. Gray, solid line is modeled range displacement (see text).
Figure 2. a. Interférogramme formé à partir des images ERS acquises les 15 septembre 1999 et 20 octobre 1999, montrant le déplacement co-
sismique produit par le tremblement de terre. La phase déroulée est montrée ici avec un cycle de couleur pour 10 cm de déplacement du sol dans
la ligne de visée du radar. À la latitude de 34◦ N, le radar ERS vise le sol depuis un azimut de 102◦ E et un angle d’incidence de 23◦ par rapport
au nadir au milieu de l’image. L’origine des déplacements est arbitraire et choisie en supposant un déplacement nul dans le champ lointain. Les
zones en gris sont des zones de faible cohérence, qui ont été masquées avant le déroulement de la phase. La ligne noire représente la rupture de
surface. Les lignes blanches indiquent la position des profils de la figure 2b. b. Profils de déplacement dans la ligne de visée du radar. Les points
noirs représentent les observations aux points de l’image situés dans une bande de 1 km de large le long du profil. La ligne grise est le déplacement
prédit par un modèle (voir texte).

rate measurement of the surface displacement compo-                           is determined by sub-pixel correlation of one image
nent parallel to the radar line of sight (figure 2). As ob-                   to the other. It reflects the geometric shift and distor-
served for other earthquakes associated with ground                           tions between the two images. The azimuth compo-
ruptures, phase coherence is low in the vicinity of the                       nent of the offset field is a measure of the surface dis-
surface break. This can be attributed in part to the in-                      placement component parallel to the satellite track on
tense shaking of the ground disrupting surface scat-                          the ground (figure 3). Typical noise in the offset fields
terers such as small rocks and gravels, particularly in                       in the present data is about 1/20th of the image pixel
areas of steep slope (e.g., [13]), or to the high strain                      size, which is 4 m in the azimuth direction. The error
of the rocks adjacent to the fault reducing locally the                       on the azimuth offset is of the order of 20 cm. This ap-
phase coherence [14, 15]. The lowest phase coher-                             proach is similar to the approach developed by Crip-
ence observed in the Hector Mine earthquake inter-                            pen [2] or Van Puymbroeck [21] to derive horizontal
ferogram occurs in the area of steep topography of                            displacement fields from optical images. Except in the
the Buillon Mountains, where the largest surface dis-                         area of the Buillon mountains, where it appears noisy,
placement is observed (figure 2a).                                            the azimuth-offset field is coherent in the vicinity of
   A second component of the displacement field was                           the surface break. The combination of the interfero-
obtained by computing the azimuth offset field be-                            metric phase and the azimuth offset provides us with a
tween the radar amplitude images acquired before and                          2-component surface displacement field produced by
after the earthquake. A two dimensional offset field                          the earthquake.

                                                                                                                                              549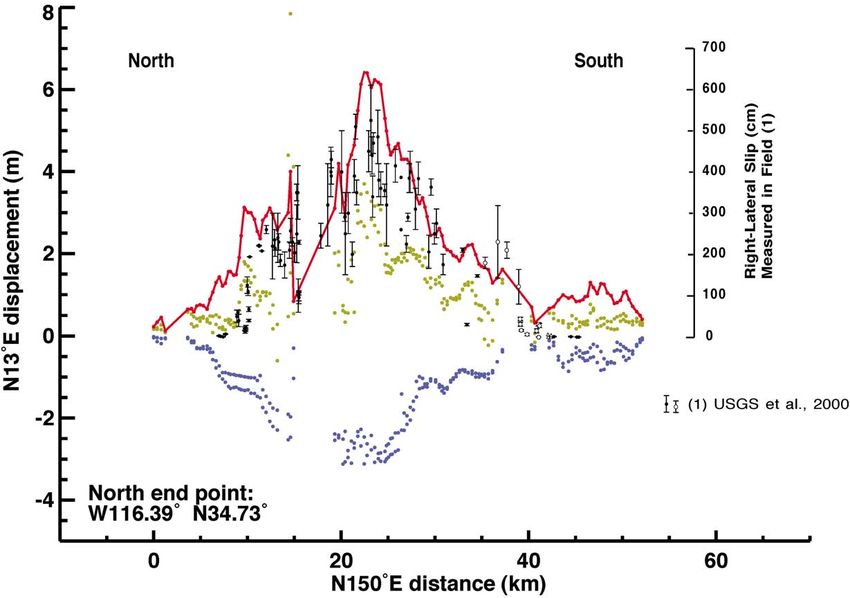
G. Peltzer et al. / C. R. Acad. Sci. Paris, Sciences de la Terre et des planètes / Earth and Planetary Sciences 333 (2001) 545–555

                                   (a)                                                                       (b)
Figure 3. a. Azimuth component of co-seismic displacement estimated from offset field. One color cycle represents 4 m of horizontal displacement
of ground parallel to satellite track direction (N13◦ E). Straight lines indicate location of profiles shown in figure 3b. b. Observed (black) and
modeled (gray) profiles of azimuth component of surface displacement (see figure 3a for location). Observed displacement at image pixels within
1 km from profile axis are represented.
Figure 3. a. Composante azimut du déplacement parallèle à la trace du satellite estimée à partir de la corrélation des images d’amplitude. Un cycle
de couleur représente 4 m de déplacement du sol. Les lignes blanches indiquent la position des profils de la figure 3b. b. Profils de la composante
en azimut du déplacement de surface observé (en noir) et modélisé (en gris).

4. Surface rupture and slip distribution                                     in the Bullion mountains and exceeds 6 m (figure 3).
                                                                             Offsets of ∼2 m are measured along the northern sec-
   Because of its coherence in the vicinity of the fault,                    tion and the southern part of the central section. The
we used the azimuth-offset field to map the surface                          main branch of the southern section shows offsets of
rupture of the earthquake (e.g., [17]). Along sections                       ∼1 m. The distribution curve of azimuth component
of the fault where the slip at the surface exceeds                           of slip is obtained by constructing two azimuth dis-
20 cm, the fault appears as a sharp discontinuity in                         placement profiles on the west and east sides of the
the offset field and can be mapped accurately (fig-                          fault (figure 4). To avoid erroneous offset measure-
ure 3). Lines of phase discontinuity observed in the                         ment near the fault where surface disruption occurred,
interferogram before phase unwrapping (not shown                             we estimate the azimuth displacement at a distance
here) also revealed secondary fault breaks where mi-                         of ∼500 m from the fault and extrapolate the esti-
nor slip occurred. This information was used to com-                         mated value up to the fault using a linear gradient
plement the rupture map near the northern and south-                         perpendicular to the fault (e.g., [17]). The displace-
ern terminations of the rupture and along the west-                          ment profiles are projected on the N150◦ E direction
ern branch of the southern section of the fault. The                         and the azimuth component of fault slip is the dif-
NNW, 50 km-long surface rupture comprises three                              ference of the west and east profiles (figure 4). For
sections: a N40◦ W, southern section following the                           a near-vertical fault the relative displacement perpen-
Bullion fault, a N10◦ W central section cutting through                      dicular to the fault is negligible and the actual strike-
the Bullion Mountains, and a northern N40◦ W sec-                            slip component of slip is obtained by scaling the az-
tion extending up to the Lavic Lake. Secondary breaks                        imuth component by the inverse of the cosine of the
are observed in the phase data west of the southern                          angle between the local strike of the fault and the
fault section but are associated with minor displace-                        satellite azimuth direction (figure 4). The slip distri-
ment, barely visible in the azimuth offset (figure 3).                       bution is bimodal, with a main moment release oc-
The maximum right-lateral surface offset is observed                         curring along the northern 40 km section of the fault.
at the northern end of the central section of the fault,                     A second area of moment release is along the south-

550
G. Peltzer et al. / C. R. Acad. Sci. Paris, Sciences de la Terre et des planètes / Earth and Planetary Sciences 333 (2001) 545–555
Figure 4. Azimuth displacement distribution profiles along west (blue) and east (green) sides of fault. Two dots, one for displacement value
estimated ∼500 m from fault and one for extrapolated value at fault (see text), are shown for each data point. Azimuth component of fault slip
distribution (relative displacement between east and west sides) is shown in red. Assuming fault parallel displacement, fault parallel component of
slip is equal to azimuth component of slip times 1/ cos α, where α is the angle between fault strike and satellite track direction (1/ cos α = 1.36 for
fault strike = N150◦ E). Black dots and error bars are right-lateral component of slip measured in the field [20]. Scale bar on right hand side is for
field measurements.
Figure 4. Profils de la distribution de déplacement en azimut le long des côtés ouest (bleu) et est (vert) de la faille. Pour chaque point de donnée,
deux points indiquent respectivement la mesure à ∼500 m de la faille et la valeur extrapolée à la faille (voir texte). Le déplacement relatif (rouge)
est obtenu par différence des courbes est et ouest. Le déplacement parallèle à la faille est égal au déplacement en azimut divisé par cos α, où α est
l’angle entre la direction de la faille et la direction de la trace du satellite (1/ cos α = 1,36 pour une direction de faille de N150◦ E). Les points noirs
et le barres d’erreur sont les déplacements dextres mesurés sur le terrain [20]. L’échelle verticale à droite correspond aux mesures de terrain.
ern 17 km-long section of the fault along which the ture must be shallow along this section. Assuming a
slip reached 1.1 m on the azimuth component profile uniform slip to a depth of 8 km and a rigidity constant
(figures 3b and 4). Along the northern part of the fault, of 3.3·1010 Nm for the upper crust, these observations
the observed slip is consistent with the slip measured imply a geodetic moment released by the main event
in the field [20], although the field observations re- of 2.6·1019 N·m−2 , consistent with seismological ob-
port a maximum slip of 5.2 m, ∼20 % less than the servations.
maximum slip observed in the radar data. Slip distrib- We note that the displacement curves on the west-
uted on multiple fault branches and local wrapping ern and eastern sides of the fault do not depict the
near the fault may explain this discrepancy. The pre- asymmetric pattern characteristic of non-linear elas-
liminary field studies do not report any slip along the ticity that was observed in the displacement field of
southernmost section of the fault where the radar data the Manyi, Tibet earthquake of 1997 [17]. The most
indicate up to 1 m of horizontal slip [20]. It is pos- likely explanation for this observation is that the sub-
sible that the rupture did not reach the surface along tle effect of the volume strain-dependent strength of
this section of the fault, producing distributed shear the upper crust was identifiable in the Manyi earth-
across a narrow zone that could not be observed in the quake surface displacement data because of the sim-
field. However, the sharpness of the displacement fea- ple linear geometry of the fault, compared to the
ture observed in the data there indicates that the rup- geometry of the Hector Mine fault. The Hector Mine
551G. Peltzer et al. / C. R. Acad. Sci. Paris, Sciences de la Terre et des planètes / Earth and Planetary Sciences 333 (2001) 545–555
fault is a complicated rupture with abrupt changes in formation near the area where the fault changes di-
strike and dip between the three sections, a geometry rection (at N34.6◦ , figure 1), internal deformation
that has a strong influence on the near-field surface seems to have occurred in the eastern block along
displacement [4], preventing the observation of more the Lavic Lake fault (figure 5). The absence of phase
subtle strain patterns such as those produced by non- coherence (figure 2) and the concentration of after-
linear elasticity. shocks [5] east of the fault also attest to distributed
deformation in this compartment, which was recog-
nized as a zone of complicated rupture by field ob-
5. Two-component surface displacement servers [20]. The azimuth displacement field shows
field a sharp gradient consistent with right-lateral shear
along a north–south trend extending the central sec-
The interferometric phase and the azimuth dis- tion of the main rupture to the north beyond the kink
placement provide two components of the surface dis- point on the fault at latitude N34.6◦ . This observa-
placement field produced by the earthquake (figure 5). tion suggests that the central section of the surface
The range component of the field is sensitive to ver- break extends at depth toward the north over a dis-
tical displacement due to the incidence angle of 23◦ tance of ∼10 km. The profile in the azimuth displace-
in the center of the radar swath, and to horizontal ment field across this zone indicates that the fault al-
displacement perpendicular to the satellite track. The most reached the surface along this trend with a slip
azimuth component of the field is the horizontal dis- of about 80 cm (figure 3b). Large range decrease ob-
placement parallel to the satellite track (N13◦ E). The served on the east side of the fault at this latitude at-
overall displacement field is consistent with a right- tests to vertical uplift (figure 2). Surface uplift there
lateral strike-slip dislocation and bears complicated may result from the abrupt change of the main fault
patterns near the fault due to its particular geome- direction at latitude 34.6◦ , implying a compressive
try. A striking feature of this displacement field is regime along the section of the main fault just north
the asymmetry between the two sides of the north- of the kink. Surface uplift east of the fault in a com-
ern section of the fault (Lavic Lake fault). As the pressive regime would imply a northeast dip of the
western block adjacent to the fault appears to have fault and a down-dip, west side down, component of
moved to the north with relatively small internal de- slip.
Figure 5. Field of range-azimuth dis-
placement vectors shown on a geographic
projection. Solid line indicates simplified
surface rupture reference.
Figure 5. Champ des vecteurs déplace-
ment à deux composantes (ligne de visée
et azimut), représentés dans une projec-
tion géographique. La ligne noire repré-
sente la rupture de surface.
552G. Peltzer et al. / C. R. Acad. Sci. Paris, Sciences de la Terre et des planètes / Earth and Planetary Sciences 333 (2001) 545–555
6. Sub-surface fault slip solution imuth directions and solves for the strike-slip and
down-dip components of the slip vector on individ-
We resolve the slip distribution at depth associated ual fault patches. The range and azimuth components
with the earthquake by inversion of both the azimuth of the displacement were weighted by the standard
and range displacement data using a singular value de- deviation values of 3 and 20 cm, respectively. The
composition approach (e.g., [10]). The fault is mod- solution shown in figure 6 was obtained by retain-
eled as a vertical dislocation buried in an elastic half- ing 48 singular values and no additional smoothing
space [16]. We adopted a simplified fault geometry constraint was applied to the solution. Comparison
based on the fault map derived from the radar data between predicted and observed displacement along
(figure 2) and divided the fault into eleven, ∼5 km- profiles perpendicular to the fault shows the overall
long patches over its entire length and five, 4 km- good performance of the inversion (figures 2b and 3b).
wide patches in the vertical dimension. An additional The largest misfits are observed near the rupture and
fault section was added along the shear trend extend- reflect the simplified fault geometry and patch size.
ing to the north the central section of the fault. To For example, excessive range displacement modeled
save computer time, the data were disseminated to west of the fault along the second profile from north
a total of 1 252 points by adjusting the local den- may be due to the fact that the fault section just north
sity of sampling to the local displacement gradient of the fault kink is modeled as a vertical fault and
throughout the scene. The inversion minimizes the not a steeply northeast-dipping fault. Misfits observed
weighted quadratic difference between the observed along the azimuth profiles in the north are probably
and modeled displacement in both the range and az- due to the crude description of the fault with a patch
Figure 6. Fault slip solu-
tion obtained by inversion
of range and azimuth dis-
placement data. Color bar in-
dicates magnitude of right-
lateral component of slip. Ar-
rows are slip vectors resolved
on each fault patch and depict
both horizontal and down-dip
components of slip of western
compartment with respect to
eastern compartment.
Figure 6. Modèle de glis-
sement sur la faille, obtenu
par inversion des données des
deux composantes de déplace-
ment. La barre de couleur in-
dique l’amplitude de la com-
posante de glissement dextre.
Les flèches sont les vecteurs
glissement résolus sur les élé-
ments de faille et indiquent
les composantes horizontale
et verticale du glissement du
compartiment ouest par rap-
port au compartiment est.
553G. Peltzer et al. / C. R. Acad. Sci. Paris, Sciences de la Terre et des planètes / Earth and Planetary Sciences 333 (2001) 545–555
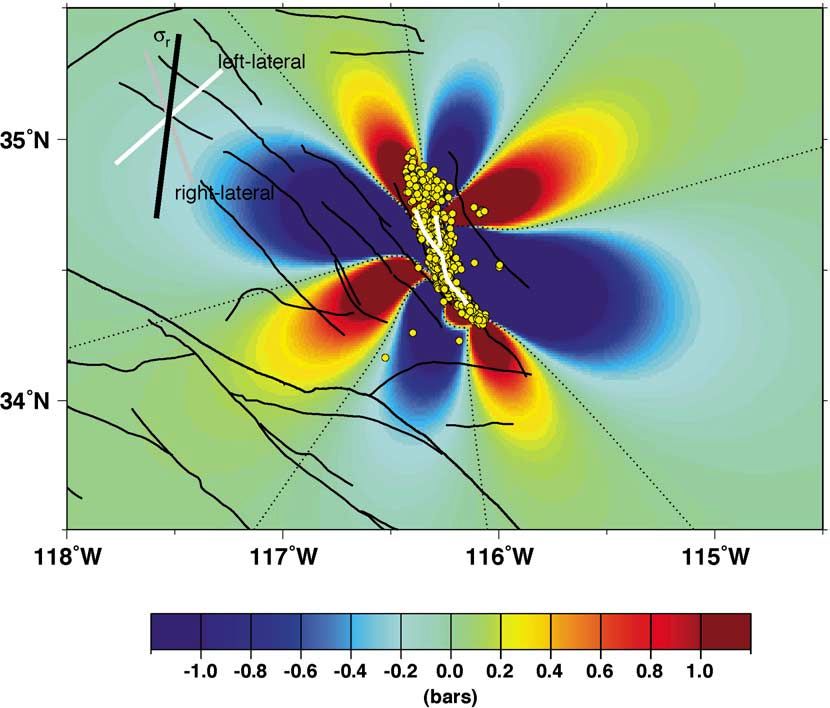
Figure 7. Coulomb stress changes caused by the
Hector Mine earthquake on optimally oriented slip
planes. Regional stress is chosen as a N7◦ E compres-
sion of 100 bar and effective friction coefficient is
0.4 [9]. Fault break is shown in white. Aftershocks [5]
are shown in yellow.
Figure 7. Changements de la contrainte de Coulomb
produits par le séisme de Hector Mine sur des plans
verticaux orientés de manière optimale. La contrainte
régionale est choisie à 100 bar et de direction N7◦ E,
la friction effective à 0,4 [9]. La rupture est représen-
tée en blanc, les répliques sismiques [5] en jaune.
size of 5 km, too coarse to account for high frequency does not compensate for the stress change produced
variations of the displacement field along the north- by the slip on the main rupture to the west. Many
ern sections of the fault. The solution indicates that of the aftershocks associated with the blind fault
most of the displacement occurred between depths of segment fall in the region of stress shadow of the
0 and 8 km on the central and northern sections of the main rupture, following a pattern not predicted by
fault, where large slip is observed at the surface. Up the Coulomb criteria [9]. It is possible that our fault
to 2.2 m of slip is resolved on the additional north– model is not well constrained in the north. A trade off
south fault branch, east of the Lavic Lake fault. The between the two northern branches of the fault or the
patches of the main fault where the right-lateral slip imposed condition of verticality of the fault plane may
exceeds 5 m correspond to the two maxima observed explain the poor prediction of the model there.
in the fault slip distribution, 13 and 23 km south of the
northern end point, respectively (figure 4). The solu- 7. Conclusion
tion is essentially strike-slip on most of the patches,
except north of the kink where the down-dip (west A single pair of ERS radar images covering the
side down) component of slip reaches 2 m. The down- Hector Mine earthquake epicentral area provided us
dip component of slip on this part of the fault is con- with a continuous view of two components of the
sistent with horizontal compression on a northeast- surface displacement field associated with the event.
dipping fault plane. These findings are in agreement The range component of the field is slanted at an angle
with the distribution of aftershocks at depth, which of 23◦ off the vertical in a direction N103◦ E, and is
defines a steeply northeast-dipping fault plane along estimated with a precision of a few millimeters from
the compressive section of the Lavic Lake fault [5]. the interferometric phase. The azimuth component of
The fault solution has been used to compute the the displacement field is horizontal, parallel to the
Coulomb stress change in the area around the fault [9]. N13◦ E direction, and estimated with a precision of
Most of the aftershocks fall in areas of Coulomb ∼20 cm from the azimuth offsets between the two
stress increase (figure 7) with a notable exception. The images. The coherence of the azimuth offset field in
swarm of aftershocks extends north of the rupture, the vicinity of the fault allowed us to map the surface
over a distance of ∼20 km. A number of them rupture over its length of ∼50 km and to determine the
occurred on and north of the blind segment of the distribution of slip along the fault at the surface. The
fault, east of the main surface break (figures 1 and 7). fault map and the slip distribution derived from the
However, the magnitude of the dextral slip that is radar data are in overall agreement with observations
resolved on this segment does not exceed 2.5 m and gathered in the field. However, the radar data imply
554G. Peltzer et al. / C. R. Acad. Sci. Paris, Sciences de la Terre et des planètes / Earth and Planetary Sciences 333 (2001) 545–555
a surface slip along the fault that is in general 10– of slip is consistent with a compressive regime on a
20 % larger than the slip measured in the field [20]. northeast dipping fault, a geometry that is suggested
This difference may be due to the fact that estimates by the aftershock distribution at depth [5].
from the radar data integrate possible distributed The rupture and surface displacement maps of the
displacement and ground wrapping in the vicinity of Hector Mine earthquake were derived from a single
the main rupture that are difficult to quantify in the pair of ERS images in the weeks following the event
field. thanks to the rapid data acquisition and distribution by
The sub-surface fault slip solution determined by the European Space Agency. The analysis presented
inversion of the two components of the displacement here as well as the recent examples of application of
field shows that slip essentially occurred between the InSAR to the study of earthquakes show the level of
surface and the depth of 8 km along the northern and precision achievable in mapping ground ruptures and
central branches of the fault. Up to 2 m of down-dip measuring surface displacement from radar images.
slip (west side down) is resolved along the northern The rapidity of data acquisition and analysis after a
branch of the fault, north of the point where the fault major event are essential to support field deployments
strike changes by ∼30◦ . Such a down-dip component and monitor short-term post-seismic processes.
Acknowledgements. The ERS data were provided by the European Space Agency. We thank J.-P. Avouac and R. Michel for insightful reviews
of the manuscript. The work described in this paper was performed in part at the Jet Propulsion Laboratory, California Institute of Technology,
under contract with NASA.
References [11] Madsen S.N., Zebker H.A., Imaging radar interferometry,
in: Principles and applications of imaging radar, Manual of remote
[1] Burgmann R., Rosen P.A., Fielding E., Synthetic aperture sensing, 2nd ed., Wiley, New York, 1999, pp. 2:359–2:380.
radar interferometry to measure Earth’s surface topography and its [12] Massonnet D., Feigl K.L., Radar interferometry and its
deformation, Annu. Rev. Planet. Sci. 28 (2000) 169–209. application to changes in the Earth’s surface, Rev. Geophys. 36 (4)
[2] Crippen R., Measuring of subresolution terrain displacements (1998) 441–500.
using SPOT panchromatic imagery, Episodes 15 (1992) 56–61. [13] Massonnet D., Rossi M., Carmona C. et al., The displacement
[3] Dreger D., Kaverina A., Seismic remote sensing for the field of the Landers earthquake mapped by radar interferometry,
earthquake source process and near-source strong shaking: a case Nature 364 (6433) (1993) 138–142.
study of the October 16, 1999 Hector Mine earthquake, Geophys.
[14] Michel R., Avouac J.-P., Taboury J., Measuring ground dis-
Res. Lett. 27 (13) (2000) 1941–1944.
placements from SAR amplitude images, application to the Landers
[4] Fialko Y., Simons M., The complete (3-D) surface displace- earthquake, Geophys. Res. Lett. 26 (1999) 875–878.
ment field in the epicentral area of the 1999, Mw 7.1, Hector
Mine earthquake from space geodetic observations, Geophys. Res. [15] Michel R., Avouac J.-P., Taboury J., Measuring near field co-
Lett. 28 (16) (2001) 3063–3066. seismic displacements from SAR images: application to the Landers
earthquake, Geophys. Res. Lett. 26 (1999) 3017–3020.
[5] Hauksson E. et al., Overview of the 10/16/1999 Mw7.1 Hector
Mine, California earthquake sequence, in: Hector Mine Earthquake [16] Okada Y., Surface deformation due to shear and tensile faults
Spec. Sess., AGU Fall Meeting, Dec. 1999. in a half-space, Bull. Seismol. Soc. Am. 75 (4) (1985) 1135–1154.
[6] Hector Mine Earthquake Geologic Working Group, Ponti D.J., [17] Peltzer G., Crampé F., King G., Evidence of nonlinear
Bryant W.A., Rockwell T.K., Kendrick K.J., Surface rupture, slip elasticity of the crust from the Mw7.6 Manyi (Tibet) earthquake,
distribution and other geological features associated with the Hector Science 286 (5438) (1999) 272–276.
Mine earthquake of 16 October, 1999, in: AGU Fall Meeting, Dec.
[18] Rosen P.A., Hensley S., Joughin I.R. et al., Synthetic aperture
1999.
radar interferometry, Proc. IEEE 88 (3) (2000) 333–382.
[7] Hurst K.J., Argus D.F., Donnellan A. et al., The coseismic
geodetic signature of the 1999 Hector Mine Earthquake, Geophys. [19] Sieh K., Jones L., Hauksson E. et al., Near-field investiga-
Res. Lett. 27 (17) (2000) 2733–2736. tion of the Landers earthquake sequence, April to July 1992, Sci-
ence 260 (5105) (1993) 171–176.
[8] Jennings X., Fault map of California, California Division of
Mines and Geology, 1974. [20] US Geological Survey, the Southern California Earthquake
[9] King G.C.P., Stein R.S., Lin J., Static stress changes and the Center, and the California Division of Mines and Geology, Prelimi-
triggering of earthquakes, Bull. Seismol. Soc. Amer. 84 (1994) 935– nary Report on the 16 October 1999 Mw7.1 Hector Mine, California
953. Earthquake, Seismol. Res. Lett. 71 (2000) 11–23.
[10] Larsen S.C., Geodetic measurement of deformation in south- [21] Van Puymbroeck N., Michel R., Binet R., Avouac J.-P.,
ern California, PhD thesis, California Institute of Technology, Taboury J., Measuring earthquakes from optical satellite images,
Pasadena, 1991, 351 p. Appl. Opt. 39 (2000) 3486–3494.
555Vous pouvez aussi lire