CHANGING OUR DIET AND AGRICULTURE TO ACHIEVE ENVIRONMENTAL AND HEALTH GOALS : THE SCENARIO AFTERRES2050 - Philippe POINTEREAU CONAMA 2020 - Salud ...
←
→
Transcription du contenu de la page
Si votre navigateur ne rend pas la page correctement, lisez s'il vous plaît le contenu de la page ci-dessous
CHANGING OUR DIET AND AGRICULTURE TO ACHIEVE
ENVIRONMENTAL AND HEALTH GOALS : THE SCENARIO
                AFTERRES2050
                              3 juin 2021

         CONAMA 2020 – Salud, medio ambiente y alimentacion

                 Philippe POINTEREAU
                                                              1
Agriculture and Food: Toward a sustainable food system

                           Change our diet

                     Change agricultural practices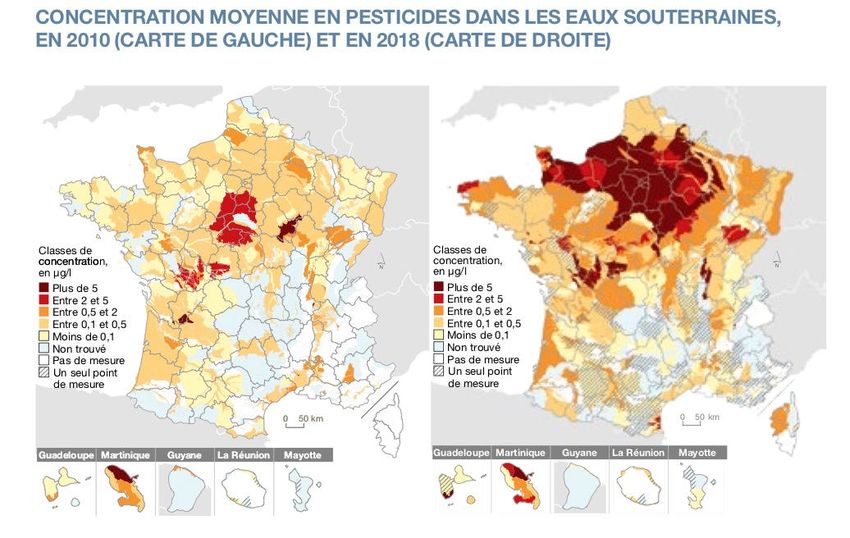
Save our farmland
                                - Loss of 73,000 ha of farmland /year
                                  between 1989 and 2017

                                - Loss of 9,000 farms per year
                                   and 7,700 full time people

                                                    Suface agricole en m2/hab
                                   9000   8300 m2
                                   8000
                                   7000
                                   6000
                                   5000                                           4419 m2
                                   4000
                                   3000
                                   2000
                                   1000
                                     0
                                            1930         1960           2017      2019

                                            - 23m2/an -55m2/an             -10m2/an
Sources TERUTi, RGP 1989-1999
Réalisation: SOLAGRO
Yield evolution in France for the main crop

                                                          2003
                                                                           2016

                             1976

                            Maïs grain    Blé tendre      Orge          Colza
Gain de rendement
                            + 1,4 qt/an   + 1,3 qt/an   + 1,0 qt/an   + 0,4 qt/an
annuel entre 1955 et 1996
Gain de rendement
                            + 0,3 qt/an   - 0,1 qt/an   + 0,2 qt/an   + 0,1 qt/an
annuel entre 1996 et 2008
Des Land                        use balance : still a positive balance
                                                           • (fig.1) : Répartition des importations et des exportations brutes en hectare par grandes catégories de denrées.
                                                           18 000 000

                                                           16 000 000

                                                           14 000 000
                                                                                                               12 690 000
                                                                                 +2,7 Mha
                                                           12 000 000

•    1.354.000 millions d’ ha de soja   Flux en hectares                          9 977 000                                                                 Boissons alcoolisées
                                                           10 000 000
•    473.000 ’ha de cacao
•    270.000 ha de coton                                                                                                                                    Céréales et fourrages
                                                            8 000 000
•    245.000 ha d’olivier                                                                                                                                   Fruits, légumes et tubercules
•    243.000 ha de caoutchouc                               6 000 000
•    162.000 ha de café                                                                                                                                     Plantes industrielles coton…

•    159.000 ha d’orange                                    4 000 000                                                                                       Stimulants (café, cacao) et épices
•    109.000 ha d’huile de palme
•    93.000 ha de riz                                       2 000 000
                                                                                                                                                            Oléo-protéagineux (soja, colza…)

•    37.000 ha de tabac
                                                                                                                                                            Animaux et produits animaux
                                                                    0
Average 2010-2016 (net balance)                                                    Imports                        Exports

                                        Concernant les produits animaux (en rouge), la France exporte plus qu’elle n’importe en équivalent surface (3,7 millions d’ha «exportés »et 2,6 millions d’ha
Sources FAO                             « importés »). Par contre en prenant en compte les importations de soja (en gris), cette balance s’inverse. La France a aussi besoin de surfaces importantes
                                        en thé, café, cacao (en orange) et fruits et légumes (en vert). Ainsi le soja représente un flux net d’importation de 1,3 million d’ha, le cacao 473 000 ha, l’olive
Réalisation: SOLAGRO                    245 000 ha, le café 161 000 ha, le coton 159 000 ha, l’orange 127 000 ha et l’huile de palme 108 000 ha.
Reduce pesticides use
            Pomme                                                                                                                                                                              33,2
             Peche                                                                                                                                        20,3
   Pomme de terre                                                                                                                             18,9
              Vigne                                                                                      13,3
            Abricot                                                                               11,9
             Prune                                                                         10,5
            Tomate                                                                        10,3
             Cerise                                                         8,4
            Carotte                                                    8,0
           Poireaux                                                   7,8
            Banane                                              6,7
              Colza                                            6,5
             Fraise
             Melon
                                                              6,4
                                                              6,3                                3,3 billions of euros cost in 2017 for farmers
 Betterave sucrière                                     5,3
         Blé tendre                                   4,9
 Pois protéagineux                               4,6
               Orge                            4,2
            Blé dur                            4,2
             Choux                        4,0
     Canne à sucre                       3,8                                                                                                                             Herbicides

             Salade                      3,7
                                                                                                                                                                         Fongicides
         Tournesol                 2,8
         Maïs grain                2,8                                                                                                                                   Insecticides

       Choux-fleurs                2,8
                                                                                                                                                                         Traitements de semences
           Triticale               2,7
     Maïs fourrage               2,4                                                                                                                                     Autres
Prairies productives       0,1

                       -                       5,00                               10,00                         15,00                           20,00            25,00   30,00                        35,00
                                                                                                                Indice de fréquence de traitement (IFT)
Pollution of water table by pesticides

2010                                                                                                   2018

       Pour 35 % de ces points de mesure, la concentration totale en pesticides dépasse la norme 0,5 μg/l pour
       le total des substances (contre 14 % en 2010)
Increase of obesity and chronic diseases in France

                            600 000
                                      Diabetes
                                       Diabètes 1 et 2

                            500 000    Cardiovascular        diseases
                                       Maladies cardiovasculaires (hors hypertension)

                                       Cancers
                                       Tumeurs malignes

                                                                                                +4%
   Nombre de nouveaux cas

                            400 000

                            300 000

                                                                   +3%
                            200 000

                                                                                        +5%
                            100 000

                                 -

Nouveaux cas d’ALD (Affection Longue Durée) , d’après la Cnam (Caisse Nationale                         18%

                                                                                                        16%
d’Assurance Maladie)
                                                                                                        14%

                                                                                                        12%

                                                                                                        10%

                                                                                                        8%

                                                                                                        6%

                                                                                              Obesity   4%

                                                                                                        2%

                                                                                                        0%
                                                                                                          1980   1985   1990   1995   2000   2005   2010   2015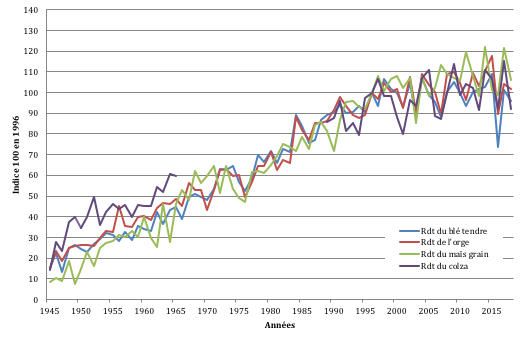
Proteins Availability
              France on the top 10 for protein consumption

                                                          Animal proteins
                                                          Vegetal proteins

            Recommended ingested proteins 50g/j    Average ingested proteins in France 83g/j

France : 62% of anima proteins versus 45% for the world.
Consumption : 1,7 more proteins than the WHO recommendations
ORGANIC FOOD CONSUMERS
            VERSUS CONVENTIONAL FOOD CONSUMERS

                              Legumes      Vegetables   Fruits      Cheese     Fast-Food   Processed meat
                              Nuts          Oils        Alcoholic   Dairy      Chicken     Ruminant
                                                        beverages   products               meats

D’après Kesse-Guyot et al, PlosOne 2013
Example of what could be changed easily • Not enough consumption of fruits, vegetables and starchy products (+90 g of fruits , +105 g of vegetables, + 10g of dry fruits/day) • To much lipids (Saturated Fatty Acids/animals products) : butter, palm oil (- 15 g of animal fat , -12g of red meat) • Too much intake of simple carbohydrates (sugar): saccharose and isoglucose (-28g of sugar) • Too much salt (- 27 g of cheese) • Not enough fer, calcium, vitamins, and fibers.
Improve our diet :
    the French National Nutrition and Health Plan (PNNS 4)

• Consume 5 serving of fruits and vegetables per day (450g)
• Some nuts every day without added salt
• Consume legumes (minimum twice per week)
• Priority to whole grains.
• Consume 2 milk products per day (3 before)
• Limit the consumption of red meat (500 g/week ) and
  charcuterie (150 g/week)
• Give the priority to vegetable products not contaminated by
  pesticides
a scénario for agriculture and food
transition for France in 2050
Déclined per region
Per local territory
For Europe
Linked with the scenario négawatt
for an exit of fossil energies and
nuclear electricity
13Change our diet Change agricultural practices A more vegetal diet: Agroecological practices (45% in organic +20% of fruits and vegetables farming) + 500% of legumes + 450.000 ha of fruits and vegetables - 48% of meat + 2 millions ha of legume crops - 43% of milk products And protect natural grasslands 14
The BioNutriNet study

•    BioNutriNet Project supported by the French Research Agency
    between 2014- 2018
•    Lead by INRA (EREN Unit) – Emmanuel Kesse-Guyot
•    29,210 participants
•    Data base DIALECTE (2,086 farms with 46% in OF)
•    Results published in American Journal of Clinical Nutrition
     (November 2018)
•    Comparison between the 2 extreme quintile (Q1 versus Q5)
•    Organic food represent 71% of the diet of the Q5 (high organic
     food consumers)
ORGANIC DIET VERSUS NON ORGANIC (N= 54 300 ADULTES)
• Une alimentation nettement plus végétale
• Une alimentation de meilleure qualité (score PNNS)
• Des apports en nutriments souvent supérieurs :
PUFA, PUFA n-3; Vit C, E, B9, B-car; Mg, Fer; Fibres
• Une probabilité de surpoids et d’obésité réduite :
(après prise en compte des autres facteurs)
• Femmes : - 42 et - 48%
• Hommes : - 38 et – 62 %
Kesse-Guyot…, Lairon, PlosOne, 2013
16Organic diet and cancers
Suivi de n= 70 192 (78% femmes, age m = 44 ans) pendant 4,6 ans sans
cancer connu au depart avec 1340 cas nouveaux identifiés
Conclusion :
« Une fréquence plus élevée de consommation d’aliments bio
est associée à une réduction du risque de cancer : -25%
« Une augmentation du score de consommation d’aliments bio de 5 pts/32
cad 15% est associée à une réduction du risque de cancer de 8%. »
Baudry et al, JAMA Int Med, 2018
e.kesse@eren.smbh.univ-paris13.frOrganic consumers reduce their land footprint
• Fruits et légumes : 218 m2 (5%)
• Céréales (pâtes et pain) : 113 m2 (2,5%)
10%
• Café, thé, chocolat: 63 m2 (1,3%)
- 23% • Vin: 35 m2
• Oléagineux: 31 m2
• Sucre: 9 m2
24% • Légumineuses: 4 m2
• Fruits et légumes : 407 m2
• Céréales (pâtes et pain) : 198 m2
• Café, thé, chocolat: 54 m2
• Vin: 35 m2
• Oléagineux: 98 m2
• Sucre: 9 m2
• Légumineuses: 20 m2Organic consumers reduce their carbon footprint
-37%
89%
19GHG EMSISSIONS FARM TO RETAILERS (SCARBOROUGH, 2013) IN TCO2E/YEAR
51,504 participants of UK EPIC-Oxford cohort study
BioNutrinet Conv (2,5t*)
BioNutrinet Organic (1,6t)
High Medium Low Fish-eaters Vegetarians Vegans
meat-eaters meat-eaters meat-eaters
(+100g/j) (99 à 50/j) (Less 50g/j)
* With the ratio of CECAM study from farm to retailersQuelle alimentation demain ? Look for the error
Thank you and the most important : friendliness and frugality
Vous pouvez aussi lire


