Direction des Études et Synthèses Économiques - G 2016 / 04 Health capacity to work at older ages in France Document de travail
←
→
Transcription du contenu de la page
Si votre navigateur ne rend pas la page correctement, lisez s'il vous plaît le contenu de la page ci-dessous
Direction des Études et Synthèses Économiques

                       G 2016 / 04

   Health capacity to work at older ages in France

               Didier BLANCHET, Eve CAROLI,
               Corinne PROST et Muriel ROGER

                    Document de travail

Institut National de la Statistique et des Études Économiques
INSTITUT NATIONAL                    DE LA      STATISTIQUE              ET DES        ÉTUDES ÉCONOMIQUES

                               Série des documents de travail
                    de la Direction des Études et Synthèses Économiques

                                               G 2016 / 04

       Health capacity to work at older ages in France

                          Didier BLANCHET*, Eve CAROLI**,
                        Corinne PROST*** et Muriel ROGER****

                                                      AVRIL 2016

    This paper is the French contribution to the seventh wave of the “International Social
    Security Project” headed at the NBER by David Wise, simultaneously published as
    NBER working paper n° 22024. We thank participants to meetings in Paris (February
    2015) and Taormina (May 2015) for their comments. The views expressed are those of
    the authors and not those of the NBER nor of their institutions.

    _____________________________________________
    *      Insee - Direction des études et synthèses économiques
    **      PSL, University Paris Dauphine, LEDa-LEGOS, Paris School of Economics and IZA
    ***     Insee-Crest
    ****   Paris School of Economics and INRA

 Département des Études Économiques - Timbre G201 - 15, bd Gabriel Péri - BP 100 - 92244 MALAKOFF CEDEX - France -
Tél. : 33 (1) 41 17 60 68 - Fax : 33 (1) 41 17 60 45 - CEDEX - E-mail : d3e-dg@insee.fr - Site Web Insee : http://www.insee.fr

  Ces documents de travail ne reflètent pas la position de l’Insee et n'engagent que leurs auteurs.
        Working papers do not reflect the position of INSEE but only their author's views.
2

           Santé et capacité de travail aux âges élevés :
                    deux méthodes d’évaluation
Résumé

L’état de santé constitue l’une des barrières possibles aux politiques de remontée de l’âge
de la retraite. Ce travail examine l’application au cas français de deux méthodes qui ont été
proposées par la littérature pour quantifier cette contrainte. Les deux méthodes évaluent un
concept de « health related work capacity » correspondant à l'écart entre les taux d'emploi
effectifs et ceux qui prévaudraient sur la base d'une relation de référence conventionnelle
entre emploi et indicateurs d'état de santé. La première méthode s’appuie sur l’évolution
historique des taux d’emploi à taux de mortalité donnés, en faisant l’hypothèse forte que
l’évolution de ces derniers est un proxy adéquat de l’évolution de l’état de santé (Milligan et
Wise, 2012). La seconde s'appuie sur le lien emploi-santé observé à un âge de référence
donné, pour divers indicateurs objectifs et subjectifs de l'état de santé : elle utilise ce lien
pour évaluer une capacité potentielle à travailler aux autres âges, à la même période (Cutler,
Meara et Richards-Shubik, 2013). Les deux méthodes suggèrent que l’état de santé ne
serait pas contraignant en moyenne, mais sous des hypothèses dont on discute les limites.
Nous montrons notamment que les résultats deviennent sensiblement différents lorsqu’on
désagrège l’approche par catégorie sociale ou niveau d’éducation. Ceci vient appuyer l’idée
que les politiques de remontée de l'âge de cessation d’activité doivent prendre en compte
l’hétérogénéité des états de santé au sein de la population. Par ailleurs, ce concept de
health related work capacity ne peut pas constituer un indicateur du degré auquel peuvent
être poursuivies les politiques de remontée des taux d’emploi, puisqu’il laisse de côté de
nombreux autres déterminants de ces taux d’emploi.

Mots-clés : Retraite, emploi des seniors, santé, mortalité

         Health capacity to work at older ages in France
Abstract

Health status is one potentially limiting barrier to policies that aim at increasing retirement
ages. This paper examines the application to France of two methods that have been
proposed in the literature for evaluating how strong is this constraint. Both methods provide
measures of a so-called « health-related additional work capacity », i.e. the gap between
effective employment rates and the ones that would prevail according to some conventional
reference relationship between employment and health status. The first method is based on
historical changes in employment rates at given mortality levels, under the strong hypothesis
that changes in mortality rates are an adequate proxy of changes in health conditions
(Milligan and Wise, 2012). The second one is based on the employment-health relationship
observed at a given reference age, using both subjective and objective measures of health
status : this relationship is used for inferring the health-related work capacity at other ages,
for the same time period (Cutler, Meara and Richards-Shubik, 2013). Both methods suggest
that health would not be constraining on the average, but under assumptions whose limits
are discussed. We show in particular that messages become different when results are
disaggregated by social groups or education. This emphasizes the idea that policies aiming
at activating any estimated additional work capacity should take into account, when possible,
the heterogeneity of health conditions in the population. Moreover, additional work capacity
cannot be a general indicator of how much more seniors should work as the methods used
here indeed leave aside many factors that determine the employment rate of older workers.

Keywords: Retirement, senior employment, health, mortality

Classification JEL : H55, I10, J26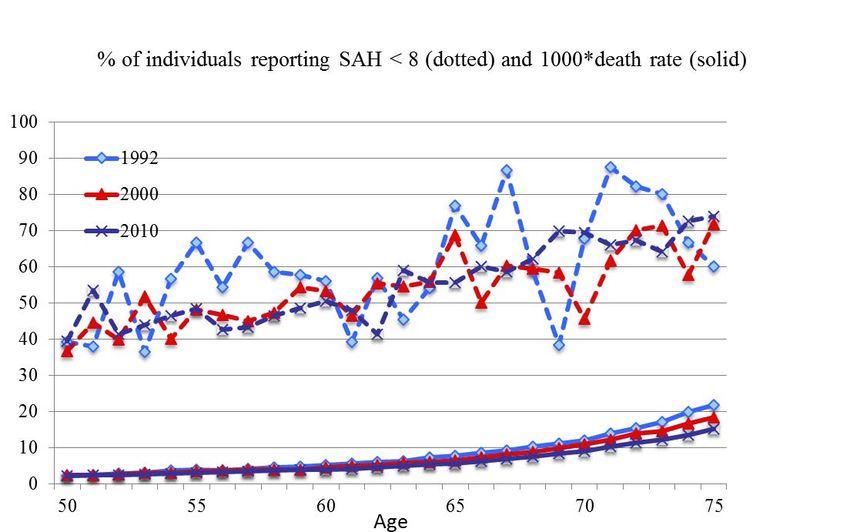
3

                                                Sommaire

Introduction .................................................................................................. 5

I - Employment rates and mortality: the Milligan-Wise approach ............ 8

II - Employment rates and self-assessed health:
implementing the Milligan-Wise approach............................................... 14

III - Simulating employment rates at older ages:
the Cutler et al. (2013) approach............................................................... 21

Conclusion.................................................................................................. 26

References.................................................................................................. 28

Appendix..................................................................................................... 29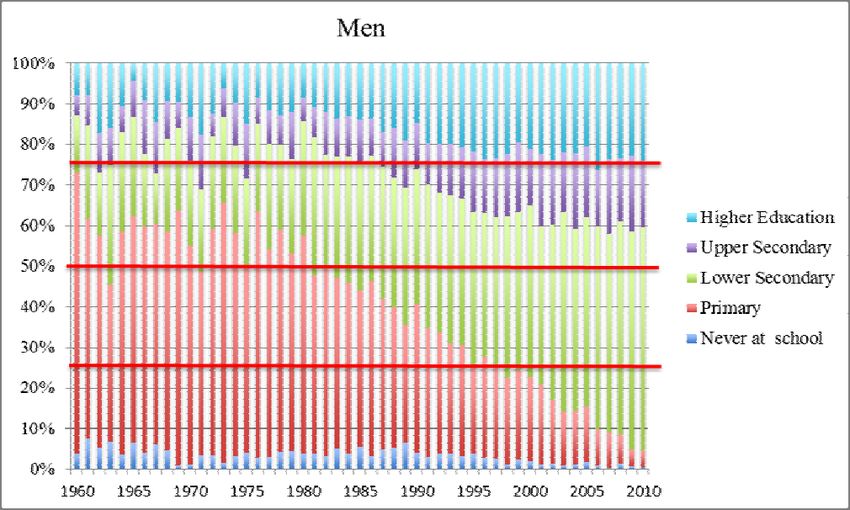
4
5
Introduction
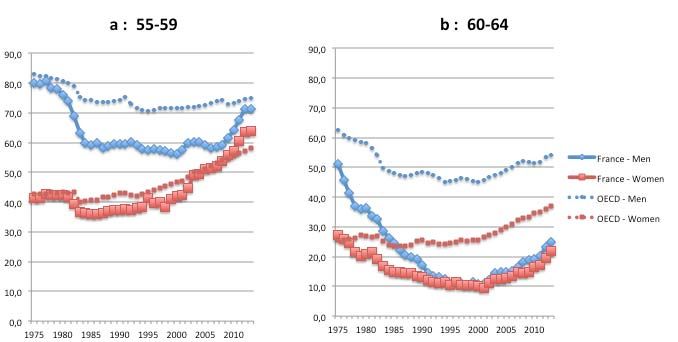
Among comparable countries, France traditionally stands out as one of those where the
labor force attachment of older workers is the lowest. This has been especially the case from
the mid-80s to the beginning of the 2000s (Figure 1). The employment rate for the 60-64 age
group was only 10% in 2000, 25 points below the OECD average, following a period of
continuous decline that had started early in the 1970s. The decrease has been more limited
for the 55-59 age group but nonetheless substantial. It has been concomitant with the shift of
the legal retirement age from 65 to 60 which took place during the first half of the 1980s and
favored a phase of rapid expansion of preretirement policies targeted to this 55-59 age
group. This expansion was rapidly interrupted, but employment rates for male workers aged
55-59 then remained as low as about 60% throughout the 1990s and the first half of the
2000s, more than 10 points below the equivalent OECD average over the period.
Yet, the long run view provided by Figure 1 also shows that low employment rates for the 55
and above cannot be seen as a constant and irreversible feature of the French labor market.
First of all because preexisting historical levels were not low at all: the decrease that
occurred until the 1990s started from initial values that, in 1975, were close to OECD
standards. And second because employment rates have entered a new ascending phase
over the last fifteen years. Concerning the 55-59 age group, the average employment rate
for both genders has already reincreased from 50% in 2000 to 66% in 2013, above its 1975
value and in line with the OECD average. Part of this trend stems from increased labor force
attachment by women of all ages, rather than from a tendency to work more at older ages.
But the movement is also very significant for men, whose employment rate has increased by
10 points since 2008, despite the adverse economic conditions. Concerning the 60-64 age
group, the change is more progressive but not less substantial: employment rates have
regained 15 percentage points, for both men and women. This is still much below the OECD
average, but the convergence is real since the trend in France is steeper than for the OECD
as a whole.
Figure 1 - Employment rates since 1975, 55-59 and 60-64 age groups
Source: INSEE and OECD, Labour Force Surveys.
A reversal is therefore undoubtedly under way, partly due to tighter preretirement policies,
and partly to the pension reforms that took place since 1993. According to the latest pension
projections published by the Conseil d’Orientation des Retraites (Pensions Advisory
Committee), if things go on as currently expected, this upward trend in employment rates
should persist over the next decades, leading by 2040 to levels close to the ones that were
observed in the early 70s.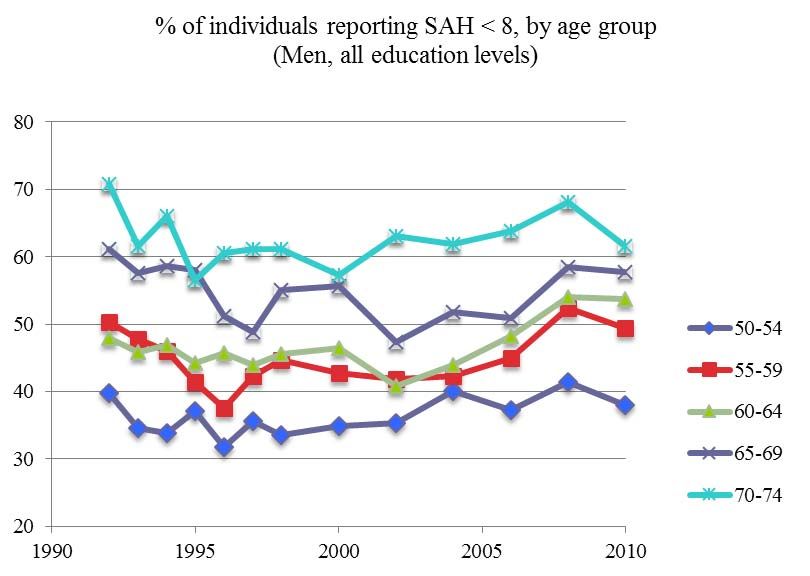
6

The fact that most of the French ageing process is driven by large gains in life expectancy
has been particularly helpful in preparing this reversal: allocating part of these gains to work
rather than to retirement has been presented by policy makers as a natural and relatively
acceptable way to contain the progression of pension expenditures. In such a context,
arguing in favor of both the possibility and the need to increase retirement ages and older
workers' employment appears to be much less necessary than it used to be some 20 years
ago. Yet some questions and doubts remain. An implicit hypothesis of all past reforms has
been that additional years of life are years spent in good health, or at least with a health
status that can be considered reasonably compatible with work. If this is not the case, the
idea of sharing these additional years of life between work and retirement becomes much
less self-evident.

There is even the view that pension reforms themselves could widen the gap between global
and healthy life expectancies, if they induce people to work at ages where work constraints
strongly deteriorate health. In other words, a question that can be asked is whether reforms
have not gone “too far” in activating the retirement age variable. Are we approaching a
“health barrier” to longer working lives that would have been too rapidly ignored by past
reforms? This question can be asked “on average” but also, and probably more interestingly,
separately by occupations or socio-professional groups, thus questioning the adequacy of
excessively uniform policies that pay too little attention to differential exposures to morbidity
or mortality risks.

To tackle these issues, we rely on two different methodological approaches currently
developed in the economic literature. Both methods and their variants aim at providing
measures of additional work capacity. This capacity may be defined as a measure of the
distance between current retirement ages and what we call the “health barrier”, i.e. the age
at which health prevents people from working longer.

We first implement the method developed by Milligan and Wise (2012), denoted thereafter
MW, using mortality as a proxy of health. These authors compute a measure of additional
work capacity for older workers (aged 55-69), based on the gap in employment rates across
time for given mortality rates. With the increase in longevity over time, the same mortality
rate corresponds to different ages at different years. We extend the standard MW method,
on the one hand, taking into account intra-generational mortality differentials and, on the
other hand, using direct indicators of health status rather than the mortality proxy.

Second, as the MW method remains highly dependent on the reference period, we complete
the study considering an alternative method, developed by Cutler, Meara and Richards-
Shubik (2013), denoted thereafter CMR, that does not require any comparison over time.
The approach becomes synchronic, using the work/health relationship measured at certain
ages to predict the health-related work capacity of older age groups at the same period of
time.

Both methods and their variants aim at providing measures of additional work capacity, i.e.
measures of the existing distance between current retirement ages and our suggested
concept of “health barrier”. However, they do not tell us by how much retirement ages should
be increased. Individual and/or social choices concerning retirement ages need to consider
many other parameters, both on the supply and the demand side of the labor market. What
is at stake here is only one very specific aspect of the global optimization problem that would
consider all these variables at the same time: it entails no message about how far policies
should go in “exploiting” the employment reserve measured by additional work capacity.
Evaluating where the health barrier is standing is one thing, making recommendations about
how close to this barrier one should come is another thing, that is clearly out of the scope of
the present paper.

Section 1 will present the application of the MW method in its original form, using long-run
series of mortality rates as proxies of health status, with an extension taking into account
intra-generational mortality differentials. This extension is made possible for France, thanks
to a long tradition of production of life tables for major socio-economic groups. Section 2 will
explore the possibility to adapt the MW method using direct indicators of health status rather
7

than the mortality proxy, relying on the Enquête Santé et Protection Sociale (ESPS)
conducted by IRDES from 1992 to 2010. The CMR method will be discussed at last in
Section 3. Section 4 will conclude with a short discussion of the limitations to increasing
retirement ages that are not covered in the present paper.
8

I - Employment rates and mortality: the Milligan-Wise approach

The Milligan-Wise methodology consists in using mortality as a proxy of health and then
compute a measure of additional work capacity for older workers (aged 55-69), based on the
gap in employment rates across time for given mortality rates. Data on mortality come from
the French Statistical Institute, INSEE. We match them with employment rates by age
computed using the French Labor Force Surveys (Enquête Emploi) over 1977-2012.

The main advantage of this approach is that the results are easily comparable across
countries since mortality and employment are defined in a consistent way across national
data. In contrast, it cannot be extended to women in a meaningful way over the period we
consider because of the large shift in female labor force participation across cohorts. So, the
focus of this section will be on men only.

Employment vs mortality over time

The starting point of the MW methodology is the observation that in all advanced countries,
both mortality and employment rates have substantially declined over the past forty years.
France is no exception to these trends with male death rates at 55, 60 and 69 going down
from 1.13% (resp. 1.67% and 3.45%) in 1977 to 0.62% (resp. 0.86% and 1.67%) in 2012.
Over the same period, employment rates of men have gone down from 90.1% at age 55
(resp. 75.1% at 60 and 15.4% at 69) in 1977 to 82.9% at age 55 (resp. 57.3% at 60 and
4.3% at 69) in 2012.

A more telling way of presenting these changes is provided on Figure 2. We graph
employment rates as a function of death rates for three different years: 1977, 1995 and
2012. For given death rates, employment has strongly decreased over time. The death rate
of individuals aged 59 in 1977 (i.e. 0.0169) was reached at about 68 years old in 2012, while
the corresponding employment rates are hugely different: 75.1% for the 59 year olds in 1977
as compared to only 4.3% for the 68 year olds in 2012. The changes that have taken place
have generated an inward shift in the mortality–employment schedule.

This suggests that if bad health conditions – as captured by mortality – were the main
obstacle to employment, older workers – aged 55 and above – could be working much more
than they actually do.

                           Figure 2 - Employment vs Mortality - Men

Measuring mortality-based work capacity

To get a precise measure of this additional work capacity, the method proceeds in the
following way: for each level of the death rate, it considers what the employment rate would
be at any year t if the relationship between employment and mortality were the same at t as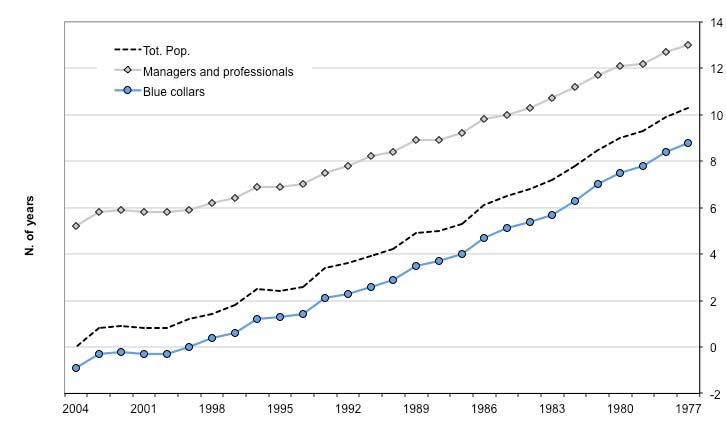
9

in a reference year – taken here to be 1977. This calculation is then cumulated over ages
55-69. This gives the number of additional years French men could have worked between 55
and 69 if the employment-mortality relationship had not changed since 1977 – see Figure 3.
The additional number of years of work computed in this way is referred to as “additional
work capacity”.

According to this calculation, the additional work capacity strongly increased from 0.4 years
in 1978 to a peak of 8.3 years in the mid-2000s. The trend started to revert in 2009 and the
additional work capacity was back to 7.7 years in 2012.

                     Figure 3 - Mortality-based additional work capacity
                   Men 55 to 69, 1978 to 2012, using 1977 as reference year

Given that we compute the additional work capacity on the basis of the gap in employment
rates between year t and a reference year, it heavily depends, by construction, on the
reference year that is chosen: the higher the employment rate in the reference year, the
higher the additional work capacity we obtain. Since employment rates have steadily
decreased in France until 2010, the additional work capacity mechanically increases with the
time distance to the reference year. For year 2012, for example, it ranges from 7.3 years if
the reference year is 1977 to -0.2 years if the reference year is 2010 – see Figure 4.

   Figure 4 – Additional work capacity for men in 2012 using 1977 to 2011 as reference years
10 The limitations of the mortality-based Milligan-Wise approach The MW estimates deliver extreme upper bounds for potential increases in labor force participation rates, i.e. evaluations of ages beyond which health limitations definitely preclude further prolongations of working lives, according to some conventional historical standards corresponding to the reference year. To interpret the results, we must bear in mind some limits of the method. The first one is that (a) it is based on a proxy of health status whose relevance is not warranted: if past declines in mortality rates have not been accompanied by equivalent declines in morbidity, the MW method will overestimate the margin that is available for increasing employment rates of older workers. A second limit (b) is the intrinsically relative character of the results: as illustrated above, they are completely dependent on the reference period used for assessing the current level of additional employment capacity. A third limit (c) is the aggregate nature of the method: it is based on average values of age-specific mortality rates, thus ignoring the strong heterogeneity of mortality risks in the population. Limit (a) will be addressed in the next section when we examine whether the MW method can be made more to the point by using true measures of health, rather than the mortality proxy. The last section of this chapter will try to overcome limit (b): the Cutler et al. (2013) method that will be used will avoid comparisons over time, replacing them by comparisons at time t across age groups. These two sections will also address limit (c), by looking at differentials in health status as observed by education level or other descriptors of socio- economic status. But a first look at the heterogeneity issue can already be provided here, without exiting the strict MW framework, thanks to the availability, for France, of mortality data by social group. Heterogeneity in mortality-based work capacity: managers and professionals vs blue-collars Disaggregating life tables according to socio-economic status has a relatively long tradition in France since first systematic attempts go back to the 60s and 70s (Calot and Febvay, 1965; Desplanques, 1976). The approach combines civil registration data with information collected at successive censuses: although civil registration data provide exact age at death, they do not contain any reliable information on social status, which can be retrieved from individual census bulletins. The first studies of this kind used one-shot ad hoc confrontations of both pieces of information. Nowadays, the Echantillon Démographique Permanent (Permanent Demographic Sample), maintained at the French Statistical Institute INSEE, systematically matches both kinds of information for a 1% representative sample of the French population. Thanks to this panel, life tables disaggregated by social group are available off-the-shelf for the following aggregate time periods 1976-1984, 1983-1991, 1991- 1998 and 2000-2008 (Blanpain and Chardon, 2011). In these data, social stratification is described using level 1 of the French socio-economic classification. We shall focus here on managers/professionals and blue collars. In 1976- 1984, life expectancies at age 35 were 41.7 years for the former group and 35.7 for the latter, i.e. a six-year gap. In 2000-2008, the corresponding figures were 47.2 and 40.9, i.e. a 6.3 year gap. At age 55, values for 1976-1984 were 23.3 and 19.2, i.e. a 4.1 year gap. For 2000-2008, they were respectively 28.4 and 23.5, i.e. a 4.9 year gap. Absolute differences are, of course, smaller at 55 than at 35 but this is only due to the fact that life expectancy decreases with age. Reevaluated in relative terms, in 2000-2008, the gap was 14% at age 35 and close to 19% at age 55. How can such a feature be incorporated into the MW framework? The procedure we propose here fully respects the general spirit of the method and does not make use of socio- economic mortality differentials for remote time periods: only data for the most recent years are sufficient. We keep the hypothesis that average mortality-employment relationships of all past periods can be used as benchmarks, and apply these successive benchmarks to mortality rates currently observed in the two social groups we consider. The counterfactual employment rates that are produced on the basis of these group-specific mortality rates are then compared to the true employment rates observed for the same groups. The period of interest is the median year of the latest time period for which differential mortality is
11

available, i.e. year 2004. More precisely, we use mortality rates for 2000-2008 as proxies of
mortality rates by social group in 2004 and, concerning employment rates, we average them
over a three-year period centered around 2004, i.e. 2003-2005.

Another option would be to compute MW additional work capacities for each of our social
groups using group-specific employment/mortality relationships. Yet this would only give a
measure of how much blue collars (resp. managers/professionals) may work considering
their own mortality and employment rates in the reference year, with little or no insight into
the differential between them. For instance, in case of perfectly parallel changes in mortality
and employment for the two groups, the result would be identical levels of additional work
capacities for both, whatever the level of cross-sectional inequality between them. Put
differently, this would consider that the differential gap in the reference year is also a
reference and can be considered as “normal”. With our methodology, we consider that the
reference is the link between employment and mortality in the average population, and this
sheds a better light on the situation of disadvantaged social groups.

The resulting additional work capacities of managers/professionals and blue-collar workers
for year 2004 are shown on Figure 5 using 1977 to 2004 as successive reference years. This
figure also replicates the previous computation for the general population, with 2004 rather
than 2012 as the new year of interest. Understanding the results in figure 5 also requires
looking at figure 6, which provides the apparent mortality-employment relationship for
managers/professionals and blue collars in 2004, as well as the same relationship for the
general population both in 2004 and 1977.

         Figure 5 - Mortality-based additional work capacities by social group in 2004
                     Men 55 to 69, using 1977 to 2004 as reference years.
12
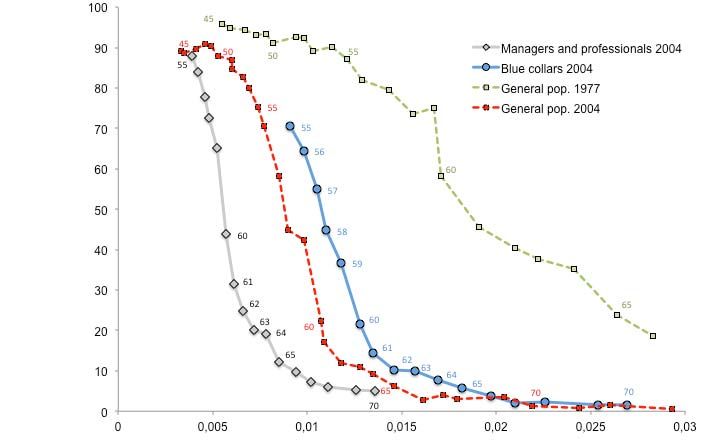
Figure 6 – Employment vs Mortality – Men
Total population, managers/professionals and blue collars
Figure 7 - Mortality-based additional work capacities by social group in 2004
Men 55 +, using 1977 to 2004 as reference years.
Results using 2004 as the reference year are instructive in that they reveal the current state
of inequalities in terms of employment-mortality relationship. If the 2004 relationship is taken
as a reference, the average additional work capacity is zero by construction, but it is as high
as +5.1 years for managers and professionalswhereas it is negative for blue collars, equal to
-0.9 years. Managers and professionalswork much less than they could do –according to the
MW convention–, while blue-collar workers work slightly longer than what they should be
asked to. Another way to look at these figures is to note that blue-collar workers aged 55 had
a rate of employment of 70% in 2003-2005, while managers and professionals at the same
age had a rate of employment of 87.9%. Over this time period, the former had a mortality
rate of 0.0091 while the latter reached this mortality rate at only 65 or 66 years old, i.e. ages
at which their employment rates were around 10%. This means that, if we consider 2004
managers and professionals as the reference group, blue-collar workers suffer from a 60
percentage-point “excess” work duration. Such considerations raise the question of
differentiating the efforts in additional years of work that could be demanded to the different
groups, in view of their current mortality levels.13 In principle, the same message should remain valid when pushing the reference year backward in the past, with parallel increases of the indicators of additional employment capacity for managers/professionals and blue collars. Figure 5 suggests that this is not the case since the additional work capacities of both groups seem to be much closer to each other when 1977 is taken as the reference year – 7.6 years and 8.9 years, respectively. However, this paradoxical result is due to an artifact generated by the way the MW method is implemented, i.e. imposing an arbitrary upper limit at 69 for the age bracket over which counterfactual employment rates are simulated. The consequence of this arbitrary limit can be understood looking at figure 6: as the method is applied here, the difference between the upper 1977 schedule and the bottom schedule for managers and professionals in 2004 is integrated only until about half way through the figure. Abandoning such a convention, the MW approach would reveal a considerable amount of additional work capacity for managers and professionals on the right-hand side of the graph. The impact of removing the 69 year- old age constraint is expected to be much more modest for blue-collar workers since, when integrating for them within this limit, we go up to values of mortality rates for which employment rates were already low – typically below 20% –in 1977. This is confirmed by figure 7, equivalent to figure 5 after removing the 69 year-old limit for computing counterfactual employment rates: an almost complete parallelism is restored between the profiles of additional work capacity for managers/professionals, blue-collar workers and the average population. Of course, this generates levels of additional work capacity for managers and professionals that look highly implausible – up to 13 years with 1977 as the reference year. It incidentally highlights a limit of the MW method. It generates estimates of additional work capacities that remain within a plausible range only thanks to the choice of an arbitrary upper age limit until which the methodology is considered valid. Mortality-based work capacity: what have we learnt? The MW approach based on mortality yields very high estimates of additional work capacity. This does not mean that all this capacity should actually be used. It only suggests that, on average, health does not appear to be a major limiting factor to the increase in labour force participation of older workers. However, one has to go beyond averages and take into account the very uneven levels of mortality rates across social groups. This point is clearly supported by the analysis carried out using the data on mortality by social status available for France. Moreover, as already underlined, mortality changes remains a very crude proxy of health changes. The next sections try to overcome this drawback.
14

II - Employment rates and self-assessed health: implementing the
      Milligan-Wise approach

This section addresses the concern that mortality could be a poor proxy of health by
considering a more direct measure of it, i.e. self-assessed health (SAH).

The data on SAH for France are provided by the ESPS (Enquête sur la Santé et la
Protection Sociale) Survey. This survey was conducted yearly from 1992 to 1997 on a rather
small sample of individuals (about 1,000 per year) and every other year from 1998 to 2010
on a larger sample (about 2,000 respondents per year). SAH is measured consistently since
1992 on a 0-10 scale and we define poor SAH as a dummy variable equal to 1 if reported
SAH scores below 8 (which corresponds to the first quartile of the distribution both for men
and women in 1992) and 0 otherwise.

Trends in SAH over time

Figure 8 (resp. 9) shows the relationship between poor SAH and age, on the one hand, and
mortality and age on the other hand for men (resp. women). Both figures provide evidence of
an age gradient in SAH and mortality, although the relationship is less smooth for SAH
because of small sample size. The proportion of men reporting poor SAH in 2010 is almost
three times as large at age 75 as at 50 – 70% as compared to 25%. Age trends are less
pronounced for women since the proportion reporting poor SAH is equivalent to men at age
75 – 70% – but is much higher at age 50 – 40%. This is consistent with the difference we
observe across gender in the age gradient in mortality, the latter being larger for men than
for women.

Yet, contrary to what we might expect – and to what is observed for mortality for men above
55 and for women above 70 –, we do not see any steady improvement in SAH over time
whatever the age group we consider– see Figures 10 and 11 below. After a decline in the
proportion of men and women reporting poor SAH in the first half of the 1990s, the trends
revert at the beginning of the 2000s and SAH appears to deteriorate for both men and
women, at least until the very last years of the decade.

                      Figure 8 – Poor SAH and Mortality – Men, by age
                                        1992-2010
15
Figure 9 - Poor SAH and Mortality – Women, by age
1992-2010
The lack of clear improvement in self-assessed health over time in our data raises the issue
of potential declaration biases. There is evidence in the literature that, when asked about
their health, individuals in various subgroups of the population use different threshold levels
to assess it, although having the same “true” health level. This gives rise to reporting
heterogeneity which varies according to the type of health outcome that is considered
(Tubeuf et al., 2008). As regards SAH, low-income and low-education individuals tend to
over-report it (Bago d'Uva et al., 2011; Etilé and Milcent, 2006; Johnston et al., 2009), while
women tend to under-report it as compared to men (Bagod'Uva et al, 2008). As regards age,
Lindeboom and van Doorslaer (2004) find that older adults are more inclined than younger
ones to report good health for a given health status. If this happens to be the case in our
data, the age-gradient evidenced in Figures 8 and 9 must be considered as a lower bound
since it is negatively affected by this declaration bias. However, in order for declaration
biases to account for the lack of improvement in SAH over time, it would have to be the case
that, within age groups, individuals tend to under-report their health status to a larger extent
than they used to in the past. This may be the case if, as health systems become more
efficient, individuals raise their health expectations. However, to our knowledge, there is no
evidence of such trend in the literature.
A competing explanation of why time trends in poor SAH do not look more downward sloping
may be that they are quite heterogeneous across social groups, with health getting better for
some groups while it may have worsened for others.16
Figure 10 - Poor SAH by age group across time – Men
1992-2010
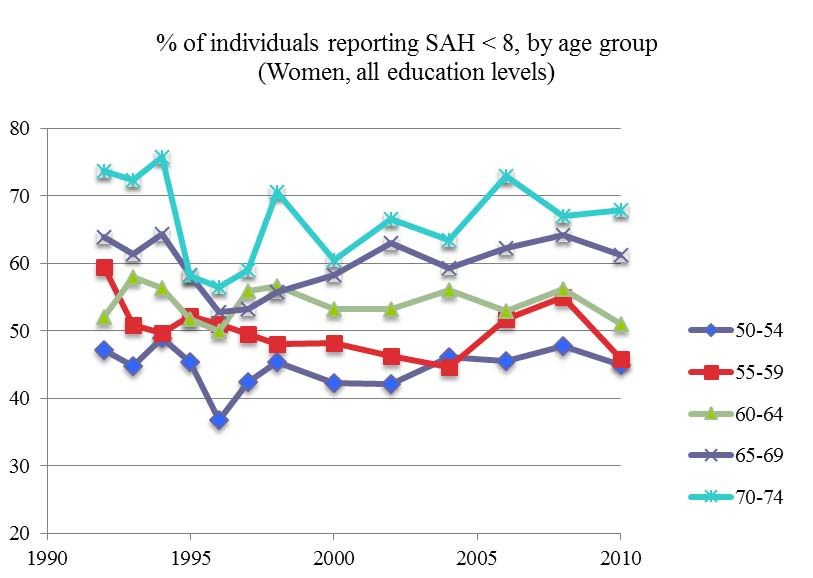
Figure 11 - Poor SAH by age group across time – Women
1992-2010
Trends in SAH by education
One of the most obvious social classification to look at is the one based on education. This
can be done using the ESPS Survey which contains information on educational levels
grouped into 5 categories until 2006 and into 8 and 9 groups in 2008 and 2010, respectively.
In order to compute meaningful changes in SAH by education level over time, we need to
take into account the upward shift that has taken place in the educational composition of the
population. One of the consequences of this shift is that low-educated workers are more
selected in recent years than they were in the past. To account for this change, we first
compute the distribution of years of education by cohort and gender – see Figures 12 and 13
for men and women, respectively; the distribution for the whole population is shown on
Appendix Figure A1.17
Figure 12 - Distribution of years of education completed by cohort - Men
(year each cohort attained age 50)
Figure 13 - Distribution of years of education completed by cohort - Women
(year each cohort attained age 50)
As can be seen on Figure 12, the proportion of men having completed at least some higher
education increased substantially between the cohorts who reached 50 in 1960 and in 2010.
The same goes for the proportion with upper secondary education and for those with lower
secondary education. In contrast, the share of men with only primary education has sharply
declined. Those who never attended school represent a small share of the cohort who
reached 50 in 2010 but it was already low for the 1960 cohort. Similar trends are observed
for women – see Figure 13 – although the proportion that attains higher education in the
2010 cohort remains slightly lower than for men.
As a second step, we sort individuals by education in each age×year cell with random
ordering of individuals within each level and define four education quartiles. Over the 40
years considered here, the educational level of the median male and female increased from
primary to lower secondary education. The first quartile did the same while the third one
moved from lower secondary education to upper secondary education.
The proportion of individuals reporting poor SAH is then computed for each single age over
50-75 in each education quartile and eventually aggregated over two time periods: 1992-
1998 and 2000-2010.18
Figure 14 - Poor SAH by education quartile– Men
1992-2010
Men - 1st educ. quartile Men - 2nd educ. quartile
100 100
80 80
60 60
1992-98 1992-98
40 2000-10 40 2000-10
20 20
0 0
50 55 60 65 70 75 50 55 60 65 70 75
Men - 3rd educ. quartile Men - 4th educ. quartile
100 100
80 80
60 60
1992-98 1992-98
40 2000-10 40 2000-10
20 20
0 0
50 55 60 65 70 75 50 55 60 65 70 75
Figure 15 - Poor SAH by education quartile– Women
1992-2010
As evidenced in Figures 14 and 15, higher-educated men and women are on average in
better health than their low-educated counterparts. This is particularly true for both men and
women in the fourth quartile of the education distribution. However, we find no evidence of a
substantial improvement in SAH over time except at very old ages – for men in the upper
half of the education distribution and for women in the first and third quartiles. This result has
to be interpreted with caution though since individuals in very bad health above 70 years old
are likely to be underrepresented in the ESPS survey if they are hosted in specialized
institutions since the latter are not included in the sample. If the proportion of unhealthy older
people in such institutions has increased over time, the group of older individuals in the19
ESPS survey is increasingly selected in terms of health, which may account for the trend
observed in our data at very old ages.
Overall, we do not see very different trends in health conditions over time within age and
education groups. So, the lack of steady improvement in self-assessed health observed in
the French data cannot be accounted for by the fact that health conditions would improve for
some groups of individuals while worsening for others, at least when these groups are
defined on the basis of education.
Additional work capacity: the Milligan-Wise approach based on SAH
We repeat the analysis carried out for employment rates and mortality using SAH. As for
mortality, we do so for men only since the strong increase in female labor force participation
would generate some confusion in the interpretation of the results. To reduce the noise in the
data, we average the information on SAH over two years when it is available yearly, so that
what is indicated as 1992 is actually computed as the average over 1992 and 1993. In
addition, we linearly adjust the age profiles of self-assessed health. The corresponding
employment-health profiles are presented in Figure 16.
We graph employment rates as a function of the proportion of individuals reporting poor SAH
for three different years: 1992, 2000 and 2010. For given shares of men in poor health,
employment rates decreased substantially between 1992 and 2000, before re-increasing
sharply in the 2000s. Whatever the share of men reporting poor SAH, employment rates are
higher in 2010 than in 2000 and in a number of cases, they are even higher than in 1992.
This suggests that the additional work capacity of men aged 55 to 69 as measured in 2010 is
likely to be very small if not negative for a large number of years. This is what is evidenced
on Figure 17.
Figure 16 - Employment vs Poor SAH - Men20
Figure 17 - SAH-based additional work capacity for men 55-69 in 2010
using 1992 to 2010 as reference years
According to the reference year, the additional employment capacity as measured in 2010
varies between 0 and -3.6 years. The only reference year for which it is positive is 2008 and,
even in this case, it amounts to less than 1 year. These results are due to the fact that over
the 1992-2010 period, employment rates varied very little and that the proportion of men
reporting poor SAH first decreased before increasing again in the second half of the period –
see Figure 10. For some age groups, it is even higher at the end than at the beginning of the
period. Given such trends, there cannot be, by construction, any positive additional work
capacity as measured in 2010.
This result is in sharp contrast with what we obtained when using mortality as a proxy of
health. As measured in 2012, the mortality-based additional work capacity varied between 0
and +3.2 years according to the choice of the reference year in the 1992-2012 range. This
gap in estimates with the SAH-based additional work capacity is due to the diverging trends
in mortality and SAH over the period: while death rates have steadily decreased, SAH
reported by men first improved before deteriorating again. One explanation for these
differences in trends is that mortality and SAH do not capture the same thing. Mortality is
actually a very peculiar measure of health. It captures the fact that individuals are still living,
rather than dead – which is, of course, positive! –, but it does not take at all into account that
individuals may be living in poor health conditions. Recent work by Sieurin et al. (2011)
suggests that, in France, male life expectancy at 50 increased by about 22% between 1999
and 2008, whereas life expectancy without functional limitations increased by only 0.6% over
the same period. When decomposing this trend for various types of limitations, they find that
although life expectancy without physical functional limitations increased over time for men
aged 50, their life expectancy without sensory and cognitive limitations actually decreased
(by 3 to 8%). If SAH reported by men partly reflects these limitations, it is no surprise that its
trend might substantially differ from that of mortality.
Overall, the results presented in Sections 2 and 3 suggest that one has to be very cautious
when considering our estimates of additional work capacity. Their magnitude much depends
indeed on the reference year that is chosen but, more importantly, their sign reverts when
considering SAH rather than mortality as the relevant measure of health because the time
trends in both variables do diverge. To overcome the problems raised by comparing different
time periods, the Cutler et al. method, used in the next section, relies on comparisons across
age groups rather than over time.21
III - Simulating employment rates at older ages: the Cutler et al. (2013)
approach
The method
The method proposed by Cutler et al. (2013) to estimate the employment capacity consists
in two steps. They first estimate individual labor force participation as a function of health for
individuals in a younger age group (57-61) and then use the estimated coefficients to
simulate what labor force participation would be for an older age group (62-64) if the health-
participation relationship remained stable across ages. The advantage of this method is that
it does not require comparing labor market outcomes and health at different points in time.
The model is estimated for one age group at one period and is used to simulate the
contemporaneous work capacity of another age group. The key assumption underlying the
method is that the impact of health on individuals' working capacity is the same in the various
age groups.
In what follows we apply the Cutler et al. method to employment rates rather than labor force
participation. We estimate employment rates separately for men and women in the 51-54
year-old group as a function of education, marital status, the type of job (employee, civil
servant, self-employed) and an indicator of health. We then simulate employment rates for
men and women and by education level separately in the 55-59, 60-64, 65-69 and 70+ age
groups. Of course, the ideal methodology would require estimating separate regressions by
education level. Unfortunately, we do not have enough observations in our data to do so.
The data
The data we use come from the French section of the Survey of Health, Ageing and
Retirement in Europe. SHARE is a panel database containing individual information on
health, socio-economic status and social and family networks for more than 85,000
individuals aged 50 and over in 19 European countries. The sample size for France is
around 3,000 households per wave. The survey was carried out in 2004, 2007, 2009, 2011
and 2013. We pool all available waves except SHARELIFE (wave 3) which has data on
individuals' life histories.
Our main health index is the same as in Behaghel et al. (2014). Its computation follows the
methodology developed by Poterba, Venti and Wise (2010, PVW) using the American Health
and Retirement Survey data. The authors assume that latent health is revealed by
responses to the long list of questions asked in the survey relative to health status and
changes in health status. The PVW health index is then defined as the first principal
component of these selected health measures. It is a weighted average of the health
indicators with weights chosen to maximize the proportion of the variance of the individual
health index that can be explained by this first principal component. This methodology has
been replicated on the 25 health questions of the SHARE questionnaire. Details on the
selected questions and the weights are provided in Behaghel et al. (2014). The index is
decomposed in percentiles with percentile 1 corresponding to the worst health status and
percentile 100 to the best. Unsurprisingly, the PVW index decreases with age – see Figure
18. It is also lower for women than for men at all ages except above 93, which is consistent
with widespread evidence in the literature according to which women report worse health
than men do even if they have longer life expectancies – see Case and Paxson (2005).
As robustness checks, we consider alternative health measures. The first set includes self-
assessed health and the subset of variables contained in the PVW index which capture the
lack of personal autonomy suffered by individuals. Self-assessed health is captured by a
dummy variable equal to 1 if individuals report that their health is either fair or poor and 0 if
they report that it is excellent, very good or good. We also include dummy variables for any22
difficulty walking, limitations in the activities of daily living1 and any limitation in instrumental
activities of daily living.2 On the graphs, all values are averaged over the four waves of
SHARE that we use. Figures A2 and A3 in the Appendix report age gradients for these
variables.
In a third model, we include a subset of health indicators corresponding to the most severe
conditions (heart problems, high blood pressure, stroke, diabetes, lung disease and cancer)
as well as arthritis to the extent that it is highly incapacitating with respect to employment.
The age gradients for these variables are provided in Figures A4 and A5 for men and
women, respectively.
Figure 18 – PVW Synthetic Health Index, by age and gender
Average values over 2004, 2007, 2011 and 2013
80
70
60
50
40
30
20
10
0
50 51 52 53 54 55 56 57 58 59 60 61 62 63 64 65 66 67 68 69 70 71 72 73 74 75 76 77 78 79 80 81 82 83 84 85 86 87 88 89 90 91 92 93 94 95
Men Women
Estimating work capacity
Results from linear regressions of employment rates on the PVW health index and our set of
control variables are presented in Table 1 below.
As expected, the PVW health index is positively correlated with employment rates for both
men and women, suggesting that individuals in better health conditions have a higher
probability of being in employment. Consistent with the evidence in the literature, we also
find that lower educated individuals are less likely to be in employment: the effect is
significant for both men and women with no diploma or only primary school, and for men with
at most lower secondary education. Other control variables are found to have a differential
impact on genders: civil-servant males have a higher probability to be in employment than
employees, whereas the effect is not significant for females. In contrast, in the 51-54 year-
old group considered here, married women are more likely to be employed than non-married
ones, which is not the case for men.
1
Limitations in the activities of daily living refer to people who need the help of others to address personal care
needs, such as eating, bathing, dressing or getting around inside their home
2
Limitations in instrumental activities of daily living refer to people who need the help of other persons in handling
routine needs, such as everyday household chores, doing necessary business, shopping, or getting around for
other purposes.23
Following the Cutler et al. (2013) methodology, we use the coefficients estimated in Table 1
to simulate employment rates for men and women in older age groups. The corresponding
results are shown in Table 2.
These estimates yield large additional work capacities on average. Considering individuals
aged 55-59, who are the most comparable to those on whom employment rates are
estimated – who are aged 51-54 – work capacity ranges between 9% and 19% for men. It
increases with the level of education except for the most educated group – those with high-
school diploma or more – whose actual employment rate is already quite high (about 80%).
This is consistent with the fact that, although low-educated workers exit the labor force
before highly-educated ones, they tend to be in worse health, thus having lower predicted
employment rates. As regards women of the same age, their additional work capacity is
much lower since they work even more than men in that age group. For women with no
diploma or only primary education, it is about 3%, even slightly negative for those with lower
secondary education and no more than 12% for those with higher secondary education. This
suggests that, in the 55-59 year-old group, there is not much room for maneuver to increase
employment rates of females.
Table 1 – Employment rates and the PVW Health Index
Men and Women aged 51-54
Dependent variable: Employment rate Men Women
Constant 0.567*** 0.553***
(0.052) (0.042)
PVW synthetichealth index 0.004*** 0.004***
(0.001) (0.000)
No diploma or primary school -0.256*** -0.109***
(0.041) (0.039)
Lower secondary education -0.230*** -0.008
(0.060) (0.042)
Higher secondary education -0.033 0.001
(0.032) (0.029)
High school diploma and above Ref Ref
- -
Employee Ref Ref
- -
Civil servant 0.092*** 0.016
(0.032) (0.029)
Self-Employed 0.061 0.056
(0.041) (0.044)
Married 0.033 0.092***
(0.030) (0.026)
Observations 713 834
R-squared 0.194 0.135
Note: standard errors in parentheses. *** p24
2013), legal retirement age was 60 in France, thus generating a spike in exit rates from
employment at this age. The results presented in this table suggest that if health were the
only limitation to the employment of senior workers, both men and women could work much
more than they actually do in the 60-65 age group.
Table 2 – Work capacity by education
Men and Women aged 55 to 70+
Age 55-59
% of individuals in employment Men Women
Estimated
Actual Predicted WC Actual Predicted Estimated WC
No diploma or primary school 49.43% 58.93% 9.50% 65.99% 69.07% 3.08%
Lower secondary education 65.06% 65.67% 0.61% 82.61% 82.41% -0.20%
Higher secondary education 65.54% 84.71% 19.17% 70.80% 82.92% 12.12%
High school diploma and above 79.50% 92.53% 13.04% 75.70% 85.93% 10.23%
Age 60-64
Men Women
Estimated
Actual Predicted WC Actual Predicted Estimated WC
No diploma or primary school 9.23% 58.61% 49.39% 18.47% 67.86% 49.39%
Lower secondary education 18.18% 65.09% 46.91% 17.71% 82.87% 65.16%
Higher secondary education 13.43% 83.37% 69.94% 19.46% 81.96% 62.51%
High school diploma and above 30.10% 91.19% 61.09% 26.30% 84.75% 58.45%
Age 65-69
Men Women
Estimated
Actual Predicted WC Actual Predicted Estimated WC
No diploma or primary school 2.42% 57.47% 55.06% 2.05% 67.67% 65.62%
Lower secondary education 4.26% 65.33% 61.07% 2.00% 81.08% 79.08%
Higher secondary education 1.39% 82.30% 80.92% 0.87% 80.60% 79.73%
High school diploma and above 6.33% 88.11% 81.78% 2.69% 82.24% 79.55%
Age +70
Men Women
Estimated
Actual Predicted WC Actual Predicted Estimated WC
No diploma or primary school 0.08% 51.62% 51.53% 0.11% 61.32% 61.21%
Lower secondary education 0.74% 54.56% 53.83% 0.72% 72.50% 71.78%
Higher secondary education 0.71% 77.09% 76.38% 1.27% 74.77% 73.50%
High school diploma and above 0.58% 83.07% 82.50% 1.07% 77.66% 76.59%
These results are robust to using alternative health measures. The first set we consider
includes poor SAH, as well as any limitation in ADL or IADL and difficulty walking. As
evidenced in Appendix Table A1, all these variables reduce the probability of being in
employment with the effect being significant at least at the 5% level – except for IADL for
women which is significant only at the 10% level. Using this specification to simulate
additional work capacity, the magnitude we get is very close to that in Table 2, although
marginally larger – see Table A2 –: it ranges from 5% to 20% (resp. 52% to 71%) for men
aged 55-59 (resp. 60-64) and from 5% to 12% (resp. 72% to 87%) for women aged 55-59
(resp. 60-64).
When using our second set of alternative health measures based on the most severe health
conditions and arthritis, the impact on employment rates gets more variable across genders
– see Table A3: women are negatively affected by strokes, diabetes, arthritis and cancer,
whereas men's employment rates are reduced by strokes, lung problems and arthritis only.
When simulating additional work capacity on this basis, the results are very similar to those
in Table 2 – see Table A4.25 As evidenced in Table 2 – and confirmed in Tables A2 and A4 – the magnitude of the work capacity estimated with the Cutler et al. method gets substantially larger as age increases. It reaches 61% to 81% for men in the 65-69 age group – according to their educational level – and 65 to 79% for women before declining slightly at older ages – but still ranging between 50% and 80% for both men and women. These figures are extremely high. Taken at face value, they suggest that health is in no way a limiting factor to increasing retirement ages for both men and women in France, whatever their educational attainment. If poorer health at old ages were the only limitation to employment, employment rates could be much higher than they actually are, even for low-skilled (low-educated) workers who have often spent a large part of their career in jobs characterized by high physical strain. The issues raised by the Cutler et al. approach The very high values of work capacity generated by our estimates, in particular at old ages – above 70 – raise a number of issues about the method. It indeed relies on two strong assumptions. The first one is that a given health problem has exactly the same impact on the probability of being in employment (or the work capacity) at all ages. This assumption does not necessarily hold for a couple of reasons. Despite the large number of questions in SHARE, the health indicators that we have are quite crude so that we are likely to mismeasure “true health”. In particular, a given reported health symptom (say arthritis) may correspond to a better or worse “true” health status according to the intensity of the pain it generates. If this intensity tends to grow over age, the same symptom will not affect the probability of being in employment in the same way across ages. A second issue has to do with the fact that the impact of a given “true” health problem may affect productivity in a different way across ages. Older workers may, in particular, be less versatile than younger ones thereby having more difficulty to develop strategies that would allow them to circumvent a temporary physical handicap. If this is the case, the direct impact of health on the probability of being in employment is not constant across ages. More specifically, if given health conditions, as we measure them, have a more negative impact on older workers than on younger ones, this will generate an upward bias in our estimates of additional work capacity, with this bias increasing as the individuals we consider get older. Of course, the simplifying assumption according to which a given health problem has exactly the same impact on the probability of being in employment (or the work capacity) at various ages is more or less acceptable according to the age gap between the group on which the estimates are run and the group for which the simulations are made. If both groups are very similar in terms of age, the assumption may be considered reasonable. If, in contrast, they are very far apart, it is unlikely to hold. This suggests that the results we obtain for individuals aged 70 and above (or even 65-69) using estimates run on individuals aged 50-54 should be interpreted with great caution. The second assumption underlying the Cutler et al. method is that there is no reverse causality from employment to health. If, in contrast, being in employment affects health and this effect varies across ages, the estimates run on the 50-54 year-old group are biased and the simulations carried out on the older age groups yield a biased measure of the work capacity at old ages. In particular, the latter will be overestimated if work negatively affects health at old ages. The literature on the health effects of retirement suggests that this may be the case. Most papers indeed find a positive impact of retirement on physical health, whereas the results are more mixed for mental health, and even negative for cognitive outcomes – see Bassanini and Caroli (2014). This reverse causality effect is hard to take into account since it would require instrumenting health levels. Nonetheless, it cannot be ruled out and calls, here again, for caution in interpreting the results. The same remark applies to the MW methodology as well.
Vous pouvez aussi lire