LA FOIRE AUX VŒUX PIEUX DE LA TRANSITION ÉNERGÉTIQUE - Michel BÉNÉZIT TOTAL - Société de Calcul Mathématique SA
←
→
Transcription du contenu de la page
Si votre navigateur ne rend pas la page correctement, lisez s'il vous plaît le contenu de la page ci-dessous
LA FOIRE AUX VŒUX PIEUX DE LA
TRANSITION ÉNERGÉTIQUE

  Michel BÉNÉZIT
  TOTAL
  Conseiller spécial auprès du Président-Directeur général
LE PETIT VADE-MECUM DU MONDE DE L'ÉNERGIE
• Pétrole
1 bbl = 42 gal = 159 l
1 BPD = 50 t/an
Contenu énergétique = 42 GJ/tep
Densité = 0,8
• Gaz
1 MMBTU = 1000 scf = 10 therm = 1 GJ
1 sm3 = 35,3 scf = 11 kWh
1000 sm3 de gaz = 1 m3 de pétrole
6 MMBTU = 1 bep
• Électricité
1 MWh = 3,6 GJ = 3,6/42 tep = 0,086 tep
En pratique : 1 MWh = 3,6x0,7/42/0,3 = 0,2 tep
20 kWh/100km 20x0,2/0,8 l/100km = 5 l/100km
• Solaire
En pratique et en France ρ = 160 kWhe/m2/an
• Éolien
En pratique et en France f = 20%
Société de Calcul Mathématique – 12 février 2015 2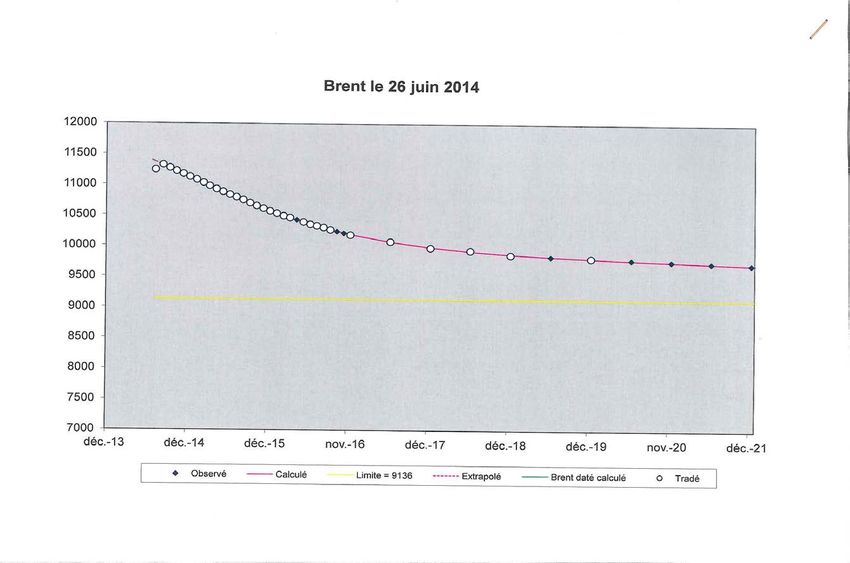
QUELQUES ORDRES DE GRANDEUR PEU CONNUS DES MEDIAS • 1 bep d’hydrocarbure de schiste 0,25 bbl d’eau de fracturation • 1 bep d’agrocarburant en Europe 2000 à 4000 bbl d’eau • 1 A/R Paris-Lyon à l’éthanol 100 l d’éthanol 250 kg de céréales, soit de quoi nourrir un africain pendant un an à raison de 2200 kcal/j • Une station service de 5000 t/an 36 ha de panneaux solaires en oubliant la question de l’indisponibilité météo aléatoire • Une centrale de 1000 MW 750 ktep/an 5400 ha de panneaux solaires sous la même réserve Société de Calcul Mathématique – 12 février 2015 3

LE PROGRÈS NOUS A FAIT PERDRE LE SENS DES RÉALITÉS

 • Un Français absorbe 2500 kcal/jour en nourriture, c'est-à-dire environ
   0,1 tep/an. Il est capable d'en restituer environ 10% (le reste étant
   nécessaire à le maintenir en vie). Par ailleurs, il consomme 5 tep/an,
   qui lui procurent donc l'énergie produite par 500 "équivalent-esclaves"
   humains. Ceux-ci lui garantissent confort et style de vie…

 • Un Indien consomme 0,5 tep/an. C'est très peu par rapport à un
   Français. Mais cela représente quand même l'équivalent de 50
   "esclaves" humains par habitant !

 • Aller à pied sans frottement de Saint-Malo (alt.=0m) au sommet du
   Mont-Blanc (alt.=4800 m) vous coûte 90 kg x 9,81 x 4800 = 4 MJ, soit
   environ 100 g de pétrole. Hors frottements, un plein d'essence de 60
   litres équivaut à 500 acensions du Mont-Blanc !

Société de Calcul Mathématique – 12 février 2015            4
LE CO2 : QUI EN ÉMET ?

Société de Calcul Mathématique – 12 février 2015   5
LE CO2 : QUI EN ÉMET ?

Société de Calcul Mathématique – 12 février 2015   6
LE CO2 : UN POINT DE VUE ÉCONOMIQUE

Société de Calcul Mathématique – 12 février 2015   7
LE CO2 : UN POINT DE VUE ÉCONOMIQUE

Société de Calcul Mathématique – 12 février 2015   8
LE CO2 : UN POINT DE VUE ÉGALITARISTE

Société de Calcul Mathématique – 12 février 2015   9
LE CO2 : UN POINT DE VUE ÉGALITARISTE

Société de Calcul Mathématique – 12 février 2015   10
LA DEMANDE D’ÉNERGIE DE LA PLANÈTE VA CONTINUER À CROÎTRE

 • Croissance démographique :                      + 1% / an (Europe : +0,1% / an)

 • GDP / habitant :                                + x% / an

 • Efficacité énergétique :                        - y% / an

 • Demande d’énergie primaire :                    + 1,5% / an ("Fil de l’eau")

                                                   + 1,1% / an ("Nouvelles politiques")

                                                   + 0,6% / an ("450 ppm")

                                                                         (Source : AIE)

      Selon l’AIE, il faudra 35% d’énergie primaire supplémentaire d’ici 2035.

Société de Calcul Mathématique – 12 février 2015                          11
ENERGY DEMAND GROWS
Increasing
population + Economic
development = Growing energy
demand
+1.1%
10 200 400 per year
Billions
Billions G$ PPA 2012
Mboe/d
+1.9%
8 per year
150 300
6 Other non OECD
Other non OECD Other non OECD
100 200
4
China+India
China+India China+India
50 100
2
OECD
OECD OECD
0 0 0
1990 2000 2010 2020 2030 1990 2000 2010 2020 2030 1990 2000 2010 2020 2030
Source: Total
Société de Calcul Mathématique – 12 février 2015 12ENERGY MIX CHANGES VERY SLOWLY
Mboe/d 6% Solar, wind, others
2% 3% Hydro
300 3% Biomass
11%
10%
1% 6% Nuclear
2% 5%
10%
6% 21% Coal
200 25%
27%
25% Gas
24%
100
22%
28% Oil
31%
32%
0
2010 2020 2035
Société de Calcul Mathématique – 12 février 2015 13QUATRE (QUASI) CERTITUDES
• La croissance ne va pas s’arrêter.
• Les pays émergents vont donner le tempo.
• Les énergies fossiles vont rester très largement dominantes.
• Les pauvres vont rester pauvres.
La transition risque de ne décoiffer personne.
Société de Calcul Mathématique – 12 février 2015 14CHANGING DYNAMICS OF GLOBAL DEMAND
Energy demand by fuel
OECD Non-OECD
2 500 4 000
Coal
Mtoe
Mtoe
2 000
3 000
Oil Oil
Coal
Gas Gas
1 500
Gas Oil
Oil Renewables
2 000
Renewables
1 000
Gas
Coal
Renewables
Nuclear Coal
1 000
Nuclear
500
Nuclear
Renewables
Nuclear
1990 2000 2010 2020 2030 2040 1990 2000 2010 2020 2030 2040
A flat demand in OECD disguise a fast changing energy mix,
while developing countries thirst for energy is agnostic
Société de Calcul Mathématique – 12 février 2015 15QUATRE (QUASI) CERTITUDES EN CHIFFRES
Primary Energy 2000 2010 2035 2035 2035
New P Current P 450 ppm
Demand (Gtep) 10 12,7 17,2 18,7 14,8
% fossil fuels 80% 81% 75% 80% 63%
% non OECD 45% 55% 65% 66% 63%
Temperature impact + 3,6°C ? + 5,3°C ? + 2°C ?
(source : IEA 2012)
Demand 2010 2035
(tep/capita) New P
World 1,9 2,0
US 7,0 5,8
France 3,9 3,1
China 2,1 3,0
India 0,5 1,0
(source : IEA 2012, Total)
Société de Calcul Mathématique – 12 février 2015 16LA CHINE "DROGUÉE" AU CHARBON
Global coal demand by key region
Mtce 7 000
World
6 000
Other
5 000
India
4 000
Chinese coal demand plateau
3 000
China
2 000
India: 2nd largest coal consumer
2005: US coal demandbypeak
1987: European coal demand peak
2020
1 000
India United States
Europe
1980 1990 2000 2010 2020 2030 2040
Global coal demand growth slows rapidly due to more stringent environmental policies, underlining the importance of high-efficiency plant & CCS to coal’s future
Société de Calcul Mathématique – 12 février 2015 17NUCLEAR CAPACITY'S GROWTH
Net capacity change in key regions, 2013-2040
China
India
Russia
United States
Japan
European Union
-20 0 20 40 60 80 100 120 140
GW
Source : AIE
Société de Calcul Mathématique – 12 février 2015 18LE RÔLE DÉCISIF DE LA CHINE (2010 – 2035)
• 33% de l’augmentation de la demande mondiale (Pétrole : 50%,
Charbon : 50%, Gaz : 25%, Nucléaire : 60%)
• Besoins en énergie : + 60%
• Besoins en énergie : 1,8 x USA en 2035 (0,5 x USA par habitant)
Société de Calcul Mathématique – 12 février 2015 19
(Source : AIE)LE BOOM DES ÉNERGIES RENOUVELABLES
• Production électrique (hors hydro) : x3
• Biofuels : x 3 (4,5 MMBPD en 2035)
(Source : AIE)
Trois fois presque rien = Pas grand chose
Société de Calcul Mathématique – 12 février 2015 20LE MIX ENERGETIQUE MONDIAL (AUTRE PRÉSENTATION)
100% Solaire, éolien, autres
Hydro
Biomasse
75% Nucléaire
Charbon
Gaz
50% Pétrole
81%
76% 74%
25%
0%
2010 2035 (AIE) 2035 (Total)
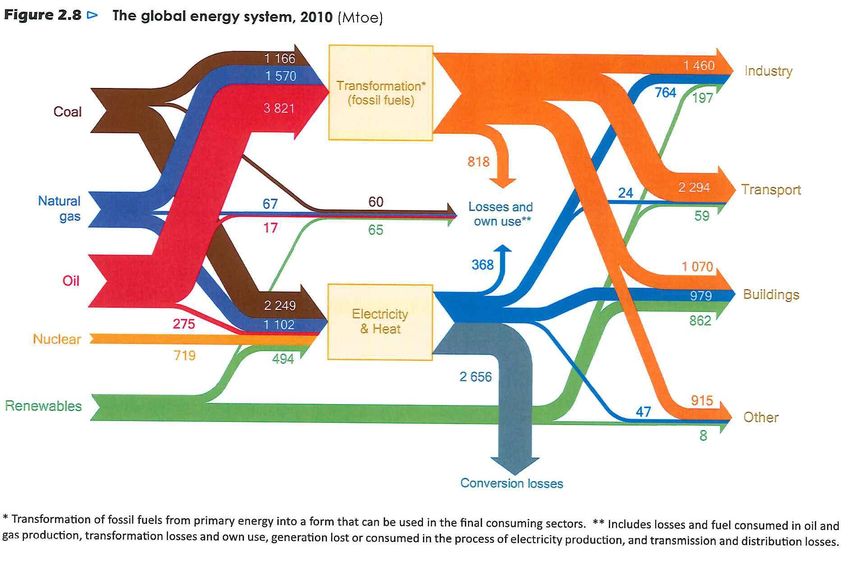
Société de Calcul Mathématique – 12 février 2015 21THE GLOBAL ENERGY SYSTEM, 2010
Source : IEA 2012
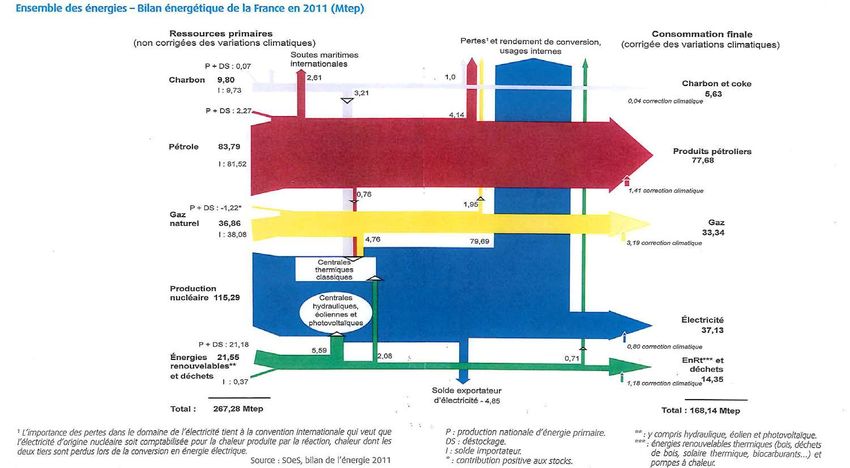
Société de Calcul Mathématique – 12 février 2015 22ENSEMBLE DES ÉNERGIES – BILAN ENERGETIQUE DE LA FRANCE
EN 2011 (Mtep)
Source : MEDDE
Société de Calcul Mathématique – 12 février 2015 23STRONG OIL MARKET FUNDAMENTALS
STILL A STRONG NEED FOR CONVENTIONAL OIL
Oil supply-demand New supply by technology
Mb/d
Oil demand
100 +0.6% / year Tight oil
Extra heavy oil
Deep offshore
~55 Mb/d
50
Conventional
Natural decline of fields (including EOR)
~4-5%/y on average
Spare
capacity 4% 5-6% 4%
2010 2015 2020 2025 2030
Société de Calcul Mathématique – 12 février 2015 24INSTABILITY IN THE MIDDLE EAST IS A MAJOR RISK TO OIL MARKETS
mb/d +15
Increase to 2040: 14 mb/d
+10
Middle East
Increase to 2040:
14 mb/d
+5
Brazil
2013 2015 2020 2030 2040 Canada
United States
Net decline in output from other producers
-5
2013 2015 2020 2030 2040
The short-term picture of a well-supplied market should not obscure future risks as demand rises to 104 mb/d & reliance grows on Iraq & the rest of the Middle East
Société de Calcul Mathématique – 12 février 2015 25LNG, FASTEST GROWING GAS SEGMENT
LNG demand increasing at 5% per year
Mt/y
600
500 LNG share in gas markets
increasing from 11% to 16%
400 2012-30
300 Sanctioned projects offsetting
decline
200
North America to become
new LNG export region
100
0
2000 2010 2020 2030
Estimated demand Sanctioned projects
Potential projects Existing supply
Attractive long-term price structure required for potential projects
Société de Calcul Mathématique – 12 février 2015 26STRONG VOLATILITY IN OIL PRICES
$2014/bbl Brent price
Dated Brent at 144,2 $/bbl
140
on 3/7/2008 Arabian
Spring
2nd shock with the Iranian
120
revolution and the Iran-Iraq war
100
Struggle for market
80 share within the
Low levels of
OPEC countries
spare production Fall 2014
1st oil shock Invasion of capacity
60
Kuwait available
40
Dated Brent at
20 36,6 $/bbl on
31/12/2008
0
1970 1975 1980 1985 1990 1995 2000 2005 2010
Geopolitics, economics and resources availability
play a key role in building oil prices
Sources : IEA, US BLS
27
Société de Calcul Mathématique – 12 février 2015 27O&G IS HIGH-TECH AND HIGHLY CAPITAL INTENSIVE!
Estimated break-even price in 2012 (IRR > 10%)
Marginal projects Arctic
Oil shales
$/b
Extra heavy oil
100
Enhanced
Tight Oil
150 Brent $/b
Recovery
Ultra deep water 130
Deep Water
110
50 Other Conventional 90
OPEC Middle East 70
50
30
0
0 1000 2000 3000
Sources: IEA, CERA, Total
Resources (Bbbl)
Increase in technical complexity
Current environment supports the development of resources
Sources: IEA, CERA, Total that are needed to balance supply & demand
Société de Calcul Mathématique – 12 février 2015 28WHAT IS THE NECESSARY OIL PRICE LEVEL TO BALANCE
BUDGETS?
Estimated budget breakeven for
selected current oil producers
Post Arab Spring environment = Higher price objectives for OPEC
Source: IEA WEO 2011
Société de Calcul Mathématique – 12 février 2015 29WHAT IS THE NECESSARY OIL PRICE LEVEL TO BALANCE THE
LONG TERM MARKET ?
Données : ICE
Société de Calcul Mathématique – 12 février 2015 30WHAT IS THE NECESSARY OIL PRICE LEVEL TO BALANCE THE
LONG TERM MARKET ?
Données : ICE
Société de Calcul Mathématique – 12 février 2015 31LA CONTRAINTE FORTE MAIS MÉCONNUE DU RAFFINAGE
Une raffinerie est un outil qui trie les molécules, puis les modifie un peu. Elle
sait aussi les casser, mais sauf exception, elle est incapable de les coller : en
termes techniques, le craquage est possible, mais hélas pas l’oligomérisation.
Produits pétroliers Nombre d’atomes de carbone des
molécules constituantes
Méthane (gaz naturel) 1
Butane (GPL) 4
Essence 4-12
Gazole 10-24
Fiouls et fiouls lourds 20-300
Bitumes 40-300
Société de Calcul Mathématique – 12 février 2015 32LE RAFFINAGE FRANÇAIS ÉTRANGLÉ PAR LES EXCÉDENTS
D'ESSENCE
• Le rendement en essence d'une raffinerie, même moderne, ne peut être réduit
substantiellement en deçà de 20%.
• En raison d'un biais fiscal historique, la France ne consomme que les deux tiers de sa
production fatale d'essence.
• Le débouché US n'existe pratiquement plus depuis que le gaz de schiste a redonné de
la vigueur au raffinage américain.
• L'impossibilité de placer ses essences va contraindre le raffinage français à poursuivre
la réduction de ses capacités.
MOINS DE RAFFINAGE DOMESTIQUE → MOINS DE FLEXIBILITÉ LOGISTIQUE
→ DÉPENDANCE EXTÉRIEURE ACCRUE
Société de Calcul Mathématique – 12 février 2015 33PAS D'APPROVISIONNEMENT PÉTROLIER RÉGULIER SANS MER
LIBRE ET SÛRE
• 30% de la production mondiale de pétrole vient de l'offshore (TOTAL : 50% à partir
d'environ 700 plates-formes et 8 FPSO).
• Un potentiel d'exploration important : marges abruptes, arctique, très grands fonds.
• Des techniques d'exploitation en progrès constant.
• L'essor du gaz naturel liquéfié, toujours transporté par la mer.
• Le pétrole : 40% du tonnage transporté par voie maritime (TOTAL : 130 millions de
tonnes/an, soit le double des besoins français).
LA SÛRETÉ DES MERS EST DEVENUE UN SUJET DE PRÉOCCUPATION POUR
L'INDUSTRIE PÉTROLIÈRE
Société de Calcul Mathématique – 12 février 2015 34MERCI POUR VOTRE ATTENTION Michel BÉNÉZIT TOTAL Conseiller spécial auprès du Président-Directeur général
Vous pouvez aussi lire