NORWAY'S FAIR SHARE OF MEETING THE PARIS AGREEMENT - Kirkens Nødhjelp
←
→
Transcription du contenu de la page
Si votre navigateur ne rend pas la page correctement, lisez s'il vous plaît le contenu de la page ci-dessous
NORWAY’S FAIR SHARE
OF MEETING THE PARIS AGREEMENT
CONTENTS
Foreword (Norwegian).............................................................................................................................. 5
Summary (Norwegian).............................................................................................................................. 7
1. INTRODUCTION .................................................................................................................................... 9
2. THE CONVENTION’S CORE EQUITY PRINCIPLES ............................................................................. 13
3. WHAT IS NORWAY’S SHARE? ............................................................................................................. 15
4. INTERNATIONAL COMPARISON......................................................................................................... 17
5. THE DUAL NATURE OF NORWAY’S FAIR SHARE: domestic effort & international support............. 18
6. CONCLUSION...................................................................................................................................... 23
References.............................................................................................................................................. 25
Study for Norwegian Church Aid, Stockholm Environment Institute,
Rainforest Foundation Norway, Friends of the Earth Norway (NNV)
and the Norwegian Forum for Development and Environment (ForUM)
By Sivan Kartha, Christian Holz, and Tom Athanasiou, 2018
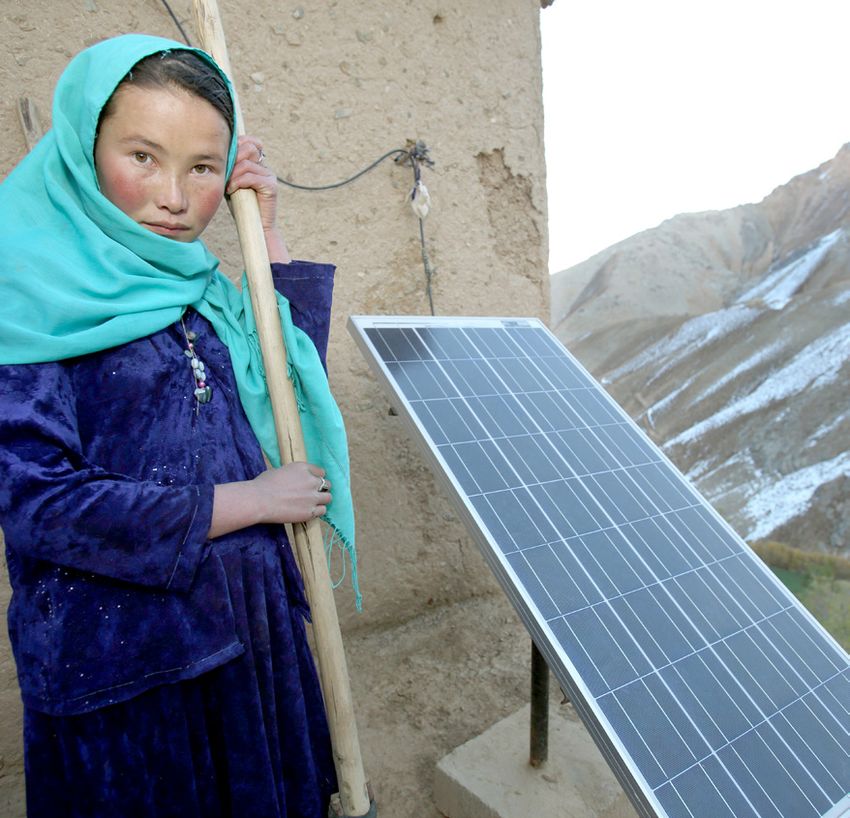
Front page photo: Solar panels in Timbuktu, Mali.
Photo: Greg Roland Buick/Norwegian Church Aid.
2 3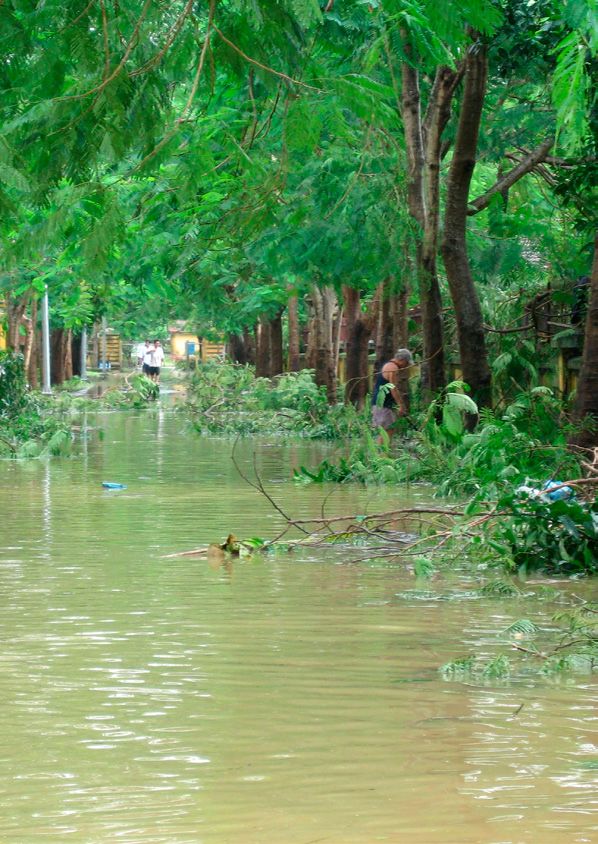
FORORD
                                               Mange fikk øynene opp for klimaendringenes dødelige konsekvenser i 2017. Samtidig som orkanene i Karibia skapte store
                                               overskrifter, gikk verden gjennom utallige andre klimarelaterte katastrofer det samme året. Sørøst-Asia opplevde en
                                               flom som rammet 40 millioner mennesker. Det er et omfang det er vanskelig å forstå de fulle konsekvensene av. I tillegg
                                               så vi en tørke i Øst-Afrika som gjorde 20 millioner mennesker avhengig av nødhjelp, og som ble omtalt som den verste
                                               humanitære katastrofen i FNs historie. Sierra Leone, Kongo, Nepal, India, USA, Australia og mange land i Sør-Europa ble
                                               også rammet av en rekke ulike klimarelaterte katastrofer.

                                               Og det er én ting går igjen: Det er normalt de fattigste og mest marginaliserte menneskene som er mest utsatt, og som
                                               blir hardest rammet, til tross for at verdens rike land i all hovedsak står bak klimaendringene. Denne urettferdigheten er
                                               uholdbar. Spørsmålene vi da sitter med, er: «Hva er Norges ansvar?» og «Hvor stor del av løsningen er det rettferdig at
                                               Norge bidrar med?». Med denne rapporten ønsker vi å bidra til å svare på disse vanskelige og kompliserte spørsmålene.

                                               For å gi et svar bruker denne rapporten et rammeverk som tar utgangspunkt i hvor mye klimagasser ulike land har
                                               sluppet ut fram til nå, og hvor stor økonomisk kapasitet de har til å bidra med løsningene på klimakrisen. Ut ifra disse to
                                               kriteriene kan vi regne på Norges rettferdige andel av den globale klimainnsatsen. Norge bidrar med en del gode tiltak
                                               med god klimaeffekt, men som rapporten viser, både kan vi og må vi gjøre langt mer. Konklusjonene tilsier at Norge har
                                               et mye større ansvar enn hva vår befolkning skulle tilsi, og at Norge i dag gjør altfor lite.

                                               Norge har kun 0,07 prosent av verdens befolkning. Rapporten kommer derimot fram til at vi må bidra med kutt av klima-
                                               gassutslippene tilsvarende 0,65 prosent av verdens totale kutt. Med andre ord har vi et ansvar som er nesten ti ganger
                                               større enn folketallet vårt skulle tilsi.

                                               Norges utslipp av klimagasser har økt med 3 prosent siden 1990. Til sammenligning har Sverige kuttet mer enn 25
                                               prosent av sine utslipp over den samme tidsperioden. Denne rapporten slår derimot fast at vårt ansvar er så stort at det
                                               overgår det vi har mulighet til å kutte på hjemmebane. Norge er derfor nødt til å finansiere store utslippskutt i land som
                                               har mindre ansvar for klimakrisen enn hva vi selv har, i tillegg til å kutte raskt i våre egne utslipp.

                                               For at Norge skal ta sin rettferdige andel av den nødvendige innsatsen, kreves en langt mer ambisiøs norsk klimapolitikk
                                               enn den vi fører i dag. De fire undertegnede organisasjonene utfordrer derfor den norske regjeringen til å ta initiativ til
                                               langt høyere utslippskutt i Norge. Rapporten skisserer at et mål om minst 53 prosent kutt innen 2030 vil være et viktig
                                               bidrag. I tillegg må Norge bevilge betydelig mer til finansiering av både utslippskutt og klimatilpasning i andre land. Rap-
                                               porten anslår opp mot 50 milliarder kroner i året til globale utslippskutt og 15 milliarder til tilpasning. På den måten kan
                                               Norge gi et rettferdig bidrag til den globale løsningen.

                                               Det er fortsatt mulig å holde den globale oppvarmingen til 1,5°C. Denne muligheten er derimot borte om bare noen få år.
                                               Vi, med vår rikdom, har en unik mulighet til å ta vår rettferdige andel. Norske politikere må være sitt ansvar bevisst og
                                               handle deretter.

                                                                     Lisa Sivertsen                                                  Øyvind Eggen
                                                              konstituert generalsekretær                                             daglig leder
                                                                   Kirkens Nødhjelp                                                 Regnskogfondet

                                                              Borghild Tønnessen-Krokan                                           Silje Ask Lundberg
                                                                      daglig leder                                                        leder
                                                              Forum for utvikling og miljø                                        Naturvernforbundet
    Flodding in Vietnam.
    Photo: Ingunn Gihle/Norwegian Church Aid

4                                                                                                                                                                             5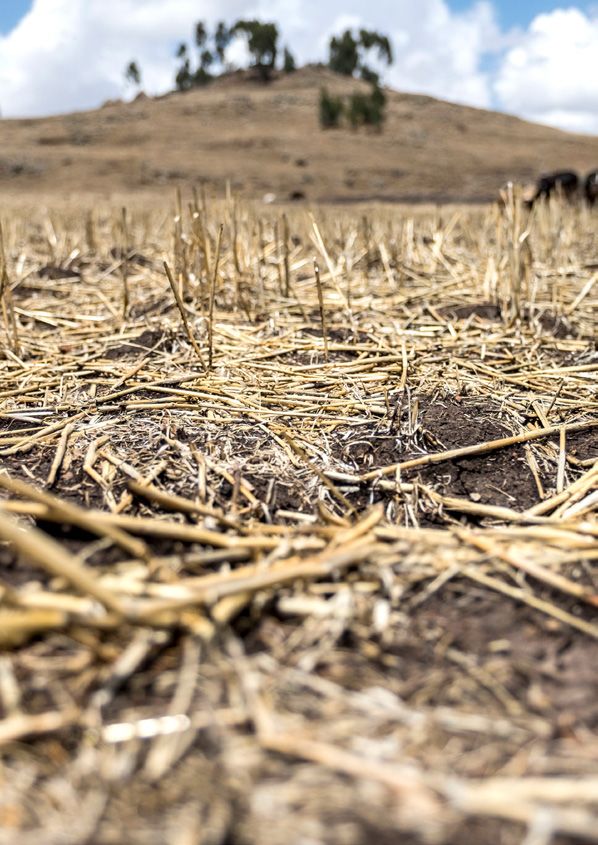
SAMMENDRAG
Hovedresultater
Norges totale ansvar for utslippskutt innen 2030,
430 %
sammenlignet med 1990-nivå
Norges minimum nasjonale utslippskutt innen 2030,
53 %
sammenlignet med 1990-nivå
Norges andel av klimafinansiering til internasjonale
50 milliarder kroner i året
utslippskutt
Norges andel av klimafinansiering til klimatilpasning 15 milliarder kroner i året
Rapporten «Norway’s Fair Share of meeting the Paris en måte å operasjonalisere disse prinsippene på som tar
agreement» presenterer en utredning av hva som er Norges hensyn til at en rettferdig løsning på klimaproblemet også
rettferdige andel av de globale utslippskuttene som er må gi rom til utvikling for verdens fattige.
nødvendige for å begrense global oppvarming til 1,5°C over
førindustrielt nivå. I tillegg beregner rapporten Norges rett- Målet om maksimalt 1,5°C global oppvarming er lagt til
ferdige andel av kostnadene for at utviklingsland skal få grunn fordi det er det man i Parisavtalen har blitt enige om
tilpasse seg til et endret klima, som Parisavtalen forplikter å begrense oppvarmingen til. I tillegg vil vi da kunne unngå
oss å bidra til. noen av de verste effektene av klimaendringene. Samtidig
ser vi konsekvensene allerede. 2017 blir for mange året da
Dette gjøres ved å bruke rammeverket «Climate Equity de virkelig fikk øynene opp for hvor ødeleggende og døde-
Reference Project» (CERP), som er utviklet av Stockholm lig klimaendringene kan være med flom i Sørøst-Asia og
Environment Institute og EcoEquity. Å fordele den nødven- tørke i Nordøst-Afrika, som rammet til sammen 60 millioner
dige innsatsen mellom land når det kommer til kampen mennesker. Samtidig så vi langvarig tørke i California og
for å stoppe klimaendringene, er en vanskelig oppgave. hetebølger i Sør-Europa, som tok liv. Rapporten legger
Ved å ta CERP-rammeverket i bruk er det imidlertid mulig derfor til grunn en utslippsbane som med 67 prosent sann-
å komme fram til en rettferdig fordeling av klimainnsatsen synlighet vil holde den globale oppvarmingen under 1,5°C.
som trengs, samtidig som behovet for utvikling for verdens Denne utslippsbanen viser at det er mulig å oppnå de nød-
fattige ivaretas. Dette gjøres ved å legge til grunn to grunn- vendige kuttene som gir oss en god sjanse til å klare dette,
leggende prinsipper: men det krever en umiddelbar global innsats.
1. at landene har ulikt ansvar for klimakrisen, Gjennom CERP-rammeverket utledes en rettferdig forde-
ling av den nødvendige globale klimainnsatsen, og Norges
2. at landene har ulik kapasitet til å bidra til å løse andel av den, ved å beregne landenes historiske ansvar for
klimakrisen. klimakrisen og deres respektive kapasitet til å løse prob-
lemet.
Disse kriteriene bygger på prinsippene om felles, men dif-
ferensiert ansvar og respektiv kapasitet, som er prinsipper Mens kapasitet tar utgangspunkt i landenes økonomi,
landene har blitt enige om internasjonalt, uttrykt i blant an- beregnes ansvar ved å ta landenes akkumulerte utslipp
net erklæringen fra Rio-konferansen i 1992 og i FNs ram- siden 1990. Både ansvar og kapasitet er beregnet ved
mekonvensjon om klimaendringer. Selv om det er enighet å utelukke den delen av økonomien (for kapasitet), og de
om disse prinsippene globalt, vektlegges de i praksis ofte klimagassutslipp (for ansvar), som kan tilskrives landets
forskjellig av ulike aktører. Operasjonaliseringen av ansvar fattige – dvs. de som lever for under 20 dollar dagen. Be-
og kapasitet har stor betydning for hvordan byrdene forde- grunnelsen for det er at mennesker som lever i fattigdom,
les mellom rike og fattige land, og er således et vanskelig har sluppet ut mindre klimagasser som følge av lavere for-
og omdiskutert spørsmål. CERP-rammeverket presenterer bruk, og dermed har mindre ansvar, samt at de må bruke
1 Beløpet er justert for kjøpekraft (PPP). Grensen på 20 dollar dagen (7500 dollar i året) er satt betraktelig høyere enn de globale grensene for absolutt
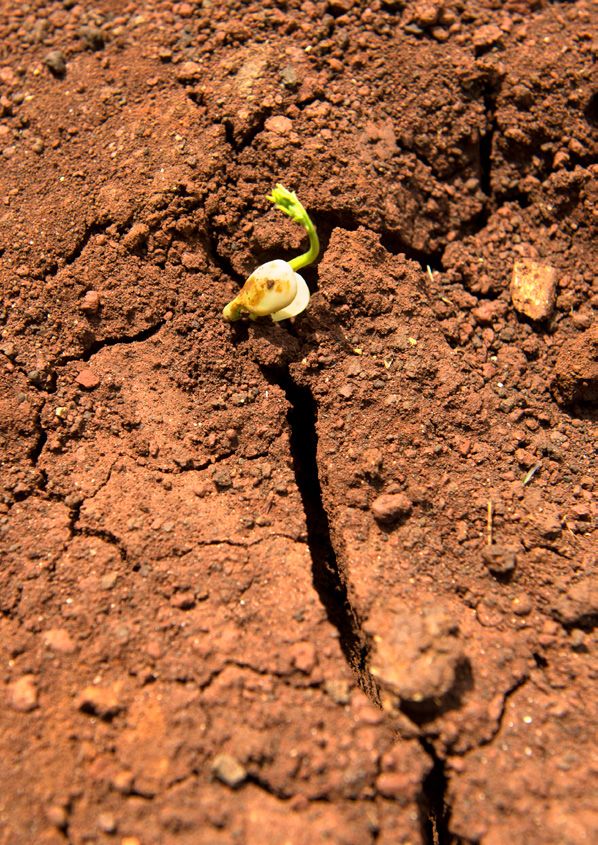
Sprout in a field in East Hararghe, during drought in Ethiopia. og ekstrem fattigdom (2 og 1 dollar dagen) for å tillate et rom for utvikling for fattige utover det disse minimumsgrensen tillater. Grensen tar dermed
Photo: Håvard Bjelland/Norwegian Church Aid hensyn til fattigdom også i industrialiserte land.
6 7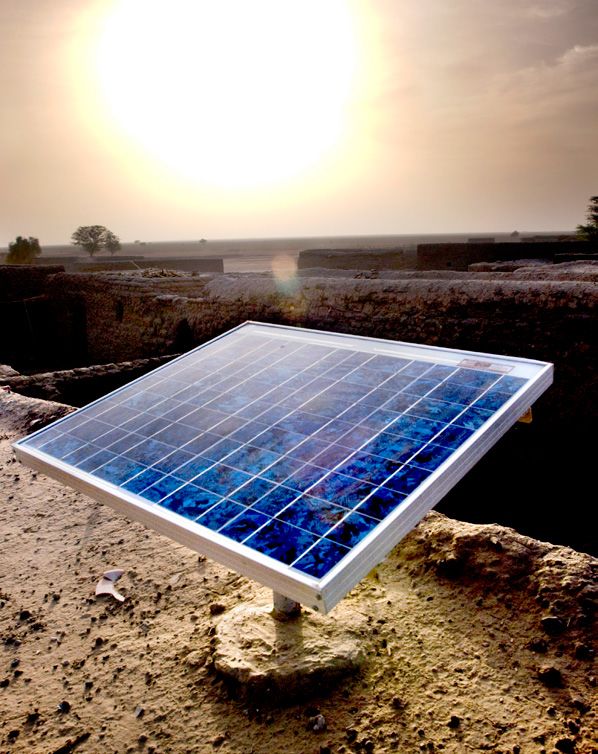
sin økonomiske kapasitet på utvikling, og dermed ikke kan alle andre land, sammenlignet med våre forventede utslipp
forventes å bidra like mye til den globale klimainnsatsen. hvis vi ikke kutter noe. Det gjør at Norge innen 2030 må
Fattige land, og land med en stor fattig befolkning, har der- kutte 53 prosent nasjonalt sammenlignet med 1990-nivået.
for både mindre ansvar for klimakrisen og mindre kapa-
sitet til å løse den. På denne måten ivaretar rammeverket Om vi kutter 53 prosent nasjonalt innen 2030, gjenstår
hensynet til utvikling for verdens fattige. derimot nesten 200 millioner tonn CO2. I tillegg kommer 1. INTRODUCTION
derfor en omfattende finansiering av utslippskutt i andre
Rapporten presenterer på bakgrunn av dette tall for Norg- land. Hvor mye det kommer til å koste, avhenger av prisen
es ansvar og kapasitet, som viser hvor stor andel av den på utslippskuttene. Ved å gjøre dette gjennom utbygging Devastating hurricanes, floods, forest fires and droughts ly recognizes Norway’s position as an exceptionally wealthy
globale klimainnsatsen et land har. Siden Norge er et rikt av fornybar energi og dermed legge til grunn den globale are becoming “the new normal” as global temperature rise country whose prosperity has derived in considerable part
og høyt utviklet land, samt har hatt relativt høye utslipp fra kostnaden av å bygge ut den fornybare energien som exceeds 1 °C above preindustrial levels. Given the cata- from the extraction of fossil fuels contributing to climate
1990, må vi bidra med en andel av innsatsen som langt trengs konkluderer rapporten med at Norges ansvar for strophic impacts we are already seeing, a rise above 1.5 °C change.
overgår vår andel av verdens befolkning. Norges rettferdige klimakutt internasjonalt kan være oppimot 50 milliarder — let alone 2 °C or more — is terrifying to contemplate. Ur-
andel av klimainnsatsen er altså større enn størrelsen på kroner i året. På toppen av dette kommer Norges ansvar gent action is needed at a global scale to avoid the worst In this report, Norwegian Church Aid, The Norwegian
befolkningen skulle tilsi. Norges befolkning utgjør kun 0,07 med å støtte utviklingsland til å tilpasse seg de klimaen- impacts, for people and the planet. The Paris Agreement’s Forum for Development and Environment (ForUM), Rain-
prosent av verdens befolkning, men vårt kombinerte ans- dringene det allerede er for sent å stoppe. Norges andel keystone objective of pursuing efforts to limit warming forest Foundation, and Friends of the Earth Norway assess
var og kapasitet fram til 2030 utgjør 0,65 prosent av den av det globale tilpasningsbehovet kommer på oppimot 15 to 1.5 °C is essential for catalyzing the rapid, large-scale the mitigation pledge that Norway has put forward under
totale globale innsatsen som er nødvendig. milliarder kroner i året. global action that is now needed. But, already, many fear the Paris Agreement, evaluating it in light of its fair share of
that it’s only a false promise, a mere “aspirational goal.” the global climate effort. For this report, the assigning or-
Konklusjonen blir dermed at Norge innen 2030 må kutte Dette er mye penger, og det vil kreve mye av Norge som And this is exactly what it will turn out to be if there is no ganizations have adopted the same fair shares framework
sine utslipp med 233 millioner tonn CO2. Med andre ord: samfunn å kutte over halvparten av sine nasjonale utslipp ramped-up ambition to back up Paris’ objective. used by a broad coalition of civil society organizations, the
Norge må redusere sine utslipp med 430 prosent sam- innen 2030. Men skal vi få til en rettferdig klimaløsning, er Civil Society Equity Review coalition, for their recent as-
menlignet med 1900-nivået for å kutte i tråd med sin dette del av svaret. Hvis Norge ikke tar sin rettmessige del Further, Paris’ lack of binding commitments means that sessments of countries’ climate action pledges (CSO Re-
rettferdige andel. Dette synliggjør nødvendigheten av en av innsatsen, vil det falle på noen med mindre ansvar og we are already facing an uphill battle. And of course the view, 2015; 2016; 2017). This approach, which is described
kraftig oppskalert nasjonal og internasjonal klimainnsats mindre kapasitet. Dessuten er Norge et rikt land som har pledges that were tabled in Paris fall far short of the Agree- further below, is particularly relevant to the political reali-
fra Norges side. råd til å finansiere utslippskutt nasjonalt og internasjonalt ment’s stated temperature objectives. Crucially, the Agree- ties of equitable effort-sharing in that it recognizes not only
i tråd med vårt ansvar og vår kapasitet. Norge har alle- ment builds in a regular revisiting of these pledges, and the vast disparities of wealth and capacity among coun-
Ettersom det ikke er mulig for Norge å kutte mer enn 100 rede lovet å bli klimanøytralt innen 2030. Denne rapporten commits Parties to a continual “ratcheting” or strengthen- tries, but also of the disparities between individuals within
prosent nasjonalt, og det i praksis heller ikke er mulig å ku- viser at Norges rettferdige andel er betraktelig større enn ing of pledges in order to bring them in line with the agreed countries.
tte alle klimagassutslipp i landet, innebærer dette at Norge det. Jo lenger norske politikere venter, jo vanskeligere og objectives of the Agreement, including the temperature ob-
er nødt til å finansiere omfattende utslippskutt i andre land dyrere blir det. Klimakrisen krever ambisiøs og omfattende jectives, in an equitable manner. Given the insufficiency of
i tillegg til ambisiøse utslippskutt nasjonalt. I rapporten handling og politikere med vilje til å mobilisere våre øko- the initial pledges, this ratcheting process is absolutely key
The scientific limits
antydes det hva som kan utgjøre en mulig fordeling mel- nomiske og teknologiske ressurser for å løse vår tids to meeting the Agreement’s temperature goals, and to its The first step is to place the pledges and the fair share
lom nasjonale og internasjonale kutt, ved å legge til grunn største utfordring. ultimate success. discussion firmly in the context of climate science and the
at Norge skal kutte forholdsmessig like mye nasjonalt som urgency of the climate challenge. This involves specifying
Norway has established itself as a global leader in the as clearly as possible what is required to keep warming
climate policy domain. Its concerted efforts to mobilize below 1.5 °C. To represent an ambitious and equitable fu-
Photo: Norwegian Church Aid climate finance (Government of Norway, 2016; WRI/ODI/ ture consistent with the 1.5 °C limit, we draw upon a global
CICERO, 2013) have made it one of the largest contributors mitigation scenario analysis (Grübler et al. 2018) recently
of climate-related support to developing countries. Norway developed at the International Institute for Applied Systems
surpassed its emissions reduction target of the first Kyoto Analysis (IIASA). We have selected this scenario because it
commitment period, and has pledged to be “carbon neu- explicitly takes the universal attainment of a “decent living
tral” by 2030. Owing to this demonstrated commitment to standard” as a design criterion and is therefore suitable for
climate action, Norway is broadly perceived on the global an analysis that foregrounds the developmental needs of
stage to be an exemplar of climate ambition. the world’s poorest and most vulnerable people in the con-
text of climate action.
However, Norway’s recent course is less promising. Its
emissions are currently 3 % above 1990 levels, far exceed- IIASA’s pathway, which it refers to as the Low Energy
ing its pledged target of reducing by 30 % by 2020. Moreo- Demand (LED) pathway, highlights and emphasizes major
ver, Norway’s ambitiousness should be assessed not only trends in energy demand that are already observable to-
in comparison with other countries’, but in comparison day and that are expected to continue and intensify, for ex-
with the requirements of science, and in a manner that ful- ample, urbanization, digitalization, decentralization of the
2 Whether this is truly “new and additional” (as, under the UNFCCC, developed country contributions are required to be) is a matter of debate. Members
of Norway’s civil society have argued that these contributions are part of the long-standing commitment of Norway to direct 1 % of gross domestic
product toward overseas development assistance.
3 This pledge is offered conditionally, “as part of an ambitious global climate agreement in which other developed countries also take on extensive obliga-
tions, Norway will have a binding target for carbon neutrality by 2030 at the latest.”
8 9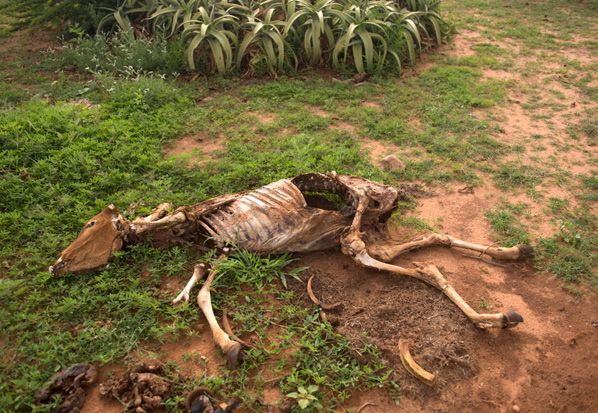
IIASA 2016), most of which assume the deployment of shift the world from its current pathway to a climate-safe
substantial amounts of negative emissions technology, a pathway? In terms of the required mitigation effort, this is
feature which the LED pathway does not share. Nonethe- graphically represented in Figure 2: the widening orange
less, it is apparent that the LED pathway chosen here, is area in the left panel depicts the global mitigation gap over
#
! && #"&'
$
among the more stringent of the 1.5 °C-consistent path- time – the amount of mitigation needed to reduce emis-
ways. Additionally, Figure 1 also shows an ensemble of sions from the world’s rising emission trend to the 1.5 °C
baseline scenarios from the same suite of pathways stud- LED pathway. The right panel illustrates how this widening
ies (SSPx-baselines), along with the baseline used in this mitigation gap might be divided into national shares of the
analysis (see note 4 for details), highlighting that the spe- required mitigation effort. The question is then, what is a
cific baseline used here is well within the range of baseline fair way to share this effort?
Figure 1. LED Pathway (blue),
showing emissions rapidly scenarios of the relevant literature.
peaking globally (by 2020), de-
clining 80 % by 2050 and toward In the following section we present the core equity princi-
zero by the century’s end; the Zooming in, and excluding emissions from Land Use, Land ples that bear directly on this question of how this mitiga-
baseline emissions projections
used in this study (black solid Use Change and Forestry (LULUCF) , Figure 2a shows that tion effort might be shared fairly, and present the approach
line to 2030), in the context of by 2030 the world will need to have reduced GHG emissions that is taken here to assess Norway’s fair share. It is im-
the 1.5°C consistent scenarios
(N=13, green area) of recent SSP by just over 36 GtCO2eq compared to the current global portant to stress that equity refers not only to the mitigation
% studies (Rogelj et al. 2018), as emission trends. This amount of mitigation greatly exceeds challenge, but also to adaptation, and to loss and damage
well 2 °C consistent pathways
&
"% # &
"
! && #"& (N=19, orange area) and baseline – by more than five-fold – the mitigation that has so far as well. In fact, these challenges may be greater than the
&'#%
! && #"& ( &
"% #&
projections (N=26, grey area) of been pledged under the Paris NDCs (UNFCCC 2016). The challenge of mitigation itself, and a global response will
the mainstream SSP models (IIA-
fundamental question of equitable sharing of the global only be seen as fair if efforts on all sides are shared fairly.
( &
"% #& (&
"
SA 2016). The figure also shows
the possible range of emissions climate effort can then be posed as follows: what share of We return to this below.
"
resulting from current climate
action pledges (NDCs) under the the required global effort should each country contribute to
Paris Agreement (black boxes).
energy system, shift from ownership-based to use-based et al. 2018), the LED scenario requires very stringent re-
consumption of services and the sharing economy, device ductions, eliminating half of current emissions by 2030
convergence, and the emergence of a circular economy. (reaching 25 GtCO2eq), only about 10 GtCO2eq in 2050, and
These trends, together with other substantial increases in a mere 1.5 GtCO2eq, mainly for agriculture, in 2100.
energy efficiency across all sectors, lead to energy demand
being very low in the future (reaching 42% below 2020 levels As a result, the scenario leads to an ambitious global emis-
in 2050), despite population growth and a global increase in sions pathway that does not rely on controversial negative
end use energy services, such as thermally comfortable liv- emission technologies. However, though it is an ambi-
ing space, food consumed per person, or the number of per- tious pathway, it cannot be taken as one that ensures that
son-kilometres travelled. In the LED scenario, the energy warming will remain below 1.5 °C. The inherent complexity
system that satisfies this low energy demand decarbo- in the global carbon cycle, along with our incomplete un-
nizes quickly, as the shrinking of the global energy system derstanding of the climate system means that the climate
provides “breathing room” for supply-side decarbonization system may be more sensitive to our emissions than our
and facilitates retirement of fossil-based generation. current understanding would suggest. Accounting for
some of these uncertainties (the “known unknowns”), it
Because of these features, the scenario can also satisfy the is estimated that even this ambitious path would pose ap-
energy need without having to presuppose the availability proximately a one-third chance of temperatures in 2100
in the future of large volumes of negative emissions, for being above 1.5 °C, and approximately one-half chance that
example through large-scale bioenergy with CCS (BECCS), temperatures will overshoot 1.5 °C at some point during
as assumed by many other ostensible 1.5 °C scenarios. As the 21st century. Clearly, further delay, or less ambitious
a result, the LED scenario relies on no negative emissions reductions will quickly increase the risk of greater warm-
technologies (NETs, or CDR, for Carbon Dioxide Removal, ing, including rising the chance of exceeding 1.5 °C.
including BECCS), although the global forest sink is en-
hanced significantly due to reduced competition of bioen- Figure 1 above shows the LED 1.5 °C Pathway, with emis-
ergy cropland and pastures with forests. sions rapidly peaking globally (by 2020), declining 80 % by
2050 and essentially to zero by the century’s end. Figure 1 Figure 2: a. LED Pathway and baseline , showing necessary global mitigation (orange
shading). b. LED Pathway and baseline, showing necessary global mitigation divided into
Compared to current (2016) global greenhouse gas emis- shows the LED pathway in the context of a suite of other national shares of the selected countries and groups
sions of about 50 GtCO2eq (Le Quéré et al. 2018, Gütschow mainstream 1.5 °C and 2 °C pathways (Rogelj et al. 2018,
4 Global mitigation pathways, as the LED scenario pathway shown in Figure 1, typically include emissions from all sources. However, there is a large de-
gree of uncertainty with regards to LULUCF emissions, and wealthy countries, including Norway, have written themselves emissions accounting rules
for these emissions that even further obscure the true scale of emissions, and instead give themselves generous emissions credits from this sector. 5 Our baseline emissions are based on GDP projections from the IMF’s World Economic Outlook (to 2022) and IPCC AR5 Scenario Database (for 2023-
For these reasons, the following analysis exclude emissions from LULUCF, even though those emissions, especially emissions from deforestation and 2030) combined with the median carbon intensity changes modelled in the EMF27-Base-FullTech scenario from the IPCC AR5 Scenario Database.
forest degradation, also need to be addressed in order to manage the climate crisis. For more detailed information see https://climateequityreference.org/calculator-information/the-climate-equity-reference-calculator-database
10 11
2.THE CONVENTION’S CORE EQUITY PRINCIPLES
                                                      Equity principles and indicators                                 be in accordance with their contribution to the problem
                                                      Climate change is the largest and most difficult commons         (Responsibility) and their capabilities to solve it (Capaci-
                                                      problem that humanity has ever faced, and it will not be         ty). These two principles should be quite familiar, as they
                                                      solved without prolonged and robust cooperation across           strongly echo how individual polities deal with ethical chal-
                                                      the world’s vastly disparate nations. Equity matters, then,      lenges: members of society are expected to take respon-
                                                      not only because it is a good in itself but also because it is   sibility for their messes, and when public costs need to be
                                                      the key to cooperation. As the IPCC highlighted in its 5th       shared, tax systems invariably require wealthier members
                                                      Assessment Report’s Summary for Policy Makers, “out-             to contribute more than poorer members.
                                                      comes seen as equitable can lead to more effective coop-
                                                      eration” (IPCC 2014, p. 5).                                      A third critical principle is the Right to Development. As
                                                                                                                       stated in the 1986 United Nations Declaration on the Right
                                                      The purpose of this report is to quantitatively assess           to Development:
                                                      Norway’s fair contribution to that global cooperation. De-
                                                      fining and quantifying equity is challenging, of course. It is   “The right to development is an inalienable human right
                                                      an inherently and irreducibly value-laden notion, one that       by virtue of which every human person and all peoples are
                                                      cannot be uniquely and objectively specified. While there is     entitled to participate in, contribute to, and enjoy econom-
                                                      certainly room for discussion about the precise definition       ic, social, cultural and political development, in which all
                                                      and quantification of fair shares, equity is hardly a mere       human rights and fundamental freedoms can be fully real-
                                                      matter of opinion. Indeed, enough can be said about equity       ized.” [Article 1.1, Declaration on the Right to Development]
                                                      based on internationally agreed and virtually universal eth-
                                                      ical principles to make an analysis of a country’s fair share    The Rio Declaration situates this fundamental right in
                                                      both illuminating and politically useful.                        the context of equity and sustainability, stating:“The right
                                                                                                                       to development must be fulfilled so as to equitably meet
     Gerbile village has gone through both drought    First, to understand the problem of equitable action with-       developmental and environmental needs of present and
             and flooding. Ethiopia, Somali Region.   in a world of disparities, it is useful to go back to the UN     future generations.” [Principle 3, Rio Declaration].
                           Photo: Håvard Bjelland/    Climate Convention’s core consensus on equity. As noted in
                            Norwegian Church Aid      the Principles (Article 3.1) of the UNFCCC,                      In the context of the climate challenge, these three core
                                                                                                                       equity principles can be expressed as follows:
                                                      “The Parties should protect the climate system for the ben-
                                                      efit of present and future generations of humankind, on the      • Capacity implies that those who have greater capacity
                                                      basis of equity and in accordance with their common but            to deal with climate change should contribute more to
                                                      differentiated responsibilities and respective capabilities.”      solving it, all else being equal.

                                                      This echoes the more explicit text of the Rio Declaration,       • Responsibility implies that those who have greater
                                                      agreed among Parties at the same 1992 Earth Summit in              responsibility for causing climate change should contri-
                                                      Rio de Janeiro as the UNFCCC, which reads:                         bute more to solving it, all else being equal.

                                                      “In view of the different contributions to global environ-       • Right to Sustainable Development implies that our glob-
                                                      mental degradation, States have common but differentiat-           al response to climate change – mitigation, adaptation,
                                                      ed responsibilities. The developed countries acknowledge           and addressing loss and damage – should be undertaken
                                                      the responsibility that they bear in the international pur-        in a manner that protects human rights, fundamental
                                                      suit of sustainable development in view of the pressures           freedoms, and enables equitable and sustainable devel-
                                                      their societies place on the global environment and of             opment.
                                                      the technologies and financial resources they command.”
                                                      [Principle 7, Rio Declaration 1992]                              While different countries may never precisely agree on an
                                                                                                                       exact formulaic definition of these principles, it is indeed
                                                      The Rio Declaration is helpfully explicit about the relation-    possible to represent these principles as quantified indi-
                                                      ship between the phrase “common but differentiated re-           cators. Capacity has typically been expressed straightfor-
                                                      sponsibilities” and ethical principles suggesting that coun-     wardly in financial terms. This has become customary in
                                                      tries’ contribution to addressing global problems should         discussions of equitable effort-sharing not necessarily be-

12                                                                                                                                                                                     13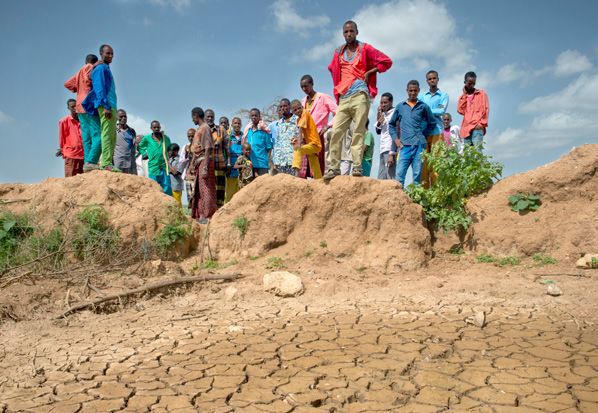
cause financial income is the only relevant and important
     type of capacity for dealing with climate change, but be-
     cause it is extremely highly correlated with the other types
     of capacity (technological capacity, institutional capacity,
     etc.) that are also important. Just as income is typically
     considered in a progressive manner in national tax poli-            3. WHAT IS NORWAY’S SHARE?
     cy – to differentiate a dollar earned by a poor person from
     one earned by a rich person – it can analogously be defined
     in a progressive manner for the purposes of defining na-            Fair effort-sharing                                                              legal terms, 1990 cannot be taken as the “ordinary mean-
     tional Capacity. A straightforward method for doing this is         Fair effort-sharing entails dividing the total required ef-                      ing” of the term “historical emissions”. But using 1990
     to define an income threshold below which income does               fort associated with global climate mitigation among all                         serves to make a point: it defines Responsibility in a man-
     not count toward Capacity. This is precisely analogous to           countries in proportion to each country’s share of the total                     ner that is generous to nations that had already been fully
     the “0 % tax bracket” that exists in nearly all national tax        global Responsibility and Capacity. This means that each                         industrialized and had undertaken much of their fossil fu-
     statutes, whereby earnings below a specified threshold do           country has a unique fair share that will change over time                       el-intensive development prior to 1990, and yet, as we see
     not count toward taxable income, i.e., do not count when            as it increases its relative proportion of cumulative global                     below, it nevertheless leads to striking results showing the
     assessing a person’s financial “capacity” to be legitimate-         emissions and global income. In this report, Responsibility                      need for these countries, including Norway, to contribute
     ly drawn from for the funding of public goods. Similarly, a         and Capacity have been weighted equally (simply averaging                        much more to the global effort than they have so shown
     higher income level can also be defined at which income             them together), reflecting the perspective of the assigning                      a willingness to commit.
     counts most heavily toward national capacity, analogous to          organizations that the two principles should count equal-
     the maximum tax bracket. Between the two income lev-                ly in determining a country’s fair share. (Alternatively, one                    The second key ethical choice is the relative capacity of
     els, income increasingly counts toward the calculation of           could in principle weight the two unequally, giving greater                      poor people and wealthy people within each nation as dis-
     a country’s capacity. This is a very simple, but quite useful,      priority to either Capacity or Responsibility.)                                  cussed above. That is, to what extent should progressivity
     way to define an indicator for national Capacity, and it is                                                                                          enter into our definition of Capacity?
     compelling because it is so similar to how countries have           While there are many details associated with using these
     typically drawn on the capacity principle as the basis for na-      indicators to explicitly quantify a country’s Responsibility                     For the analysis of Norway’s fair share presented here,
     tional tax policy. When defining an indicator of capacity, the      and Capacity, there are two key ethical choices to be made.                      the assigning organizations elected to set a development
     key question is how progressively it should be defined, i.e.,                                                                                        threshold at a level modestly higher than a global poverty
     how much more heavily should a dollar of income earned              The first is the historic extent of Responsibility: from what                    line, which is itself about US$16 per day per person (PPP
     by a wealthy person count than a dollar earned by a poor            “start date” should emissions be reckoned in the account-                        adjusted , US(PPP)$2005). This is notably higher than the
     person. We return to this question in the section below.            ing of responsibility? Based on internal deliberations and                       oft-referenced poverty line of US$1 or US$2 per day, which
                                                                         discussions the assigning organizations has identified a                         is more appropriately termed an “extreme poverty line” or
     Responsibility can be straightforwardly represented by a            start date for accounting for cumulative emissions as 1990.                      a “destitution line”. Rather, this figure derives from an em-
     quantitative indicator reflecting cumulative GHG emissions          Other dates could be justified, such as 1970s, which reflects                    pirical analysis of the income levels at which the classic
     since some specified initial date, which directly reflects          a period during which governments such as the United                             plagues of poverty – malnutrition, high infant mortality, low
     a nation’s contribution to climate change. It can also be           States were already issuing reports about climate change                         educational attainment, high relative food expenditures –
     defined in a progressive manner, to distinguish emissions           and the G7 was already highlighting climate change as a                          begin to disappear, or at least become exceptions to the
     arising from basic survival activities from those associat-         problem and seeking to prevent further increases of carbon                       rule. So, taking a figure of 25% above this global poverty line,
     ed with luxury consumption. Analogous to the definition of          dioxide in the atmosphere, or even 1850, which reflects a                        these results assume a development threshold of US$20
     Capacity, a simple way to introduce this progressivity is to        period during which fossil carbon emissions of industrializ-                     per person per day (US$7,500 per person per year), a level
     define a country’s Responsibility in a manner that excludes         ing countries became significant. The choice of 1990 is thus                     which also happens to be consistent with a typical poverty
     emissions corresponding to consumption below a lower                arguably a rather late date, reflecting a time frame during                      line in a developed country.
     threshold, and counts more fully those emissions corre-             which countries were already in the process of negotiating
     sponding to consumption above an upper threshold.                   an international climate agreement. Indeed, when the Con-                        The upper threshold, marking the income level above which
                                                                         vention was signed in 1992, the year 1990 was included as                        income counts fully toward the calculation of a country’s
     The right to sustainable development is clearly complex             a contemporary reference point against which to measure                          Capacity, is set at a level that generally reflects a lifestyle
     and multi-dimensional, but in the limited context of fair effort-   developed countries’ mitigation efforts by the year 2000. It                     at which further income would be spent not on basic ne-
     sharing in international climate cooperation, we take it to         was not intended as a reference point or start date for the                      cessities. For this analysis, the upper threshold is set at
     mean that efforts are shared among countries in a way               concept of historical responsibility noted in its preamble. In                   US(MER)$100,000 per year. This figure seems quite con-
     that does not burden any country – and in particular those
     countries still struggling to attain basic developmental needs.
                                                                         6 The lower threshold is adjusted according to Purchasing Power Parity (PPP) conversion rates, to reflect the different purchasing power of local curren-
                                                                           cies compared to their Market Exchange Rate (MER) conversion rates (that is, the normal exchange rates used in currency markets), particularly at low
     With the above discussion of equity principles and indi-              incomes where a smaller portion of goods is traded through international markets. The higher threshold is defined according to MER conversion rates,
     cators in mind, the general fair shares framework under-              reflecting the fact that a higher proportion of goods is traded through international markets at higher incomes, as well as those products and technolo-
                                                                           gies required for mitigation.
     lying this analysis follows straightforwardly, as described in      7 Lant Pritchett (2003; 2006) concluded that the use of this line “is justifiable, more consistent with international fairness, and is a better foundation for
     the following section.                                                the World Bank’s organizational mission of poverty reduction” and that “If the poverty line were defined as the level of income at which people typically
                                                                           achieve acceptable levels of the Millennium Development Goal indicators (such as universal primary school completion), it would be set at about [$16]
                                                                           per day.”
                                > Drought in Ethiopia, Somali region.    8 The Norwegian bracket tax – a tax on gross salary and other personal income – has a highest income threshold of NOK 962,050, or about
                                                                           $US(2005)96,000. https://www.nordisketax.net/files/nor/eng/i07.asp .
                                             Photo: Håvard Bjelland/     9 The Climate Equity Reference Calculator is a creation of the Climate Equity Reference Project, which assisted in the production of this report. For more
                                              Norwegian Church Aid         information, see http://climateequityreference.org

14                                                                                                                                                                                                                                        15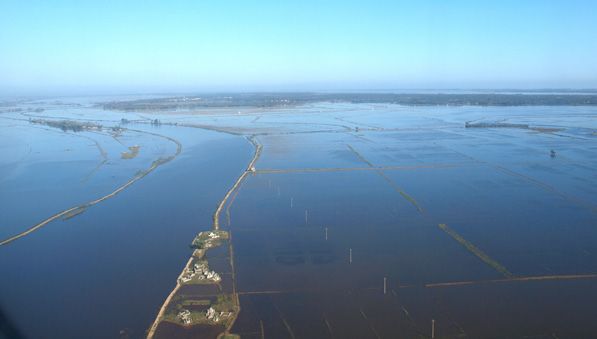
sistent with the Norwegian context, as it corresponds to the chose as key equity parameters: a historic responsibility
highest income threshold in the Norwegian “bracket tax” . start date of 1990, progressivity determined by thresholds
of US$(PPP)7,500 and $US(MER)100,000, and an equal
This analysis has been carried out using the online Climate weighting of Capacity and Responsibility. The Climate
Equity Reference Calculator (Kemp-Benedict et al. 2017). Equity Reference Calculator then uses these definitions,
It allows users to define a wide range of “equity settings” along with standard demographic and macroeconomic in- 4. INTERNATIONAL COMPARISON
relating to Responsibility and Capacity, to reflect the users’ dicators (e.g., national population, GDP, Gini, carbon inten-
understanding of what constitutes fairness in the context sity) to transparently calculate national “fair shares” of the
of sharing the global climate change mitigation effort. For common global effort. As Figure 3 shows, Norway does have somewhat higher (just as in typical taxation systems, with higher tax rates
the purpose of this report, the assigning organizations fair share than the other countries. Note that such com- applied to higher marginal income). This is notable, and
parisons are on a per capita basis, as it would be mean- even if Norway’s standing as a climate leader is assessed
ingless to compare countries of such vastly different size by comparing its efforts relative to other developed coun-
on an absolute basis. For example, China’s fair share is tries (rather than the actual demands of a 1.5°C pathway),
markedly smaller than Norway’s on a per capita basis, be- it must be gauged in light of Norway’s greater capacity and
cause of their considerably lower wealth and emissions, responsibility.
The key equity settings used in this report
even though it is much larger on an absolute basis. More
CAPACITY to the point, however, the US fair share is about 25% lower The countries’ NDCs are also shown in Figure 3, expressed
Lower income threshold than Norway’s, and the fair share of the OECD as a whole in tons of pledged mitigation below baseline, per capita.
(“development” threshold, below which per capita income $USD 7,500/year is approximately 50% lower. This owes overwhelmingly to It is immediately apparent that Norway’s NDC, and all the
does not count toward national capacity) Norway’s greater wealth. Especially within an ethical other developed countries, fall far short of matching their
Upper income threshold framework in which the higher the income, the more it fair shares. China’s NDC represents nearly 80% of its fair
$USD 100,000/year counts toward a nation’s capacity Norway’s prosperity share, and India actually manages to exceed it.
(“luxury” threshold, above which income counts fully to-
translates into greater ethical responsibilities to the world
ward national capacity)
RESPONSIBILITY Figure 3. Norway’s fair share
compared with other countries
45
Mitigation in tonnes of CO2eq per capita below baseline in 2030
or groupings, expressed on a per
Historic responsibility starting year 1990 capita basis to provide a meaningful
40 basis of comparison. For countries/
RELATIVE WEIGHTING OF CAPACITY groups that have an NDC, it is also
equal (50%-50%) 35
AND RESPONSIBILITY shown (red diamond), for Sweden
and Denmark, an estimate of the
30 EU NDC’s impact is shown
(orange diamond).
25
20
15
10
Results: Norway’s fair share 5
Given that Norway is among the world’s wealthiest 2030 Norway’s fair share is 0.65% of the total required 0
countries, with a GDP per capita in 2018 of nearly mitigation effort (about 36 GtCO2eq), or 233 MtCO2eq. Norway USA Denmark OECD Sweden EU-28 China India
US$75,000, compared to a global average of roughly This same calculation is performed for every year be-
US$10,000, it has a disproportionately high proportion tween 2018 to 2030, yielding a series of annual fair Fair Share Benchmark NDC pledge
of the world’s Capacity. More precisely, its population shares for Norway.
is only 0.07% of the global total, whereas it has 1.1% of Norway USA Denmark OECD Sweden EU-28 China India
the global total Capacity as defined above. Its Respon- In relation to Norway’s Capacity and Responsibility,
Fair Share
sibility is disproportionate as well, but less so, being this fair share is appropriate and proportionate, and
0.38% of the global total. Averaging the two, we see that if Norway were to undertake less mitigation, it would (as mitigation in
tonnes of CO2 per 39.3 37.0 25.6 19.7 19.5 14.1 3.2 0.03
Norway’s combined Capacity and Responsibility comes be under-performing relative to its share of the total
capita below base-
to 0.74% of the global total in 2018. Projecting ahead to global effort. If it were to undertake more, it could truly line in 2030)
2030, its combined Capacity and Responsibility comes be considered a climate leader, setting an example for
NDC pledge
to 0.65% of the global total. (The decline owes primarily other nations in an ambitious global response.
to the relative more rapid increase in income and emis- (as mitigation in
tonnes of CO2 per 3.8 6.8 3.5 n/a 1.8 2.6 2.5 0.16
sions in developing countries, and their corresponding- In chapter 5, we discuss the practical meaning of
capita below base-
ly larger share of global Capacity and Responsibility). Norway’s fair share, and how it could be implemented.
line in 2030)
With this figure in hand, and given the definition of Ca-
10 As members of the EU, Sweden and Denmark do not have their own NDC under the Paris Agreement. Translation of the EU NDC is not straightforward
pacity and Responsibility laid out here, one finds that in since member states take targets of different stringency under the EU effort sharing agreement and since a large share of EU emissions are covered by
the EU Emissions Trading Scheme, which makes it impossible to precisely assign reductions of these emissions to individual countries. As an indicative
target, we have presented here the modelled emissions in 2030 under the EUCO27 scenario, which models the implementation of the EU’s “40% below
1990” NDC with the auxiliary parameters agreed by EU leaders in October 2014 (43% reductions in EU-ETS sectors, 30% reduction in non-EU-ETS
sectors, increase in renewables to 27% of EU energy consumption, 27% improvement in energy efficiency) (E3MLab & IIASA 2016).
16 17means to do so. Poorer countries now have no choice but
to forego the proven development pathways that wealthier
countries have taken, and to shift to alternative pathways
5. THE DUAL NATURE OF NORWAY’S FAIR SHARE: that are not fully proven, at an extraordinarily rapid pace,
0W&2H H[FO/8/8&)
to help the world avoid catastrophic climate change. While
DOMESTIC EFFORT & INTERNATIONAL SUPPORT
this developmental shift is needed, there is still an injus-
tice in requiring developing countries to work with a much
narrower set of options on an extremely difficult timeline.
Fair share vs feasible reductions This limits countries’ opportunity to plan a just transition
Figure 4 shows Norway’s emissions trend, or baseline, that can mitigate the hard trade-offs and protect workers,
to 2030 (top line), and the time series of its growing fair citizens and sectors against the upheaval that any major
share (orange wedge), increasing toward 233 MtCO2eq in transformation involves. This challenging situation under-
2030. As is immediately evident, the totality of Norway’s scores the importance ensuring that wealthier countries
fair share of global mitigation cannot possibly be under- provide international climate support in a manner that is
taken domestically – Norway’s emissions would need to predictable and reliable, so long-term planning is feasible
be forced to zero within a few years, and somehow driven for their poorer partners.
increasingly negative in the following years. In other words,
Norway’s fair share vastly exceeds its feasible domestic In Norway’s case, how much of its fair share should be
reduction opportunities. discharged through domestic mitigation, and how much
Figure 5. Norway’s fair share, divided into a portion that
through international cooperation? Figure 5 presents an could be undertaken domestically (yellow wedge) and a
indicative division of Norway’s fair share into domestic much larger portion (striped wedge) that would be under-
taken through international support.
and international portions. This division is approximate,
as a more precise estimate would require an analysis of
a cost-effective distribution of mitigation among all coun- claim that Norway should be allowed to reduce emissions
0W&2H H[FO/8/8&)
tries based on detailed, bottom-up, assessment of each at a slower rate would have to be accompanied by a strong
Figure 4. Norway’s fair share of the global mitigation effort,
growing toward 233 MtCO2eq in 2030, shown as reductions below country’s domestic mitigation potential. It would require case that other nations should reduce their emissions at a
Norway’s domestic emissions. A large fraction of this effort would country-by-country assessment of renewables resourc- quicker rate, along with the support to enable that to happen.
in fact need to be undertaken internationally, by providing finan-
cial and technological support. es, efficiency potential, and unmet energy service needs,
as well as projections of structural economic trends and Applying the above approach, and obliging Norway to make
techno-economic performance of mitigation technologies. domestic reductions of 59% below its projected 2030 emis-
Perhaps even more challenging, it would require confront- sions (again, as an absolute minimum) translates to re-
ing value-laden questions regarding the potential and need ductions of no less than 35.2 MtCO2eq of mitigation effort
for shifts in consumption driven by lifestyle and behavioural relative to Norway’s current baseline pathway, amounting
shifts to reduce emissions, as well as an understanding of to emissions in 2030 of no more than 24.6 MtCO2eq, which
the transitional challenges confronting developing coun- is 53% below 1990 levels. Clearly, in comparison even to
tries as they aim to rapidly shift developmental courses. this minimal target, Norway’s current 2030 pledge of a 40%
Clearly, no such definitive analysis exists. We thus provide reduction is extremely weak.
a rough estimate that serves as a helpful benchmark and
What this clearly implies is that much of Norway’s fair share enabling – through financial and technological support – signal for the general scale of domestic reductions that Equally clearly, this domestic reduction leaves a large
of global mitigation simply cannot be undertaken through mitigation in other countries. Wealthier countries – as an should be anticipated. This estimate is based on the simple fraction of Norway’s overall fair share of 233 MtCO2eq to
mitigation at home, and indeed it is unrealistic – and even integral part of their fair share – will thus provide the finan- assumption that national emissions in all countries should be undertaken by supporting mitigation internationally.
counter-productive – to ask Norway to do so. Norway is not cial and technological means for poorer countries to exploit decline below national business-as-usual trends at a rate The domestic reduction amounts to 35.6 MtCO2eq, leav-
unique in this regard. It is just like other developed coun- their full mitigation potential. Likewise, poorer countries no lower than the aggregate global emissions drop, as de- ing 198 MtCO2eq to achieve through international support,
tries with high levels of Capacity and Responsibility, whose will need to make effective use of this support to increase termined by the overall global LED 1.5 °C Pathway, where more than five times as much as Norway’s expected do-
fair share of the global mitigation effort exceed their own their domestic mitigation efforts to exploit their mitigation emissions in 2030 (excluding land use) have fallen to 25.2 mestic reductions. Clearly, international support is an ab-
domestic mitigation potential. Conversely, poorer develop- potential – well beyond their fair share. This additional GtCO2eq, or 59% below baseline projections. Certainly, any solutely integral part of Norway’s fair share, and cannot be
ing countries (with relatively lower levels of Capacity and mitigation would be undertaken in a manner consistent
Responsibility) generally have fair shares of the mitigation with their national sustainable development needs, and on
effort that are smaller, and sometimes much smaller, than the condition that support is forthcoming from wealthier
11 We make the assumption that renewable energy investments displace a mix of other capacity investments with a combined average carbon intensity
their domestic mitigation potential. However, if we are to countries. These additional reductions do not offset ambi- comparable to a modern natural gas power plant. We adopt the IPCC carbon intensity coefficient of 0.404 MtCO2/TWh (IPCC 2014; p. 295), typical for a
keep warming below 1.5 °C, all available mitigation poten- tious domestic reductions in wealthier countries, but are in natural gas combined cycle power plant. Then, 198 MtCO2 of mitigation straightforwardly translates into 490 TWh of renewable generation displacing
natural gas generation.
tial must be used, everywhere on the planet. addition to them. 12 Given the comprehensive and far-reaching nature of the necessary transition and the unavoidable uncertainties associated with technological progress
and future policy choices, there is no definitive, objective methodology for estimating the size of the required investment. Still, a sense of the scale is
provided by the recent International Energy Agency / International Renewable Energy Agency (IEA/IRENA 2017) study Investment Needs for a Low-Car-
The only way to resolve this conundrum is through inter- It’s important to recognize that there is an additional equity bon Energy System. The collaboration by the two organizations relied on two distinct analytical methodologies and modelling tools, yet came up with
national cooperation. While it is pointless to demand that dimension beyond ensuring fair shares with necessary fairly consistent overall results looking at scenarios that rely on the same carbon budget aiming to keep warming below 2 °C with 66% likelihood.
Over the period to 2050, the IEA finds that an increase in total investment of approximately 25% is required, equal to US$25 trillion, or an average of
Norway make more domestic reductions than is feasible, it means of implementation. There is an inequity in requir- US$700 billion per year. The IRENA analysis finds an increase in total investment of approximately US$29 trillion is needed, averaging US$830 billion
is entirely reasonable to require Norway to make extremely ing poor countries to reduce emissions beyond their fair per year. It is important to note that these two studies were focused on energy-related emissions alone. When investments in other sectors of the
economy are also taken into account, including waste, agriculture, and forestry, as well as in mitigation in all non-CO2 greenhouse gases, the total
ambitious reductions domestically and to fulfil the portion shares because wealthier countries’ disproportionate use investment requirements will be higher. Also, the IEA/IRENA analysis was focused on a future in which warming is held below 2 °C with a 2in-3 chance.
of its fair share that it is unable to undertake at home by of the carbon budget – even if they are provided with the This is markedly less ambitious than the 1.5 °C future (or even a “well below 2 °C” future).
18 19Vous pouvez aussi lire