Plants and fungal diversity analysed by DNA Metabarcoding on canadian pollen sample of honeybees (Apis Mellifera L.) along an urban-rural gradient ...
←
→
Transcription du contenu de la page
Si votre navigateur ne rend pas la page correctement, lisez s'il vous plaît le contenu de la page ci-dessous
https://lib.uliege.be https://matheo.uliege.be

 Plants and fungal diversity analysed by DNA Metabarcoding on canadian pollen
 sample of honeybees (Apis Mellifera L.) along an urban-rural gradient and
 across seasons

 Auteur : Decolle, Alicia
 Promoteur(s) : Francis, Frédéric; 8348
 Faculté : Gembloux Agro-Bio Tech (GxABT)
 Diplôme : Master en bioingénieur : gestion des forêts et des espaces naturels, à finalité spécialisée
 Année académique : 2020-2021
 URI/URL : http://hdl.handle.net/2268.2/13196

Avertissement à l'attention des usagers :

Tous les documents placés en accès ouvert sur le site le site MatheO sont protégés par le droit d'auteur. Conformément
aux principes énoncés par la "Budapest Open Access Initiative"(BOAI, 2002), l'utilisateur du site peut lire, télécharger,
copier, transmettre, imprimer, chercher ou faire un lien vers le texte intégral de ces documents, les disséquer pour les
indexer, s'en servir de données pour un logiciel, ou s'en servir à toute autre fin légale (ou prévue par la réglementation
relative au droit d'auteur). Toute utilisation du document à des fins commerciales est strictement interdite.

Par ailleurs, l'utilisateur s'engage à respecter les droits moraux de l'auteur, principalement le droit à l'intégrité de l'oeuvre
et le droit de paternité et ce dans toute utilisation que l'utilisateur entreprend. Ainsi, à titre d'exemple, lorsqu'il reproduira
un document par extrait ou dans son intégralité, l'utilisateur citera de manière complète les sources telles que
mentionnées ci-dessus. Toute utilisation non explicitement autorisée ci-avant (telle que par exemple, la modification du
document ou son résumé) nécessite l'autorisation préalable et expresse des auteurs ou de leurs ayants droit.
“PLANTS AND FUNGAL DIVERSITY ANALYSED BY
 DNA METABARCODING ON CANADIAN POLLEN
 SAMPLE OF HONEYBEES (APIS MELLIFERA L.)
 ALONG AN URBAN-RURAL GRADIENT AND
 ACROSS SEASONS”

 DECOLLE ALICIA

 TRAVAIL DE FIN D’ETUDES PRESENTE EN VUE DE L’OBTENTION DU DIPLOME DE
 MASTER BIOINGENIEUR EN GESTION DES FORETS ET DES ESPACES NATURELS

 ANNEE ACADEMIQUE 2020-2021

(CO)-PROMOTEUR(S): FREDERIC FRANCIS – AYAKO NAGASE
© Any reproduction of this document, by any means whatsoever, may only be made with the
 authorization of the author and the academic authority of Gembloux Agro-Bio Tech.
 This document is the sole responsibility of its author

© Toute reproduction du présent document, par quelque procédé que ce soit, ne peut être réalisée
 qu’avec l’autorisation de l’auteur et de l’autorité académique de Gembloux Agro-Bio Tech.
 Le présent document n’engage que son auteur.

 1
“PLANTS AND FUNGAL DIVERSITY ANALYSED BY
 DNA METABARCODING ON CANADIAN POLLEN
 SAMPLE OF HONEYBEES (APIS MELLIFERA L.)
 ALONG AN URBAN-RURAL GRADIENT AND
 ACROSS SEASONS”

 DECOLLE ALICIA

 TRAVAIL DE FIN D’ETUDES PRESENTE EN VUE DE L’OBTENTION DU DIPLOME DE
 MASTER BIOINGENIEUR EN GESTION DES FORETS ET DES ESPACES NATURELS

 ANNEE ACADEMIQUE 2020-2021

(CO)-PROMOTEUR(S): FREDERIC FRANCIS – AYAKO NAGASE

 2
In collaboration with Chiba University (Japan)

 With the financial support from Erasmus+ scholarship

 Acknowledgments
First and foremost, I would like to thank my research supervisors, Mr. Françis for letting me use the
offices in the entomological unit at the University of Liège (Gembloux Agro-Bio Tech) and Nagase-
sensei let me realise this thesis and to support me and my work through emails and online meeting.
Unfortunately, I couldn’t meet you in real because of the sanitary situation that didn’t allow me to
travel to Japan.

I am very grateful to Gregoire Noel who followed all my work and who helps me to deals with a new
software and with all the problems I encountered these past few months.

I also would like to thanks Scott McIvor for supervising the sampling in Toronto. It was nice to meet
you to discuss about this thesis.

Thank you to Sugita-san for all the help she gives me for the follow-up of administrative markdowns
even if the trip could not be made.

And finally thanks to my family, especially my mother for her moral support until the last minute and
to my friends for the precious time they gave me when I needed it.

 3
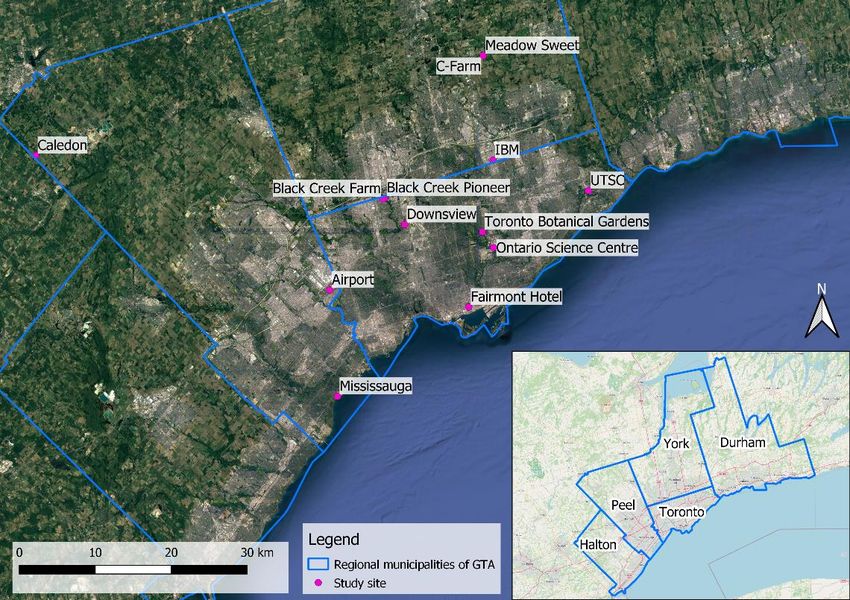
Abstract
The expansion of urbanised areas plays a major role in the sharp loss of biodiversity and threatens the
balance of ecosystems and the production of their services to human society. Over the years, cities
have become the place where vital issues are at stake for the maintenance of nature in a hostile
environment. It is therefore essential to rethink the management of these environments in order to
make them more attractive both for city dwellers and for the fauna and flora. These new green spaces
will provide pollinators with floral resources and a place to find refuge in cities.

This thesis is part of a continuum of studies carried out in recent years, the primary aim of which is to
highlight the influence that the urban-rural gradient and seasonality (variation in months) may have
on the richness and composition of plant species. A complementary study aimed at revealing the role
that pollinators, and more specifically honeybees Apis mellifera L., 1758, play in the vectoring of
microorganisms such as fungi during foraging activities.

To this end, 44 pollen samples were collected from 13 sites in and around the city of Toronto between
May and September 2020. These will be subjected to DNA analysis by metabarcoding, using the ITS
marker gene, in order to perform taxonomic classification and biodiversity analyses. This classification
was carried out using the naïve-bayes workbook and various reference databases and will make it
possible to determine the most suitable database for the following analyses.

The taxonomic results allowed the identification of plants and fungi and their characteristics
(vegetation structure - herbaceous or woody and status - exotic or native) which were linked to the 2
spatial and temporal factors.

Diversity α, or species richness was measured in 3 ways, the number of species per sample, the
Shannon index and the Simpson index. It was then evaluated by applying a generalized linear model
(GLM). Diversity β, or species composition was measured by the Jaccard index to calculate the Jaccard
distance matrix for constrained ordination (NMDS) followed by multivariate analysis of variance
(PERMANOVA) and a post-hoc test to pairwise compare compositional dissimilarities.

Species richness and composition are strongly influenced by season and month, whereas the urban-
rural gradient has little influence on plants. However, fungi are slightly more dependent on this
gradient. The plant and fungus species identified in the samples have characteristics that can have
both harmful and beneficial impacts on their environment.

This master thesis aims to provide decision support for future (re)development of green spaces or
greening of streets and buildings in urban and peri-urban environments. It will also shed light on the
role of honeybees in the spread of micro-organisms, such as fungi, and its consequences on flowers,
pollinator colonies and humans.

 4
Résumé
L’expansion des milieux urbanisés jouant un rôle prépondérant dans la forte perte de biodiversité
menace l’équilibre des écosystèmes et la production de leurs services envers la société humaine. Les
villes sont devenues au fil des années le lieu d’enjeux vitaux pour le maintien de la Nature en milieu
hostile. Il est donc primordial de repenser la gestion de ces environnements afin des les rendre plus
attractive tant pour les citadins que pour la faune et la flore. Ces nouveaux espaces verts offriront aux
pollinisateurs les ressources florales et un lieu où trouver refuge en villes.

Ce mémoire s’inscrit dans le continuum des études réalisées ces dernières années et dont le but
premier est de mettre en évidence l’influence que pourrait avoir le gradient urbain-rural et la
saisonnalité (variation des mois) sur la richesse et la composition en espèces de plantes. Une étude
complémentaire visant à révéler le rôle que les pollinisateurs, et plus particulièrement les abeilles
domestique Apis mellifera L., 1758, joue dans la vectorisation de microorganismes tel que des mycètes
lors des activités de butinage.

Pour ce faire, 44 échantillons de pollen ont été collecté dans 13 sites situés dans la ville de Toronto et
ses environs entre mai et septembre 2020. Ceux-ci seront soumis à une analyse de l’ADN par
métabarcodage, en utilisant le gène marqueur ITS, dans le but de réaliser une classification
taxonomique et de réaliser les analyses de biodiversité. Cette classification a été menée en utilisant le
classeur naïves-bayes ainsi que différentes bases de données de références et permettront de
déterminer la base de données la plus adaptée pour réaliser les analyses suivantes.

Les résultats taxonomiques ont permis l’identification de plantes et de mycètes et leurs
caractéristiques (structure de la végétation – herbacée ou ligneuse et le statut – exotique ou natif) qui
ont été mis en lien avec les 2 facteurs spatiaux et temporels.

La diversité α, ou richesse en espèces a été mesurée de 3 façons, le nombre d’espèce par échantillon,
l’indice de Shannon et l’indice de Simpson. Elle a ensuite été évaluée par l’application d’un modèle
linéaire généralisé (GLM). La diversité β, ou composition en espèces a été mesurée par l’indice de
Jaccard permettant de calculer la matrice de distance de Jaccard afin de procéder à une ordination
contrainte (NMDS) suivie d’une analyse multivariée de la variance (PERMANOVA) et d’un test post-hoc
pour comparer par paire les dissimilarités de composition.

La richesse et la composition en espèce sont fortement influencée par les saisons et les mois alors que
le gradient urbain-rural n’influe que très peu sur les plantes. Cependant les mycètes sont légèrement
plus dépendants de ce gradient. Les espèces de plantes et de mycètes identifiés dans les échantillons
possèdes des caractéristiques pouvant engendrer des impacts tant dommageables que bénéfiques sur
leur environnement.

Ce mémoire de master vise à fournir une aide à la décision pour de futurs projets de (ré)aménagement
d'espaces verts ou de verdissement de rues et de bâtiments dans des environnements urbains et
périurbains. Il apportera également un éclairage sur le rôle de l'abeille domestique dans la propagation
de micro-organismes, tels que les champignons, et ses conséquences sur les fleurs, les colonies de
pollinisateurs et les humains.

 5
Contents
List of Figures........................................................................................................................................... 8
List of Tables ............................................................................................................................................ 8
1. Introduction ..................................................................................................................................... 9
 1.1 Pollinators: Importance and decline ........................................................................................ 9
 1.2 Apis mellifera L......................................................................................................................... 9
 1.2.1 Description of the species ................................................................................................ 9
 1.2.2 Honeybees’ colonies ...................................................................................................... 10
 1.2.3 Foraging activities .......................................................................................................... 11
 1.2.4 Honeybees, a vector of micro-organisms ...................................................................... 12
 1.3 Urban beekeeping ................................................................................................................. 13
 1.4 Plants and Fungi metagenomic from pollen sample .............................................................. 14
 1.4.1 The advent of bioinformatics ......................................................................................... 14
 1.4.2 Pollen and spore DNA metabarcoding ........................................................................... 15
 1.5 Objectives .............................................................................................................................. 17
2. Materials and methods ................................................................................................................. 19
 2.1 Study area.............................................................................................................................. 19
 2.2 Pollen collection .................................................................................................................... 19
 2.3 DNA metabarcoding analysis: DNA extraction, amplification and sequencing .................... 20
 3.3.1 DNA extraction .............................................................................................................. 20
 3.3.2 DNA amplification & sequencing ................................................................................... 20
 2.4 Bioinformatics analyses ......................................................................................................... 21
 2.4.1 Reference databases ..................................................................................................... 21
 2.4.2 Classification method .................................................................................................... 22
 2.5 Urban-Rural gradient creation .............................................................................................. 23
 2.6 Biodiversity Analysis .............................................................................................................. 24
 2.6.1 Alpha diversity analysis ................................................................................................. 24
 2.6.2 Beta diversity analysis ................................................................................................... 25
3. Results ........................................................................................................................................... 26
 3.1. Taxonomy analysis ................................................................................................................ 26
 3.2. Composition of the sample ................................................................................................... 28
 3.3.1 Plant species .................................................................................................................. 28
 3.3.2 Fungi species ................................................................................................................. 30
 3.3. α diversity .............................................................................................................................. 31
 3.3.1 species richness ............................................................................................................. 31

 6
3.3.2 Fungi species richness ................................................................................................... 32
 3.4. β diversity .............................................................................................................................. 34
 3.4.1 Plant species composition ............................................................................................. 34
 3.4.2 Fungi species composition ............................................................................................ 35
4. Discussion ...................................................................................................................................... 37
 4.1. Taxonomy classification and comparisons ............................................................................. 37
 4.2. Composition of the sample .................................................................................................... 38
 4.2.1 Plant composition: ......................................................................................................... 38
 4.2.2 Fungi composition ......................................................................................................... 38
 4.3. Analysis of α diversity ............................................................................................................ 39
 4.4. Analysis of β diversity ............................................................................................................ 40
5. Limitations ..................................................................................................................................... 40
6. Conclusion ..................................................................................................................................... 41
7. Bibliography................................................................................................................................... 42

 7
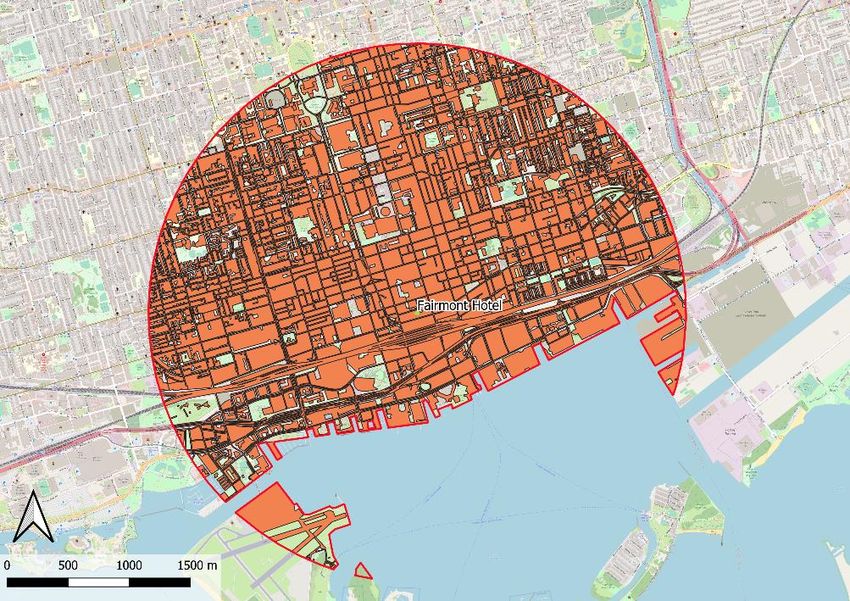
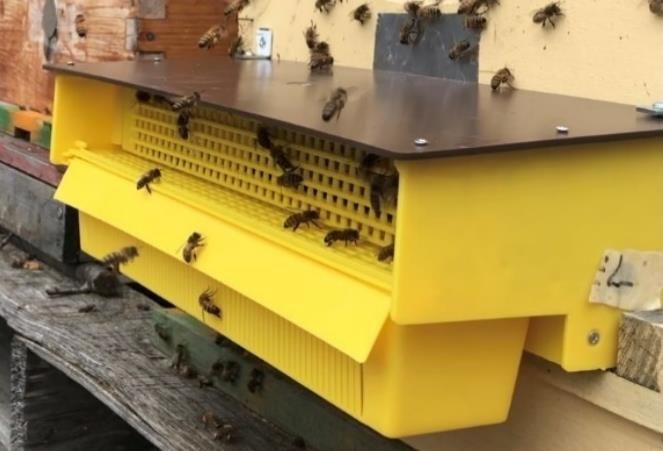
List of Figures
Figure 1: Distribution of the 13 pollen sample collection sites in and around Toronto, Canada (Made
with QGIS using OpenStreetMap & Google Earth - Landsat / Copernicus / NOAA satellites) .............. 19
Figure 2 : Pollen trap installed on a beehive © Scott MacIvor ............................................................. 20
Figure 3: Digitalisation of the urbanised areas in the Fairmont Hotel site (Made with QGIS using
OpenStreetMap).................................................................................................................................... 24
Figure 4 : Percentage of taxa identified a taxonomic rank with 97 % certainty for the 4 different
databases............................................................................................................................................... 26
Figure 5 : Number of distinct families and species identified in the 4 taxonomic results .................... 27
Figure 6: Percentage of Herbaceous - Woody & Native - Exotic species in samples ............................ 29
Figure 7: Percentage of Herbaceous - Woody species (a) and Exotic - Native species (b) according to
the months ............................................................................................................................................ 29
Figure 8: Percentage of Herbaceous - Woody species (a) and Exotic - Native species (b) according to
the Rural-Urban Gradient ...................................................................................................................... 29
Figure 9 - Alpha diversity measures for plants species using the species richness, Shannon and
Simpson indexes. ................................................................................................................................... 32
Figure 10 - Boxplot of the species richness for plant species by month. .............................................. 32
Figure 11 - Alpha diversity measures for fungi species using the species richness, Shannon and
Simpson indexes. ................................................................................................................................... 33
Figure 12 - Boxplot of the species richness for fungi species by month ............................................... 34
Figure 13 - Non-metric multidimensional scaling (NMDS) of plant communities. Each point
corresponds to a sample and is coloured according to the rural-urban gradient with a viridis colour
palette. The month are symbolized by shapes and the seasons are represented by 80% prediction
confidence ellipses determined from Shepard diagram (annexe D). ................................................... 35
Figure 14 - Non-metric multidimensional scaling (NMDS) of fungi communities. Each point
corresponds to a sample and is coloured according to the rural-urban gradient with a viridis colour
palette. The month are symbolized by shapes and the seasons are represented by 80% prediction
confidence ellipses determined from Shepard diagram (annexe D). ................................................... 36

List of Tables
Table 1: Characteristics of the different reference databases used for taxonomic classification ........ 22
Table 2: Sample of the comparison table for the Toronto taxonomic results ...................................... 26
Table 3: Percent of correspondence of plants and fungi species between the Toronto results and the
3 other results ....................................................................................................................................... 27
Table 4: Influences, effects and uses of the top 10 fungi species on their environment (plants,
pollinators and Human)......................................................................................................................... 30

 8
1. Introduction
1.1 Pollinators: Importance and decline
 Demographic growth and climate change place food security at the top of worldwide challenges.
Indeed, food security is essentially linked to pollinators’ existence and their close interactions with
plants (Marshman, Blay-Palmer, and Landman 2019). Agricultural production of fruits, vegetables and
wild flowering plants depends mainly on pollination services provided by animal vectors, which
account for 85-90% of the sexual reproduction of flowering plants (van der Sluijs and Vaage 2016;
Ollerton, Winfree, and Tarrant 2011). Pollination is responsible for approximately one third of the
world food production volume, and 40% of the nutrient supply (van der Sluijs and Vaage 2016;
Marshman, Blay-Palmer, and Landman 2019; Eilers et al. 2011). This reliance depends on the climate
zone, varying from 78% for tempered areas to 94% for tropical ones (Ollerton, Winfree, and Tarrant
2011). In addition to that, they are indispensable to transfer essential micronutrients, vitamins and/or
minerals between flowers for human diet. Their extinction is of great concern.

Pollination services are provided by numerous and diversified animals. The most symbolic ones are
insects such as bees, bumblebees, butterflies and hoverflies. Moreover, birds (colibri), mammals (bats)
and other animals with coats could be another biotic vector of pollination. Somes scientists
hypothesise that in cities the possible negative impact that bee colonies, if present in excess, could
have on wild pollinator populations as a result of strong competition for the same food resource
(Ropars et al. 2019) It is therefore important to moderate the introduction of domesticated species for
the benefit of wild species.

Scientists agree that the world is currently facing its sixth mass extinction. Numerous studies highlight
the alarming rate of biodiversity loss over the past centuries (Nazarevich 2015; Oke et al. 2021;
Samways 2017; Wagler 2017) specially due to anthropogenic pressures (Cardinale et al. 2012). Land-
use change (Otto et al. 2016), habitat loss, fragmentation and/or degradation, pollution, landscape
homogenisation, electromagnetic waves (Favre 2011; Kumar et al. 2020), agricultural intensification,
pathogens and parasites (Varroa mites, Nosema sp.) (Sandhu et al. 2016; Tantillo et al. 2015),
introduction of non-natives bees, fungicides and pesticides (Goulson et al. 2015) have been highlighted
as potential threats to pollinator survival. In general, it is a combination of some of these threats that
leads to irreversible and damaging consequences to pollinator populations. In the short-term, land use
for urbanisation shows a negative impact on pollinators such as honeybees, but in the long-term,
colonies set up in urban areas are stronger and more resistant to certain parasitic fungi such as Nosema
sp. (Samuelson, Gill, and Leadbeater 2020). The nutritional quality and the richness of pollen is also
higher compared to rural areas. Pollinator’s loss also creates disturbances affecting ecosystem
resilience and sustainability. In China, productors have to hire people to recreate pollination services
due to the lack of pollinators, which is less effective in terms of economy and sustainability (van der
Sluijs and Vaage 2016). One study estimates the annual economic value of pollination at €153 billion
(Gallai et al. 2009). Humans are therefore highly dependent on their environment.

1.2 Apis mellifera L.
 1.2.1 Description of the species
A. mellifera is an insect belonging to the Hymenoptera order and the family Apidae family that was
endemic to three regions: Europe, Africa and the Near East. The species have been introduced to other
continents through the years by human activities (Eickwort 1990). Today, the endemic European

 9
honeybee is found on every continent except Antarctica. The evolution of honeybees, as well as other
pollinator insects, is correlated with angiosperm species, as one cannot live without the other. This
mutualistic relationship has been implicated in the biodiversity of both kingdoms, reproduction and
the evolution of plant traits (Sauquet et al. 2017; Bronstein, Alarcón, and Geber 2006).

Among all the pollinator species existing in the world, the honeybee is one of the most effective in
pollination services. it has therefore been domesticated and managed mainly for agricultural and
environmental purposes (Pirk, Crewe, and Moritz 2017). For example to play the role of a bio-indicator,
a biomarker to monitor the quality of the environment ((heavy-)metal concentration (Zaric et al. 2018;
Sadeghi et al. 2012), presence of metallothioneins and pesticides (Badiou-Bénéteau et al. 2013)) , a
pollinating agent or a biological control agent (delivery of fungicide, for example against grey mold
Botrytis cinerea Pers. on strawberries) (Hokkanen, Menzler-Hokkanen, and Lahdenpera 2015).

 1.2.2 Honeybees’ colonies
A. mellifera belongs to the eusocial bees. Several generations of honeybees live in society and share
the work for the well-being of the colony (Nimmo 2015). Honeybees are organised in different castes
to allocate tasks necessary for their survival. Depending on their caste, individuals have developed
morphological, physiological and behavioural adaptations to carry out their work (Wright, Nicolson,
and Shafir 2018). The first division separates females and males. Female individuals are split in
reproductively viable (queens) and non-reproductively viable (workers) subdivisions. The division of
males, also called drones, corresponds to less than 2% of the hive population whose only role is to
fertilise the queen. Once they are no longer useful, they are driven out of the hive (Schönleben et al.
2007). The future queen is selected by workers among the larvae. Once selected, the larva receives a
special diet of large quantities of royal jelly (Schönleben et al. 2007). The queen, responsible for
reproduction, lays around 1000 to 2000 eggs daily (Münch and Amdam 2010). Depending on the needs
of the colony, the queen will either produce drones (unfertilised eggs) or workers (fertilised eggs)
(Nimmo 2015; Schönleben et al. 2007). When the reproduction rate of the actual queen drops and
jeopardises the survival of the colony, workers select a new larva. Workers perform a variety of tasks
such as maintaining the hive, rearing larvae, providing water to regulate the temperature of the hive,
foraging and producing honey, locating food sources or new places to set up a new colony, etc (Nimmo
2015).

Honeybees’ societies, which could be associated with the image of a superorganism, have a complex
organisation based on several means to communicate. Chemical and olfactory communications take
place through the secretion of different types of pheromones (Moritz and Fuchs 1998; Münch and
Amdam 2010; Nimmo 2015). Two kinds of pheromones can be secreted, primers and releasers. Primers
are intended to modify the behaviour of bees in the long term (e.g. to inhibit reproduction of workers).
The latter have a short-term effect to induce an immediate change in behaviour (Trhlin and Rajchard
2011; Paoli and Galizia 2021). In the case of bees, each caste produces different pheromones to
regulate the activity of the colony and promote social cohesion. Olfactory communication is not only
used to interpret the information transmitted by the colony's pheromones but also to detect and
analyse the odours in their environment. These may be associated with danger or food sources (Paoli
and Galizia 2021; Suwannapong, Michael, and Eric 2012). They also use dance languages to share their
foraging strategies according to floral composition in their environment and to find potential nesting

 10
sites. Through this communication, workers transmit a kind of map including distances and directions
to the desired sites (S. Zhang, Si, and Pahl 2012; Suwannapong, Michael, and Eric 2012; Menzel, De
Marco, and Greggers 2006).

Honeybees’ lifespan varies according to the needs of the colony, the caste and the environment of
work of the individuals in it, ranging from a few weeks to a few years. This ageing plasticity is a
characteristic of eusocial insects and is linked to floral resources (Münch and Amdam 2010). The
workers' tasks are assigned according to age, this organisation is called the polytheism of castes. Young
workers start with tasks inside the beehive such as rearing, cleaning and storing pollen. After 2 to 3
weeks, they can be assigned to foraging activities outside the beehive (Winston 1987).

In temperate climates, A. mellifera populations differ within the year. Indeed, worker bees are divided
into two seasonal groups: winter bees and summer bees that have differences in behaviour,
physiology, longevity and immunology (Kunc et al. 2019; Steinmann et al. 2015). The lifespan of the
winter populations can go up to eight months compared to the summer populations which live up to
one month and a half. Therefore, colony collapse disorder which occurs mainly in winter can strongly
impact colony survival (Kunc et al. 2019).

Nutritional requirements of the colony differ during the year and according to seasonal population,
caste and age of the individuals. Winter bees survive thanks to the food collected and stored as honey
or beebread by summer bees. Some cases of cannibalism have been observed in colonies when protein
was scarce in winter (Crailsheim 1990). The development, productivity and survival of bees and
colonies depend on the presence of various nutrients in their food such as carbohydrates, proteins,
lipids, vitamins and minerals and on water (Haydak 1970; Brodschneider and Crailsheim 2010). The
nutritious quality of the food relies on the diversity of pollen and nectar foraged and stored (Di
Pasquale et al. 2013). However, this quality is reduced by the drying of the food during storage (Haydak
1970).

 1.2.3 Foraging activities
One of the most important tasks of honeybees is to provide food for the colony throughout the year.
For this, the workers are willing to sacrifice their fitness for the survival of the colony (Moritz and Fuchs
1998). As honeybees are generalist foragers, they will visit many plant species to diversify the pollen
and the nectar collected. They also harvest water and plant resins called propolis (Louveaux 1958;
Seeley 1985). If food is abundant, it is not impossible that they select the species they will visit (Nicholls
and Hempel de Ibarra 2017; Wright, Nicolson, and Shafir 2018). But if the quality and/or quantity of
pollen is insufficient, the foragers will compensate for this deficit by increasing the amount of pollen
collected (Pernal and Currie 2001). For this purpose, bees visit more plants, more species, which
increases the probability of transmission of parasites and pathogens, such as the parasitic fungus
species Nosema apis Zander, to foragers and colonies (Figueroa et al. 2019). As honeybees visit four
time more flowers than to solitary bees and hoverflies, they can be an important threat to their species
and wild native bees (Albrecht et al. 2012).

Foraging is not only beneficial to honeybees but also to flowering plants as they are in a mutualistic
relationship. Indeed, plant species provide pollen and nectar to bees as a reward to ensure the cross-
breeding between flowers (Marshman, Blay-Palmer, and Landman 2019; Nicholls and Hempel de

 11
Ibarra 2017). Several plant species have developed adaptations or behaviours to attract particular
pollinators by releasing chemical and olfactory signals or by adopting colours or morphological shape
(the Orchidaceae family is a great example) (Piñeiro Fernández et al. 2019).

Pollen and nectar are the main components of their diet. Pollen is the primary source of protein to
support the proper development of individuals and the only supply of nitrogenous elements, it is also
rich in lipids and sugar (Deveza et al. 2015). Nectar, constituted of carbohydrates, is essential to provide
energy for activities of the colony (Louveaux 1958). As the need for nectar is greater than the need for
pollen, more workers are specialised in collecting nectar only (Pernal and Currie 2001). This ratio of
pollen-collecting workers, nectar-collecting workers and workers able to collect both is adapted to the
needs of the colony and the time of year (Pernal and Currie 2001). At the same time, all the flowers do
not produce nectar and pollen (Von Frisch 1967). Pollen collections are carried by foragers in what is
called “pollen basket” located on their hind legs (Hodges 1952). Nectar collections are collected thanks
to their tongue.

For their first exit from the hive, foragers study their immediate environment to spot spatial landmarks,
new food sources, analyse floral composition (including the nutritional quality of their pollen and
nectar) to optimize their works and their movements for future collections. Once back at the hive,
foragers recruit new workers and share their navigational memory and foraging strategies with them,
through the waggle dance (S. Zhang, Si, and Pahl 2012). The forager can inform the recruits of the
presence of a flowering site by detailing the distance to the hive and the direction to the sun (Seeley
1985; Von Frisch 1967). The agitation caused by the waggle dance results in the dispersion of pollen
odours which are also used to determine whether the forager is moving towards or away from the
target site (Von Frisch 1967).

Foraging activities are highly dependent on the weather and the time. Temperature and relative
humidity are the main factors which have an impact on the realisation of this task (Vasudeva and
Lokesha 1993; Abou-Shaara et al. 2017). The availability of food depends on the flowering period of
the plant species, so foraging activities are quite limited in time. As these activities cost a lot of energy,
the workers do not have the possibility to travel too far from the hive. Generally, foragers collect as
close to their hive as possible (less than one kilometre), but as the flowering season draws to a close,
they must venture further afield to meet the colony's needs (Beekman and Ratnieks 2000)

 1.2.4 Honeybees, a vector of micro-organisms
Like plants and in addition to abiotic vectors, several micro-organisms and pathogens, such as fungi,
oomycetes, bacteria, yeasts and viruses, have also adapted to make their dispersal by pollinators
possible. Flowering plants offer a unique microbiome, providing microbial communities a suitable host
for their development and proliferation, which is visited by pollinators serving as vectors to colonise
new hosts (Binoy 2018; Trivedi et al. 2020). Some plant pathogens can influence plant-pollinator
interactions by altering the attractive traits of flowering plants or by replacing pollen by sporidia in the
anther sacs (Schäfer et al. 2010). During foraging activities, bees can carry fungal microorganisms from
flower to flower or from flower to hive via the nectar and/or pollen they collect, or via their bodies.
Floral nectar is known to be composed by a high abundance and diversity of bacterial and yeast
communities able to withstand high sugar levels in nectar (Aizenberg-Gershtein, Izhaki, and Halpern
2013; Mcart et al. 2014). Pollen is considered as a unique microhabitat for micro-organisms

 12
communities, which are essential for the long-term preservation of the stored pollen and for meeting
the nutritional needs of bees (Dharampal et al. 2019).

Once these microbial individuals have been transferred to new plant hosts, they will enter the plant
either by taking advantage of an existing opening (fungi, bacteria) or by penetrating the host directly
(fungi), or via vectors such as insects (viruses) (Card, Pearson, and Clover 2007). While most of the
micro-organisms are carried on the pollen, viruses can be found inside the pollen. This happens when
the virus has infected a plant and modified its reproduction (Card, Pearson, and Clover 2007). However,
there is little information on the transmission of viruses to subsequent generations in plant species
(Binoy 2018). Although these microbial communities can have a significant negative impact on
agricultural yields and crops quality, causing, along with insect damage, the loss of about 20% of the
world's crops (Bebber and Gurr 2015; Fisher, Gow, and Gurr 2016), the relationship between these
individuals and the host plant is not always detrimental, but it can also be neutral or beneficial for
plants (Scortichini and Katsy 2014; Trivedi et al. 2020). Plants-microbiota association confers beneficial
traits to their host, such as promoting plant growth and health, helps them to cope with the abiotic
stresses they encounter (Rodriguez et al. 2019; Trivedi et al. 2020; Vannette 2020).

Interactions between microbial communities and bees can be of several types and can result in both
benefits and harms: an example of mutualistic relationships is that plant microbiota provide immunity,
keeping the bees healthy by constituting a source of nutrients in floral nectar and pollen in exchange
for the dispersal achieved by the bees. The presence of microbes in pollen is essential for the proper
development, health and survival of larvae and honeybees (Dharampal et al. 2019). Other microbes
can threaten the fitness, the longevity of the colony, the bee brood and the honeybee welfare (Tantillo
et al. 2015; Mcart et al. 2014). It is the case of the parasitic fungus N. apis, some single-strand RNA
viruses of the Dicistroviridae and Iflaviridae families (Tantillo et al. 2015). In combination with abiotic
factors, these pathogens can be the one of the causes of epidemic phenomena such as CCD, colony
collapse disorder, which leads to the loss of bee colonies through hive desertion. The presence of the
ectoparasitic mite Varroa destructor, vector of viruses such as ABPV (Acute Bee Paralysis Virus) and
DWV (Deformed Wing Virus), strongly increases these loss phenomena, becoming the first cause of
CCD (Posada-Florez et al. 2020; Nazzi et al. 2014; Kang et al. 2015). A study highlighted the rapidity
with which this species parasitizes foragers when the mite is found on flowers (about 49% of the mites
studied infested the bee on first contact). However, it is difficult to quantify this mode of transmission
and to define whether it is possible that it occurs in the opposite direction, from the bee to the flower
(Peck, Smith, and Seeley 2016).

Honeybees have developed defences by collecting propolis that have antiseptic properties against
certain microbial communities. For example, ferulic acid acts as an antimicrobial agent against various
viruses, bacteria and fungi (Seeley 1985).

1.3 Urban beekeeping
The exponential growth of the world's population is accompanied by rapidly expanding urbanisation
and an increase in the area devoted to agriculture and industries. This land-use change leads to the
fragmentation of natural environments and the alteration of their connectivity, disrupting the balance
of ecosystems. It also has a strong influence on the life habits of pollinators (Sari 2020; Z. Liu, He, and
Wu 2016; Wilson et al. 2016; Otto et al. 2016). The availability of food and habitat for new hives
becomes scarce, forcing pollinators to travel longer distances to cover the needs of the colony.

 13
Moreover, rural areas are gradually becoming less hospitable to them than cities as a result of
homogenisation of the landscape (in terms of floral resource) and the use of pesticides (Ollerton et al.
2014).

In this context, urban beekeeping emerged and became more present worldwide. Initially imported to
produce bio products such as honey and wax for centuries (Kohsaka, Park, and Uchiyama 2017),
honeybees are nowadays used mainly to compensate for the lack of wild pollinators to provide
pollination services for agricultural projects. A. mellifera is strongly associated with biodiversity
protection projects, this image has made it very popular with city dwellers to the point that it is
considered a MIMS., a massively introduced Managed Species (Geslin et al. 2017). Honeybees are also
considered as a threat to local wild pollinators by competing for the same food resources and
ecological niche (McCune 2018) and by being a possible vector of diseases (Douglas B. Sponsler and
Bratman 2020; Fürst et al. 2014).

In the past, cities were considered to be an unfavourable environment for all pollinators due to the
low availability of floral resources and nesting sites (Bates et al. 2011). However, recent studies
highlight that pollinator species richness is higher in rural than in urban areas, except for the Apis genus
of the Hymenoptera family that acclimatise well in the urban environment (Theodorou et al. 2020;
Marquardt et al. 2020). The low pesticide use and localized abundance of plant diversity through the
importation of ornamental plants provides a more hospitable environment than the monocultures
found in rural areas, especially if these environments are connected by ecotones (Theodorou et al.
2020; Marquardt et al. 2020; Lowenstein, Matteson, and Minor 2019). However, the temperature of
cities is not suitable for all pollinators, and its concrete environment and manicured parks limit nesting
opportunities. All these factors favour generalist eusocial species living in hives whose behavioural
plasticity allows them to adapt more easily to anthropized and disturbed environments (McCune
2018).

Green spaces and vegetated infrastructures in the cities therefore have an important role to play in
welcoming pollinators to the city, both for beekeeping and wildlife. It is essential to rethink the
management of these environments to make them more attractive for both society and biodiversity.

1.4 Plants and Fungi metagenomic from pollen sample
 1.4.1 The advent of bioinformatics
In order to determine the current state of ecosystems and the quality of services provided to humans
such as pollination, scientists can rely on biodiversity index such as the presence/absence and the
abundance of indicator species essential to the proper functioning of these environments (Pavan-
Kumar, Gireesh-Babu, and Lakra 2015). One of the techniques used to identify these species is to carry
out floristic and faunal surveys based on visual identification in the field. For micro-flora and micro-
fauna organisms or elements such as pollen, fungi spores, bacteria and microbes, identification is more
complex. For this, palynology, the study of pollen grains and spores, is employed. Once collected and
prepared, the samples are analysed under the microscope, then, pollen grains and spores are classified
using dichotomous keys and compared to reference collections (Galimberti et al. 2014). However,
these methods are time-consuming, need to be carried out at times of the year when species can be
accurately identified (for surveys in the field), do not allow species identification of large numbers of
samples or surveys with high taxonomic accuracy, and require specialists in palynological, taxonomic,
botanical and zoological sciences (even in this case, the identification is still subjective), etc. (Bell et al.

 14
2017; Gous et al. 2019). To overcome these problems, scientists from all fields of study have
investigated several areas.

One of the most promising areas is the study of molecular biology and ecology of the species using
bioinformatics tools, investigated since the 1980s. From this point on, DNA can be analysed for
taxonomic purposes by recognising short gene sequences, called barcodes, thanks to the amplification
of genetic markers, called primers. These barcodes are unique to each species (Kress et al. 2015; Kress
and Erickson 2008). This approach, called DNA barcoding, does not allow the identification of more
than one species at a time (Pavan-Kumar, Gireesh-Babu, and Lakra 2015), the barcode reading
technology used being Sanger sequencing (L. Liu et al. 2012). It has therefore been coupled with
bioinformatic tools, such as Next-Generation Sequencing (NGS) technologies, allowing the
simultaneous sequencing of reads and, consequently, the identification of all taxa present in a sample,
reducing analysis time and giving results with high taxonomic resolution (L. Liu et al. 2012; Pavan-
Kumar, Gireesh-Babu, and Lakra 2015; Gous et al. 2019). Originally used to identify microbial
communities, this approach, called DNA metabarcoding, has been extended to other kingdoms such
as plant or fungal kingdoms. However, this method also has drawbacks, it cannot work if the reference
database is not complete enough, it can only give qualitative information of the ecosystem
composition of fauna and flora.

 1.4.2 Pollen and spore DNA metabarcoding
DNA metabarcoding analysis consists of four steps: DNA extraction, amplification, sequencing and
analysis (Keller et al. 2015). Firstly, DNA is extracted from the sample collected and prepare for the
next step. Then, searchers select the primer (a standardized barcode marker of the genome) to isolate
and amplify it through the PCR method. The amplicons obtained are then read to determine their
nucleotide order using Next-generation sequencing technologies and classified according to their base
sequences (Bell et al. 2017). These sequences are compared with an adapted and exhaustive reference
database (depending on the primers, the species studied), enabling them to be assigned a taxonomy
and subsequently to carry out biodiversity analysis or to highlight the presence of certain species such
as pathogens, parasites, indicators or invasive species (Hebert and Gregory 2005). This information
obtained through the new applications of DNA metabarcoding analysis can provide support for the
management of natural areas, ecosystems and biodiversity in general (Bell et al. 2016; Kress et al.
2015).

Advantages and drawbacks of plants and fungi primers
Environmental DNA (eDNA) samples, such as pollen sample, are generally multi-species from several
kingdoms (e.g. plant and fungal kingdom, etc). It is therefore necessary to test which classification
techniques and which primers are the most suitable to perform taxonomic assignment and biodiversity
analysis according to the aims of the study (Gous et al. 2019).

For plant kingdom, several genetic marker regions can be used as primer. The first type of primers is
based on DNA region of plastid genome such as the rbcL, matK, trnL and trnH-psbA markers, the second
type is based on a region of the nuclear ribosomal DNA called the internal transcribed spacers (ITS)
(Gous et al. 2019; Hollingsworth, Graham, and Little 2011; Kress et al. 2015; Bell et al. 2016). The rbcL
marker is easily amplified by PCR but is not one of the best for taxonomic resolution, unlike the matK
marker (better resolution but more complicated amplification). To improve analysis for taxonomic
purposes, these two markers are often combined and have several barcoding applications

 15
(Hollingsworth, Graham, and Little 2011). For certain land plant species, the trnH-psbA marker offers
a better discrimination rate and taxonomic resolution and is easy to amplify than the rbcL-matK
combination but has a weakness during sequencing, leading to problems of unidirectional reads
(Hollingsworth et al. 2009). The trnL marker shows a lower resolution than the other markers because
of the low intraspecific variation of the trnL intron, not allowing a biodiversity analysis to be carried
out afterwards. To compensate, this marker has some advantages: the high conservation of the
primers used for amplification make this procedure very robust and the exhaustive trnL database that
already exists for the species identification (Taberlet et al. 2007).

Compared to the first type of primers, which can be used to identify species which have chloroplasts
(plants and algae), the ITS region is known as one of the major DNA barcode markers for plants and
the universal one for fungi (Schoch et al. 2012). However, it shows less efficiency for animal
identification (X. C. Wang et al. 2015). The ITS region can be divided into two markers, the ITS1 and
ITS2 subregions. Both allow for high taxonomic resolution (down to the species level) but ITS1 is more
efficient for species discrimination, for PCR amplification (due to ITS-u1 and ITS-u2 allowing for higher
matching success) and for sequencing (due to their lower CG content in the base sequence) than the
ITS2 region for eukaryotic species (Cheng et al. 2016; X. C. Wang et al. 2015; Kress et al. 2005).

The identification of multiple species by a single primer can reduce the risk of prediction error in
taxonomic assignment (Gous et al. 2019; Schoch et al. 2012). ITS region has the advantage to have a
high resolution of inter- and intraspecific variability, even if the DNA sample is degraded (Cheng et al.
2016). For fungal kingdom, other barcode markers can be used such as the nuclear ribosomal DNA
region called the large subunit 25-28S RNA (LSU) (Oh et al. 2014), or the small subunit 18S RNA (SSU)
(Demirel 2016). Among these primers, SSU shows the lowest taxonomic resolution, the two others give
similar taxonomic results (Brown, Rigdon-Huss, and Jumpponen 2014; Demirel 2016).

Taxonomy analysis – OTU vs ASV
Taxonomy assignment can be performed thanks to microbiome bioinformatics platforms such as
Qiime2 (Quantitative Insights Into Microbial Ecology vers. 2). DNA metabarcoding analysis allows two
different methods of taxonomy analysis : the construction of operational taxonomic units (OTUs)
thanks to UCLUST and UPARSE pipelines and the classification under the amplicon sequence variants
(ASVs) name thanks to DADA2, Deblur or UNOISE pipelines (Callahan, McMurdie, and Holmes 2017;
Caruso et al. 2019). OTU clustering approach gathers read sequences that have less than 3% of
dissimilarities. This consensus sequence created limits the influence of sequencing errors (Blaxter et
al. 2005). However, it also generates a bias, by grouping certain sequences, although highly similar,
under the same OTU. Depending on the OTU clustering technique used (de novo, open or closed
reference), OTUs can be compared or not to other samples or studies (Callahan, McMurdie, and
Holmes 2017).

To overcome these drawbacks, researchers have developed other denoising pipelines, whose output
files are the ASV table (Callahan et al. 2016; Caruso et al. 2019). The ASV approach does not aim to find
a consensus but identifies the exact sequences and counts the number of times they appear in the
sample which avoids the creation of a bias due to the clustering as for OTUs. ASV can therefore be
compared to other samples of amplicons or other studies and do not depend on reference dataset. A
de novo process is used to differentiate sequencing errors from the biological variability of ASV, as
errors are less likely to occur in large numbers in a sample. ASV also shows a higher taxonomic
resolution and accuracy than OTU clustering (Callahan, McMurdie, and Holmes 2017; Callahan et al.

 16
2019). Finally, each OTU/ASV is read and assigned to a species and a pairwise identity score to state
the probability of identification according to the reference dataset.

Taxonomy analyses – taxonomic classifier
Once these OTUs/ASVs have been obtained, taxonomic assignment is carried out by means of
algorithms. Depending on the desired resolution and the type of studies conducted, one algorithm can
be preferred to another as they offer various taxonomic classification performances (Bokulich et al.
2018). Among the most used alignment-based classifiers for marker-gene amplicon sequences, there
are the VSEARCH and BLAST consensus classifiers and the Naive Bayes classifier.

VSEARCH-based consensus classifier is based on heuristic reasoning by performing an alignment and
by counting how many nucleotides the OTU/ASV has in common with the reference sequences and
assigns the consensus taxonomy corresponding to these reference sequences. Once the entire
database has been read, the best match is selected (Rognes et al. 2016).

BLAST-based consensus works in a similar way to VSEARCH but instead of taking only the best match
it will associate to each OTU/ASV a top of N potential species with the first N percentage of identity
exceeding a given percentage of identity threshold (the number N of hypothetical species and the
percentage are defined by the controller). This method will therefore not scan the entire reference
database (Camacho et al. 2009).

Compared to the other two algorithms, the Naive Bayes classifier does not rely on consensus. This
classifier will apply Bayes' theorem by making the "naive" assumption of conditional independence
between features that can identify a nucleotide sequence (Q. Wang et al. 2007). Although considered
simplistic, this classification offers good taxonomic results that can compete with other classifiers.
However, it requires training of the classifier with the reference database to improve confidence in the
taxonomic classification obtained (Newton and Roeselers 2012).

1.5 Objectives
Over the years, the world population continues to grow. It is predicted that it will exceed 8 billion by
2023. To house and feed this growing population, cities are expanding, natural areas are being
fragmented and converted to crops, upsetting the balance of ecosystems and threatening global
biodiversity. By 2030, cities will be home to around 5 billion people (Ash et al. 2008). Consequently,
the management of anthropized environments, whose landscape matrix is highly fragmented, and the
maintenance of biodiversity in them are becoming a major issue in the creation/expansion of cities.

Urban green spaces in actual cities constitute a small percentage of the land use and only few streets
and buildings are vegetated. These are the only source of food for pollinators, which are so important
for the proper functioning of our society. Ecosystem services created by these environments are
essential not only for fauna and flora by providing food, ecological niche but also for the quality of life
of the inhabitants, the quality of the environment (air, temperature, CO2 capture), the economy, etc
(Loures, Santos, and Panagopoulos 2007; J. Zhang et al. 2019). Urban parks and vegetated places are
also the site of a high concentration of microorganisms, such as fungi, because of the presence of
plants which provide them an unique microbiome (Kasprzyk et al. 2021). They can be vectored by
pollinators, other animals or the air. The transmission of these fungi can have a beneficial, neutral or
detrimental impact on flowering plants, crops, bee colonies, other pollinators, as they compete for the
same limited food resource, and humans because of their allergenic properties (Kasprzyk et al. 2021).

 17
Vous pouvez aussi lire