River Incision in Relation to Post-Glacial Events in the Humber River Basin, Ontario Incision des cours d'eau par les événements post-glaciaires ...

La page est créée Audrey Francois
 
CONTINUER À LIRE
River Incision in Relation to Post-Glacial Events in the Humber River Basin, Ontario Incision des cours d'eau par les événements post-glaciaires ...
Document généré le 10 fév. 2022 14:04

Géographie physique et Quaternaire

River Incision in Relation to Post-Glacial Events in the Humber
River Basin, Ontario
Incision des cours d’eau par les événements post-glaciaires
dans le bassin de la rivière Humber, Ontario
Roger T.J. Phillips et André Robert

Volume 59, numéro 1, 2005                                                          Résumé de l'article
                                                                                   La morphologie des vallées dans le bassin de la rivière Humber découle
URI : https://id.erudit.org/iderudit/013734ar                                      essentiellement des processus ayant agi durant les derniers 13 000 14C BP.
DOI : https://doi.org/10.7202/013734ar                                             Certains segments de vallées présentent des caractéristiques uniques,
                                                                                   particulièrement en ce qui a trait à la morphologie en plan : les boucles et les
Aller au sommaire du numéro                                                        méandres. Dans cette étude, l’évolution des vallées du bassin de la rivière
                                                                                   Humber au cours de l’Holocène et à la fin du Wisconsinien est étudiée de façon
                                                                                   à déterminer les changements morphologiques et leur évolution vers leur
                                                                                   forme actuelle. Des datations au 14C et des modèles d’élévation de terrain
Éditeur(s)
                                                                                   indiquent que la majeure partie de l’incision des vallées s’est produite durant
Les Presses de l'Université de Montréal                                            ou peu après la déglaciation régionale. Les composantes des méandres de
                                                                                   vallées et les patrons des terrasses fluviatiles indiquent que la morphologie
ISSN                                                                               actuelle des vallées est attribuable à des rivières ancestrales plus larges. Outre
                                                                                   le rôle attendu des apports en eau de fonte associés à la déglaciation soient
0705-7199 (imprimé)                                                                attendues, il est probable que les effets climatiques et hydrogéologiques des
1492-143X (numérique)                                                              changements du niveau d’eau des lacs proglaciaires aient aussi joué un rôle
                                                                                   dans l’évolution des vallées du bassin de la rivière Humber.
Découvrir la revue

Citer cet article
Phillips, R. T. & Robert, A. (2005). River Incision in Relation to Post-Glacial
Events in the Humber River Basin, Ontario. Géographie physique et
Quaternaire, 59(1), 17–30. https://doi.org/10.7202/013734ar

Tous droits réservés © Les Presses de l'Université de Montréal, 2006              Ce document est protégé par la loi sur le droit d’auteur. L’utilisation des
                                                                                  services d’Érudit (y compris la reproduction) est assujettie à sa politique
                                                                                  d’utilisation que vous pouvez consulter en ligne.
                                                                                  https://apropos.erudit.org/fr/usagers/politique-dutilisation/

                                                                                  Cet article est diffusé et préservé par Érudit.
                                                                                  Érudit est un consortium interuniversitaire sans but lucratif composé de
                                                                                  l’Université de Montréal, l’Université Laval et l’Université du Québec à
                                                                                  Montréal. Il a pour mission la promotion et la valorisation de la recherche.
                                                                                  https://www.erudit.org/fr/
River Incision in Relation to Post-Glacial Events in the Humber River Basin, Ontario Incision des cours d'eau par les événements post-glaciaires ...
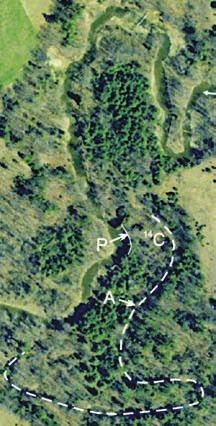
GPQ_59-1.qxd   15/09/06      13:26      Page 17

           Géographie physique et Quaternaire, 2005, vol. 59, no 1, p. 17-30, 14 fig., 3 tabl.

           RIVER INCISION IN RELATION
           TO POST-GLACIAL EVENTS
           IN THE HUMBER RIVER BASIN, ONTARIO
           Roger T.J. PHILLIPS and André ROBERT*; Departement of Geography, York University, 4700 Keele Street, Toronto, Ontario
           M3J 1P3, Canada.

           ABSTRACT River valleys in the Humber River drainage basin have             RÉSUMÉ Incision des cours d’eau par les événements post-
           derived most of their morphology from processes occurring over the         glaciaires dans le bassin de la rivière Humber, Ontario. La morpho-
           last 13 000 14C BP. Some of the valley reaches possess very distinct       logie des vallées dans le bassin de la rivière Humber découle essen-
           characteristics in terms of plan-view morphology, such as valley mean-     tiellement des processus ayant agi durant les derniers 13 000 14C BP.
           dering and loop features along the valley sides. In this study, the val-   Certains segments de vallées présentent des caractéristiques
           ley morphology and stratigraphy of the upper Humber River basin are        uniques, particulièrement en ce qui a trait à la morphologie en plan :
           examined in order to assess the character of post-glacial valley evo-      les boucles et les méandres. Dans cette étude, l’évolution des val-
           lution. Existing knowledge of late Wisconsinan and Holocene events         lées du bassin de la rivière Humber au cours de l’Holocène et à la fin
           has been considered to place this valley evolution into a regional         du Wisconsinien est étudiée de façon à déterminer les changements
           context. Radiocarbon dating and digital elevation models suggest that      morphologiques et leur évolution vers leur forme actuelle. Des data-
           the majority of valley incision occurred during or soon after regional     tions au 14C et des modèles d’élévation de terrain indiquent que la
           deglaciation. Looping valley features and terrace patterns indicate        majeure partie de l’incision des vallées s’est produite durant ou peu
           that most valley morphology can be attributed to larger ancestral          après la déglaciation régionale. Les composantes des méandres de
           rivers. Although direct melt-water contributions are expected due to       vallées et les patrons des terrasses fluviatiles indiquent que la mor-
           deglaciation, it is suggested that other processes due to the climatic     phologie actuelle des vallées est attribuable à des rivières ances-
           and hydrogeologic effects of fluctuating proglacial lake levels also       trales plus larges. Outre le rôle attendu des apports en eau de fonte
           played a role.                                                             associés à la déglaciation soient attendues, il est probable que les
                                                                                      effets climatiques et hydrogéologiques des changements du niveau
                                                                                      d’eau des lacs proglaciaires aient aussi joué un rôle dans l’évolution
                                                                                      des vallées du bassin de la rivière Humber.

           Manuscrit reçu le 8 juin 2005; manuscrit révisé accepté le 29 mai 2006 (publié le 3e trimestre 2006)
           * E-mail address: arobert@yorku.ca
River Incision in Relation to Post-Glacial Events in the Humber River Basin, Ontario Incision des cours d'eau par les événements post-glaciaires ...
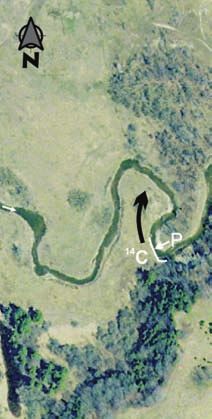
GPQ_59-1.qxd    15/09/06    13:26    Page 18

           18                                                                                                          R.T.J. PHILLIPS and A. ROBERT

                                 INTRODUCTION                                        significant challenge is associated with the patterns and rates
                                                                                     of isostatic rebound. This makes correlation of basin and
              Late Wisconsinan events in the area corresponding to the
                                                                                     regional water levels difficult, as the only true reference point
           contemporary Humber River drainage basin played a signifi-
                                                                                     is the centre of the earth. Despite these uncertainties, regional
           cant role in landscape evolution and had long-lasting effects on
                                                                                     post-glacial events would have implications for patterns of flu-
           valley morphology in the basin. In particular, topographic and
                                                                                     vial erosion and drainage over newly exposed basin surfaces.
           sedimentary characteristics in the area of the Oak Ridges
                                                                                     Late Wisconsinan deglaciation in the Lake Ontario basin is
           Moraine may have had a prominent influence on the fluvial
                                                                                     characterized by events such as the formation of the Oak
           activity of melt-water during deglaciation. Water at the melting
                                                                                     Ridges Moraine and the impoundment of glacial Lake Iroquois
           edges of the Laurentide Ice Sheet tended to form large
                                                                                     (Fig. 1); however, these events are also associated with other
           proglacial lakes, and their topographic confinement was
                                                                                     deglaciation activities in Southern Ontario.
           accentuated by isostatic depression. However, the effects of
           these glacial lakes may not be completely understood simply                   As the Oak Ridges Moraine was formed, deposition between
           by their extent and the location of their outlet. Initial fluvial         these lobes left behind a complex stratigraphy of sediments,
           processes occurring on deglaciated surfaces would have                    which may also have been influenced by melt-water ponding
           responded to the dynamic atmospheric and hydrogeologic                    between the lobes and the Niagara Escarpment at the west-
           conditions driven by such large amounts of ponded water.                  ern edge (Duckworth, 1979; Chapman and Putnam, 1984;
              As the Laurentide continental ice sheet retreated from                 Chapman, 1985). Described as an interlobate moraine, the strat-
           southern Ontario, the action of ice lobes resulted in the for-            ified moraine complex is thought to have formed over a number
           mation of moraines and the impoundment of proglacial lakes.               of stages, with a sequence from subglacial sedimentation, to
           Evidence of these proglacial lakes is recorded not only in sed-           subaqueous fan and delta sedimentation, to ice-marginal sedi-
           iments, but also in many exposed shoreline bluffs throughout              mentation (Chapman, 1985; Barnett et al. 1998). The resulting
           the Great Lakes region (Terasmae, 1980; Chapman and                       feature is a topographic high extending approximately 160 km
           Putnam, 1984; Sly and Prior, 1984; Anderson and Lewis,                    east to west and acting as a drainage divide between present
           1985; Muller and Prest, 1985). Interpretation of deglacial and            day Lake Ontario and drainage to the north (Barnett et al., 1998).
           post-glacial events is complicated by shoreline identification               Models of Lake Ontario post-glacial water levels (Fig. 2)
           and radiocarbon (14C) dating techniques; however, the most                have been proposed by Sly and Prior (1984) and Anderson

                                                                                                                       FIGURE 1. Location map of the
                                                                                                                       Humber River basin relative to
                                                                                                                       deglacial event approximately
                                                                                                                   N   12 000 14C BP. Adapted from
                                                                                                                       Chapman and Putnam (1984) and
                                                    Laurentide                                                         Muller and Prest (1985). ORM: Oak
                                                       ice                                                             Ridges Moraine, K: Approximate
                                                      sheet                                                            location of Lake Algonquin
                                                                                                                       drainage at Kirkfield following fur-
                                                                                                                       ther ice retreat.
                                                                                                                       Carte de localisation du bassin de
                                                                                                                       la rivière Humber en relation avec
                                                                                                                       certains événements reliés à la
                                                                                                                       déglaciation de la région vers
                  Early                                          K                                                     12 000 14C BP. Adapté de Chapman
                  Lake                                                                                                 et Putnam (1984) et Muller et Prest
                Algonquin                                                                                              (1985). ORM : Moraine de Oak
                                   Niagara                 ORM                                                         Ridges, K : Localisation approxima-
                                 escarpment                                                                            tive du drainage du lac Algonquin à
                                                                                                                       Kirkfield en fonction du retrait sub-
                                                                                                                       séquent des glaces.
                                        Humber                       Lake Iroquois
                                         River
                                         basin

                                                                                                      0           50
                                                                                                             km

                                                           Géographie physique et Quaternaire, 59(1), 2005
GPQ_59-1.qxd                                    15/09/06          13:26     Page 19

           RIVER INCISION IN RELATION TO POST-GLACIAL EVENTS IN THE HUMBER RIVER BASIN, ONTARIO                                                                                                          19

                                                                                                                             to their confluence (Fig. 3). These incised valleys generally
                                                 80                                                                          follow a winding course, at times cut 30 to 50 m below the
                                                                                                                             surrounding uplands. The valleys also appear to have a com-
           Relative to present lake level (m)

                                                            LI                                                               plex erosional history with many river terraces and valley
                                                 40
                                                                                                                             widths ranging from 500 to 1 000 m. At the confluence, the
                                                                                                                             main branch of the Humber River then continues to flow south
                                                +                                                                            through a narrow incised valley (width generally less than
                                                    0
                                                –                                                                            200 m) before emptying into Lake Ontario.

                                                                                 A              UL                               Surficial geology within the basin is dominated by moraine
                                                 40                                                                          sediments, glacial tills, and glacial lacustrine deposits left by
                                                                                     B                                       the receding ice sheet (Sharpe et al. 1999). The younger sur-
                                                                                                                             face tills (e.g. Halton Till) overlie older tills and sediments (e.g.
                                                 80
                                                                                                                             Newmarket Till) which in turn overlie bedrock. The narrow
                                                        Lakebed       ELO                                                    incised valley of the lower Humber River is at times cut through
                                                120
                                                                                                                             the overburden, exposing the underlying Paleozoic shales
                                                             12                  8              4                      0     (Chapman and Putnam, 1984).
                                                                          Radiocarbon age (ka BP)                               As the incised valleys of the Humber River and East
                                                                                                                             Humber River above the confluence exhibit complex erosional
           FIGURE 2. Relative lake level for the western end of Lake Ontario                                                 histories, they presumably possess the most information about
           following the drainage of Lake Iroquois (LI). ELO: Early Lake Ontario,                                            their post-glacial evolution. Three field sites were selected
           UL: increased drainage received from the Upper Lakes during the
           Nipissing event, A: Curve from Anderson and Lewis (1985), B: Curve
                                                                                                                             along the East Humber River near Kleinburg, Ontario (Fig. 3),
           from Sly and Prior (1984).                                                                                        based on the occurrence of multiple terraces and abandoned
           Niveau d’eau relatif de la partie ouest du lac Ontario près du lac                                                channels. East Humber Valley 1 (EHV1) is located upstream
           Iroquois (LI). ELO : Early Lake Ontario, UL : Drainage accru en pro-                                              of Kleinburg, East Humber Valley 2 (EHV2) is located at
           venance des lacs durant l’évenement Nipissing, A : Courbe de                                                      Kleinburg, and East Humber Valley 3 (EHV3) is located down-
           Anderson et Lewis (1985), B : Courbe de Sly et Prior (1984).                                                      stream of Kleinburg.

                                                                                                                                                             METHODOLOGY
           and Lewis (1985). The main stage of Lake Iroquois was about
           40 to 45 m above contemporary lake levels. At the west end of                                                        In order to assess the evolution of river valleys in the
           the basin, water levels during the falling stages of Lake                                                         Humber River basin, this study combines analysis of digital
           Iroquois may have reached as much as 100 to 125 m below                                                           elevation models (DEM), topographic maps, surface geology
           present day lake level (Sly and Prior, 1984; Anderson and                                                         maps, and field data. Surface geology data were obtained
           Lewis, 1985). Rising water levels of early Lake Ontario                                                           from the Geological Survey of Canada (Sharpe et al., 2001).
           between ca. 11 500 and 5000 14C BP are generally associ-
           ated with greater isostatic rebound at the basin’s eastern out-
           lets (Anderson and Lewis, 1985). With the exception of the
                                                                                                                                                                                             r

           Nipissing Food phase (ca. 5000 to 4000 14C BP), Lake Ontario
                                                                                                                                                                                           e
                                                                                                                                                                                        Riv

                                                                                                                                                                            Nobleton
           water level continued to rise to the present day elevation                                                            N
                                                                                                                                                                                        er

           (Anderson and Lewis, 1985).                                                                                                                       Hu
                                                                                                                                                                                       mb

                                                                                                                                                               mb
                                                                                                                                                                  er R
                                                                                                                                                                                   Hu

              These post-glacial events will be examined further in the                                                                                               ive
                                                                                                                                                                         r
                                                                                                                                                                                  st

           context of the Humber River basin, a sub-basin of the con-                                                                                 Bolton                                 EHV1
                                                                                                                                                                                 Ea

           temporary Lake Ontario basin. Observations of valley mor-
           phology using a DEM and of incision chronology using radio-
           carbon dates will be used to investigate valley evolution in the
                                                                                                                                                                                                    EHV2
           Humber River basin. Although an accurate knowledge of the
                                                                                                                                                                                                       EHV3
           processes and events which formed these valleys would                                                                                                               Kleinburg
           require a more intense research design, observations made in
           this study may provide insight, and perhaps guide future
           research questions.

                                                                          STUDY AREA
                                                                                                                                                                                            Woodbridge
               The present day Humber River basin, a sub-basin of the
           greater Lake Ontario basin, drains an area of about 900 km2                                                          0           km           5
           at the northwest end of the lake. With headwaters beginning
           on the Oak Ridges Moraine, the Humber River and the East                                                          FIGURE 3. Location map of field sites on the East Humber River.
           Humber River converge and flow south through incised valleys                                                      Carte de localisation des sites le long de la rivière East Humber.

                                                                                                    Géographie physique et Quaternaire, 59(1), 2005
GPQ_59-1.qxd    15/09/06     13:26       Page 20

           20                                                                                                                 R.T.J. PHILLIPS and A. ROBERT

           Field work at all study sites included stratigraphic description,              Radiocarbon samples were collected from each field site to
           radiocarbon sampling, and topographic surveys. Field surveys               investigate valley incision chronology. Methods and interpre-
           included valley geometry and terrace elevations for reference              tations regarding radiocarbon samples are summarized in
           to maps and other digital geospatial data. Aerial photography              Table I. Generally organic matter was extracted from alluvial
           was used in the format of digital orthophotographs for inter-              deposits and chronological interpretations could then be based
           pretation of features and site characteristics.                            on the sample’s location relative to the geomorphic features of
               Digital elevation models (DEM) represent the landscape                 the site. Unless otherwise noted all dates are given in uncali-
           using a grid of 10 by 10 m cells which are assigned a value                brated radiocarbon ages and have not been used to calculate
           for elevation above sea level in 1 m intervals. Initial investiga-         absolute rates.
           tion of the DEM allowed for qualitative assessment of valley
           characteristics and morphology. Distance measurements, slope                                               RESULTS
           analysis, valley delineation, and river terrace identification were
           then performed using the DEM, orthophotography, and field                  DIGITAL ELEVATION MODELS AND VALLEY LOOPS
           survey results. As a generalization of the landscape, the verti-               Initial investigation of the Humber River basin DEM revealed
           cal scale of the DEM was not adequate to represent floodplain              a remarkable set of valley forms. The valley morphology along
           morphology (e.g. terraces) within a few metres of the valley               some sections of the Humber River and East Humber River
           floor. For this reason field surveys and aerial photography were           clearly exhibits forms and artifacts of a former river environ-
           necessary to verify and supplement the DEM information. In                 ment which was much larger than the contemporary river sys-
           addition to mapping of the valleys, the DEM was used in com-               tem. Such observations have been made in many other envi-
           bination with drainage networks to collect information such as             ronments, and are often attributed to wetter paleoclimates or
           drainage areas and measurements of valley features (e.g. val-              melt-water during deglaciation. However, what makes these
           ley meanders).                                                             forms rather distinct is their tortuous meandering and the
               Measurements of valley loop diameters was performed by                 unique set of conditions which must have been present in order
           manually fitting circles to the features. The circles were fit to          produce this morphology. The primary evidence for larger paleo-
           the base of slope along the valley wall, which was identified              rivers is the scale of meandering exhibited in the valley land-
           using a slope analysis within the DEM. The diameter of curva-              forms; however, poorly preserved paleochannel features
           ture results were then statistically plotted against contempo-             observed from aerial photography exhibit widths of 50 to 80 m
           rary drainage area. To smooth out some variation in the data               (approximately 2.5 to 4 times contemporary channel widths).
           points, the valley loop data was also tested based on clusters                 An image of the DEM (Fig. 4) illustrates the morphology of
           of loop features which were given a common drainage area.                  the East Humber and Humber river valleys. From these relic
              Terrace features were mapped and longitudinal profiles                  river forms, two distinct sets of morphology can be recognized
           developed using the DEM, orthophotography, and field sur-                  in the drainage basin: wide valleys with complex erosional
           veys. Following terrace identification, valley cross-sections              forms in the middle Humber and narrow incised valleys in the
           were then extracted from the DEM and, in some cases, veri-                 lower Humber reaches. Focusing on the morphology of the
           fied with a field survey. If terrace features were not flat, an            middle Humber, the first apparent form is the meandering of
           average surface elevation was extracted from the DEM. The                  the valley (Fig. 4A). Although the valley is incised into the gla-
           distances along a valley centre line were then mapped and                  cial stratigraphy, distinct valley meandering is recorded in the
           extracted using the orthophotography and DEM.                              landscape. Another apparent form is the large loop features

                                                                               TABLE I

                                                      Methods and interpretation of radiocarbon samples

           Site/Sample     Study focus       Sampling location and procedure                               Interpretation of sample history
           EHV2            Holocene valley   Abandoned Channel – From base of organic matter               Represents organic matter accumulation
           KB39.1          evolution         accumulation. Organic matter extracted using metal            immediately following channel abandonment.
                                             cylinder core.
           EHV2            Holocene valley   Intermediate Terrace – From alluvial deposits above           Represents vegetative matter deposited on an active
           KB39.2          evolution         coarse paleobed material. Organic matter extracted            point-bar during the time when the river channel was
                                             using test pit and soil auger.                                active at the elevation of the terrace.
           EHV1            Recent channel    Low Terrace – From point-bar deposits above                   Represents woody organic matter deposited on the
           KR1.1           incision          coarse paleobed material. Wood fragment extracted             point-bar and followed by further lateral migration
                                             from test pit.                                                and then channel abandonment.
           EHV3            Recent channel    Low Terrace – From point-bar deposit along                    Represents vegetative matter accumulation on the
           KT10.1          incision          exposed cut-bank. Organic matter extracted from               point-bar as the former channel migrated laterally.
                                             behind exposed surface with trowel.

                                                             Géographie physique et Quaternaire, 59(1), 2005
GPQ_59-1.qxd   15/09/06         13:27    Page 21

           RIVER INCISION IN RELATION TO POST-GLACIAL EVENTS IN THE HUMBER RIVER BASIN, ONTARIO                                                                21

                                                                                                                               FIGURE 4. DEM of the Humber
                                                                                                                               River basin showing planform mor-
                                                                                                                               phology of incised river valleys.
                                                                                                                               The landscape is represented in
                                                                                                                               10 m x 10 m pixels, which are
                                                                                                                               assigned an elevation above sea
                                                                                                                               level in 1 m intervals. A: Examples
                                                                                                                       r       of valley meandering, B: Examples
                                                                                                                    ve
                                                       Hu
                                                         mb
                                                                                            A
                                                                                                               r Ri            of valley loop features.
                       A                                                                                    be
                                                            er                                            m                    Modèle numérique d’élévation du
                                                                 Riv                                    u
                                                                    er                               tH                        bassin de la rivière Humber mon-
                                                                                                 Eas                           trant la morphologie en plan des
                                             B                                                                                 rivières incisées. Le paysage est
                                                                                                                               représenté avec des pixels de
                                                                                                                               10 m x 10 m, avec des valeurs
                                                                                                 A                             assignées d’élévation au-dessus
                                                                                                                               du niveau moyen des mers à des
                                                                                                                               intervalles de 1 m. A : Exemples de
                            Wide Valley Sections                                                                               méandres, B : Exemples des
                                                                                A                                              caractéristiques des boucles de
                                                                                                                               méandre.

               N
                                                                                                                     B

                                                                                                                    B

                        Narrow Valley Sections
                                                                                High
                   High (490)
                   m asl
                                                         Lake                   Low         0                 km           5
                   Low (106)      0          10
                                        km             Ontario

           preserved in the geometry of the valley walls (Fig. 4B). These                 contemporary regime. Although there are extreme uncertain-
           valley loops appear to be large meander loops which were                       ties in applying empirically derived equations to specific cases
           cutoff during the process of incision. As a result, some valley                using vague estimates of former channel properties, paleo-
           reaches appear relatively straight, yet have loops preserved on                discharge estimates using meander wavelength can still offer
           either side of the valley.                                                     some perspective. Applying a stereotype for the relationship
               These forms are not analogous to broad glacial outwash                     between valley meander wavelength and formative discharge,
           plains with braided channels or to large glacial spillways com-                given by Dury (1985), provides a paleodischarge which is
           mon in the Canadian Prairies, which are commonly associated                    approximately ten times larger than the present day mean
           with glacial meltwater. The primary difference is the tortuous                 annual flood of the Humber River gauged near Bolton (Fig. 6).
           meandering forms. As well, the scale of the valley meandering                  The existence of this specific valley morphology in the Humber
           features appears to generally increase as one progresses                       River basin suggests a unique set of circumstances during
           down valley. Given the well known relationships between                        deglaciation and the early Holocene. In order to investigate
           drainage area, discharge, and meander scale (Schumm,                           these environmental conditions further, vertical incision and
           1967), this suggests that there might be some distinguishable                  terrace patterns were also examined.
           relationship between the scale of the features and the location
           of the features within the drainage basin. In fact, a plot of the              TERRACE PATTERNS AND RIVER INCISION
           diameter of curvature of the most well preserved valley loops
           against the contemporary drainage-basin area does show a                           Generally, river incision is a process whereby channel ero-
           statistically significant correlation (Fig. 5 and Table II). A plot of         sion, particularly at the bed, results in the removal of under-
           the data from each branch which includes averaging some                        lying sediment to areas downstream, and ultimately beyond
           loops into clusters (with a common drainage area) provides a                   the outlet. By this process, rivers may tend to lower their rel-
           higher level of correlation and still maintains statistical signifi-           ative elevation within the surrounding landscape. River ter-
           cance. As a gap in the Humber River data was noted (Fig. 5A),                  races represent former floodplain levels which have since
           the linear regression tests were divided into upper and lower                  been abandoned by processes of incision.
           data subsets for the main branch (Table II).                                      Terrace elevations on the East Humber River have been
               The paleodischarges associated with the scale of these                     evaluated for this study using the DEM and field surveys
           forms are clearly much larger than the discharges of the                       (Fig. 7). This work complements earlier work done by Roberts

                                                                 Géographie physique et Quaternaire, 59(1), 2005
GPQ_59-1.qxd                                       15/09/06           13:27       Page 22

                                  22                                                                                                                                        R.T.J. PHILLIPS and A. ROBERT

                                                            600                                                                                                          FIGURE 5. Positive correlation
                                                            500                      R2 = 0.57                                                A                          between the size of valley loop fea-
                                                            400                                                                                                          tures and their location in the
                                                            300                                                                                                          basin. R-squared values from sim-
                                                            200                                                                                                          ple linear regression show good
                                                            100                                                                                                          correlation within subsets of the
                                                                  0         100        200          300                                                                  data and the slopes of the regres-
                                                                                                                                                                         sion lines are statistically signifi-
                                                                                                                                                                         cant. A: Contemporary drainage
                                                                                                                                                                         area which contributes to dis-
          Valley loop diameter of curvature (m)

                                                                            Humber River                                                                                 placement of Humber River data.
                                                  600                                                                                                                    Corrélation positive entre la taille
                                                                            East Humber River
                                                                                                                                                                         des boucles de méandres et leur
                                                  500                                                                                                       R2 = 0.88    localisation dans le bassin. Les R2
                                                  400                                                                                                                    de la régression linéaire simple
                                                                                     R2 = 0.94                                        A                                  montrent une bonne corrélation
                                                  300                                                                                                                    entre la subdivision des données
                                                                                                                                                                         et les pentes des droites de
                                                  200                                                                  R2 = 0.98                                         régression sont statistiquement
                                                                                                                                                                         significatives. A : Aire de drainage
                                                  100
                                                                                                                                                                         contemporaine contribuant au
                                                   0                                                                                                                     déplacement des données de la
                                                        0              50            100           150         200                  250              300          350    rivière Humber.
                                                                                                 Drainage area (km2)

                                  (1966). The highest terraces observed on the East Humber                                         in relation to this date. Although the organic sample was sus-
                                  River (Fig. 7) are rare and at elevations between 16 and 21 m                                    pended in the sediments, it must be assumed that the burial
                                  above the contemporary floodplain. Given the elevation of                                        of the sample coincides with the death of the organic material.
                                  these surfaces above the contemporary floodplain and their                                       If the death occurred much before burial, then the surface
                                  relative age, the reduced preservation of these features allows                                  would appear older than it is. Also, it is assumed that the bur-
                                  for little further interpretation in this study. However, it is likely                           ial of the material was soon followed by channel and flood-
                                  that these features were formed very soon after deglaciation.                                    plain abandonment. If the surface was active long after the
                                      The intermediate level terraces observed on the East                                         burial of the material, then the surface will have been active
                                  Humber river are well preserved and common throughout the                                        more recently than inferred. Generally, this radiocarbon date
                                  valley. On average these terraces are 10 m above the contem-                                     identifies an approximate time when the surface was active,
                                  porary floodplain. Further, the regularity observed in the eleva-                                and the “lifetime” of the surface may have begun earlier and
                                  tion of these intermediate terraces above the contemporary                                       ended after this date. Further boundaries on this date can be
                                  floodplain suggests that they can generally be associated with                                   suggested by examining lower terrace elevations.
                                  basin-wide adjustments and may roughly represent a continu-                                           The low terraces shown in Figure 7 are generally less than
                                  ous relic floodplain level of a common age. The radiocarbon                                      2 m from the contemporary floodplain, with one terrace doc-
                                  sample KB39.2 taken from an intermediate terrace at EHV2                                         umented at 5 m. Terraces at this level are close to the con-
                                  suggests an age of 8850 ± 1170 14C BP (Table III). As this sam-                                  temporary floodplain level and evaluation based on elevation
                                  ple is thought to represent deposited organic matter on an active                                is crude. As such, it is expected that not all low terraces have
                                  point-bar, this age approximates a time when the river channel                                   been documented within this study.
                                  was active at an intermediate elevation above the contemporary                                        The radiocarbon sample KB39.1 taken from an abandoned
                                  floodplain. Figure 8 is a schematic diagram of the intermediate                                  channel on a low terrace at EHV2 suggests that the age of the
                                  terraces at EHV2 and associated radiocarbon dates.                                               channel is 5340 ± 80 14C BP (Table III). The most significant
                                      In addition to the error given in the radiocarbon date, there                                implication of this date is that it suggests there has been very
                                  are other possible circumstances which should be considered                                      little incision over the last six thousand years. As the sample

                                                                                                                            TABLE II

                                                                                             Linear regression statistics for valley loops vs. drainage area

                                         Valley loop data                                                                    R2 value for                        Slope of                      P-Value for
                                                                                                                             regression                        regression                        slope of
                                         Diameter of curvature (m) vs. drainage area (km2)                                       line                              line                      regression line

                                        All data from basin                                                                      0.57                             0.92                         < 0.0001
                                        East Humber with clusters averaged                                                       0.94                             1.80                           0.0003
                                        Humber upstream of ‘A’ with clusters averaged                                            0.98                             3.43                           0.0015
                                        Humber downstream of ‘A’ with clusters averaged                                          0.88                             15.7                           0.0189

                                                                                                          Géographie physique et Quaternaire, 59(1), 2005
GPQ_59-1.qxd                        15/09/06                         13:27                Page 23

           RIVER INCISION IN RELATION TO POST-GLACIAL EVENTS IN THE HUMBER RIVER BASIN, ONTARIO                                                                                                                      23

                                                                                                                                                                                   FIGURE 6. DEM of the Humber
                                                                                                                                                                                   River valley at Bolton showing val-
                          N                                                                                                                                                        ley meandering and valley loop fea-
                                                                                                                                                                                   tures (a to e). Dury’s (1985) stereo-
                                                                                                                                                                                   type for the relationship between
                                                                                                                                                                                   meander wavelength (λ) and dis-
                                                                                                                                                                                   charge estimates a paleo-dis-
                                                                                                                                                                                   charge (Q) about 10 times greater
                                                                                                                                                                                   than the contemporary mean-
                                                                                                                                                                                   annual-flood discharge (qmaf).
                                                                                                                                                                                   Modèle numérique d’élévation de
                                                                                                                                                                                   la vallée de la rivière Humber à
                                                                                                                                                                                   Bolton montrant les boucles de
                                                                                                                                                                                   méandres (a à e). La relation empi-
                                                                                                                                                                                   rique établie par Dury (1985) entre
                                                                                                                                                                                   la longueur d’onde des méandres
                                                                                                                                               e                                   (l) et les débits estimés (Q) indique
                                                                                                                                  d                                                un débit 10 fois plus grand que le
                                                                                                                                                                                   débit annuel moyen actuel (qmaf).
                                                                                               a

                                                                                                        b              c
                                                                                                                                      λ-Q Stereotype (Dury, 1985)
                                                           High                                                                           Q = (λ /32.857)1/0.55
                                                                                                                                        Average λ(a to e) = 590 m
                                                                                                                                             Q = 190 m3/s
                                                           Low                                                                              qmaf = 20 m3/s
                                                                                                    0            Km           1

           was taken from the base of the organic matter accumulation, it                                                                          deglaciation and during the early Holocene. Further, late
           is thought to represent the approximate time of channel aban-                                                                           Holocene incision has been insignificant in comparison.
           donment. While the elevation of the surface was likely estab-                                                                           However, some incision has occurred in the late Holocene, as
           lished much before the channel was abandoned, the chronol-                                                                              shown by the existence of low terraces and visible erosion
           ogy of river incision at this location is limited by the age of the                                                                     within the contemporary channel.
           intermediate terrace surface (Fig. 7).
              A schematic plot of floodplain level at EHV2 following                                                                               RECENT INCISION
           regional deglaciation shows the general trends of incision                                                                                 Evidence of recent incision is apparent in cutbank expo-
           (Fig. 9). Interpretation of terrace patterns and associated radio-                                                                      sures at many sites on the East Humber River and Humber
           carbon dates suggest that most incision occurred following                                                                              River. Commonly, lateral channel erosion exposes sections of

                                                                                                                                                                                   FIGURE 7. Profile of the East
               Example: Intermediate Terrace
                                                                                                     DEM                                       1999 Orthophotography               Humber River showing the location
                        EHV2 - KB39.2
                              250                                                                                                                                                  of terraces, study sites, and radio-
                                                                                                                                                                                   carbon sampling locations. A gen-
               Elevation asl (m)

                                                                                                                                                                                   eral threefold terrace sequence is
                                                       A                                   A'                                                                                      apparent. Terrace elevations were
                                                                                  188 m
                                                                                                                                                                                   determined using field survey data,
                                                                                                                                                                                   DEM, and orthophotography.
                                                             180 m
                              150
                                                                                                                                                                                   Profil de la rivière East Humber
                                                       0     200    400    600            800                                                                                      montrant la localisation des ter-
                                                                Distance (m)                                                                                                       rasses, des sites d’étude et la posi-
                                                                                                                                                                                   tion des datations au 14 C. Une
                                                       240                                                                                                                         séquence de terrasses est mani-
                                                                                                                                              EHV1                                 feste. L’élévation des terrasses est
                                                                                                                                                                                   déterminée avec les données de
                                                       220                                                                                                                         terrain, le MNE et l’orthophotogra-
                                                                                                                     EHV2                                                          phie.
                                                                                                      EHV3
                                   Elevation asl (m)

                                                       200                                                                                           KR1.1
                                                                     Confluence

                                                       180                                                              KB39.2
                                                                                                                      KB39.1                                       High
                                                       160                                                  KT10.1                                                 Intermediate
                                                                                                                                                                   Low
                                                       140
                                                             25                           30                   35             40                             45               50
                                                                                                   Valley distance from Lake Ontario (km)

                                                                                                                        Géographie physique et Quaternaire, 59(1), 2005
GPQ_59-1.qxd     15/09/06      13:27       Page 24

           24                                                                                                                          R.T.J. PHILLIPS and A. ROBERT

                                                                                       TABLE III

                                                             Radiocarbon ages of the East Humber River valley

               Site/Sample           Elevation asl          (m) above                 (m) above              Radiocarbon age           Geomorphic position
                                         (m)                paleo-bed                  river-bed              (Lab number)*            and sample type

           EHV2                         177.5                   0.1                        0.8                    5340 ± 80            Abandoned channel, organics
           KB39.1                                                                                                (TO-11924)            above paleo-bed
           EHV2                         188.9                   0.5                      12.2                    8850 ± 1170           Terrace alluvial deposits, organics
           KB39.2                                                                                               (TO-11981)**           in sediment
           EHV1                         204.9                   0.5                        2.2                     690 ± 60            Terrace alluvial deposits, wood
           KR1.1                                                                                                 (TO-11925)            fragment in sediment
           EHV3                         166.6                   0.3                        2.1               Modern (60 ± 50)          Alluvial point-bar deposits, organic
           KT10.1                                                                                              (TO-11996)              layer in sand strata

           * Dating performed using Atomic Mass Spectroscopy (AMS) by IsoTrace Laboratories at University of Toronto, Ontario.
           ** Larger error due to lower carbon content in sample.

           floodplain stratigraphy which suggest that the channels are                           taken from point-bar sediments adjacent to the abandoned
           locally incising into the glacial material below. These exposures                     channel. It is still possible, however, that the channel was
           are generally characterized by a resistant glacial sequence,                          active for some time at a stable position following the death
           overlain by a package of alluvial sediments with coarse gravel                        and burial of the organic material, before channel abandon-
           and cobble at the base. Two of these sections will be described                       ment occurred. While this date does not provide a precise time
           from sites along the East Humber River: EHV1 and EHV3.                                of abandonment or rate of incision, it does suggest that this
               Although lateral channel migration at EHV1 is limited by                          local incision has occurred roughly within the last thousand
           its confinement between elevated terrace surfaces, much of                            years and possibly more recently.
           the reach at this site is characterized by exposures of massive                            A second example of recent incision on the East Humber
           glaciolacustrine clay. The abandoned channel at this site is                          River is found at the EHV3 field site. While this example again
           on a raised terrace about 1.5 m above the contemporary flood-                         shows a stereotypical terrace stratigraphy, incision and ter-
           plain. A cut-bank exposure of the terrace stratigraphy shows                          race formation appears to be the result of significant lateral
           the alluvial package of sediments, the coarse cobble and                              channel migration rather than channel abandonment. A cut-
           gravel base, and the underlying glaciolacustrine clay (Fig. 10).                      bank exposure of this terrace stratigraphy shows well pre-
           This clay exposure above the baseflow water-surface extends                           served sandy point-bar deposits with a coarse gravel at the
           down to the contemporary channel bed, and perhaps lower.                              base (Fig. 11). This alluvial package rests over a dense glacial
              Following channel abandonment at this site, it appears that                        till with a sandy-silt matrix and sparse gravel to cobble size
           incision has occurred. The radiocarbon sample KR1.1 taken                             clasts. Again, this glacial material extends from above the
           from the alluvial point bar deposits of the abandoned chan-                           baseflow water-surface down to the contemporary channel
           nel suggests an age of 690 ± 60 14C BP (Table III). In order to                       bed, and perhaps lower.
           obtain a date which closely approximates the time just before                            The suggested meander migration pattern is evident based
           the channel was abandoned, the radiocarbon sample was                                 on the channel geometry and recent channel shifting (Fig. 11);

                                                                                                                                       FIGURE 8. A three-dimensional
                                                                                                                                       diagram of the East Humber River
                                                                                                                                       valley at Kleinburg, illustrating the
                                                                                                                                       depth of valley incision and the ele-
                                                                                                                                       vation of intermediate terraces.
                                                                                                                                0      A: KB39.2: 8850 ± 1170 14C BP,
                                                                                                                                       B: KB39.1: 5340 ± 80 14C BP.
                                                                                                                                       Diagramme tridimensionnel de la
                                                                                                                A                      vallée de la rivière East Humber à
                                                                                                                                20
                                                                                                                                       Kleinburg illustrant la profondeur
                                                                                                     B
                                                                                                                                       de l’incision de la vallée et l’éléva-
                                                                                                                                       tion des terrasses intermédiaires.
                                                                                                                                40 m   A : KB39.2 : 8850 ± 1170 14C BP,
                                                                                                                                       B: KB39.1: 5340 ± 80 14C BP.
                                 0                                       350                                            700 m
                                            Intermediate              Alluvial                                      Abandoned
                        Upland                                                                    River
                                            Terrace                   Sediment                                      Channel

                                                                      Géographie physique et Quaternaire, 59(1), 2005
GPQ_59-1.qxd                       15/09/06          13:27     Page 25

           RIVER INCISION IN RELATION TO POST-GLACIAL EVENTS IN THE HUMBER RIVER BASIN, ONTARIO                                                                                  25

                                            13 000                                                               dates with a single radiocarbon date. Aside from any error in
                                    0                                                                            the radiocarbon date itself, it is still possible that the calendar
                                                                                                                 age of this sample is over 200 years old. What this suggests
                                    5
                                                                                                                 again is that this observed incision is relatively recent.
           Relative incision (m)

                                   10

                                   15
                                                                                                                                          DISCUSSION
                                                                    8850 ± 1170
                                                                                                                    Valley evolution in the Humber River basin is generally
                                   20
                                                                                                                 characterized by initially rapid incision into the post-glacial
                                   25
                                                                                                                 landscape, with much less incision through the late Holocene
                                                                                    5340 ± 80                    (Fig. 9). Based on the character of valley evolution investi-
                                   30                                                                            gated in this study, and the established interpretation of post-
                                        A                                                                        glacial events, some general observations can be made which
                                   35                                                                            may account for the valley geomorphology observed today.
                                   14 000     12 000   10 000   8000    6000     4000          2000         0
                                                                                                                     Interpretation of valley evolution in the Humber River basin
                                                             Radiocarbon age (BP)
                                                                                                                 can be achieved by looking at the rough chronological corre-
                                    0
                                                                                                                 lation between post-glacial events and inferred fluvial pro-
                                                                                                                 cesses. Figure 12 illustrates a schematic representation of the
                                    5                                                                            postglacial incision in the Humber River basin identified in this
                                                                                                                 study, and the associated deglaciation events and dates pre-
           Relative incision (m)

                                    0                                                                            sented in the literature. Although there is still some uncertainty
                                                                     10 100 cal
                                                                                                                 in the chronology of the events presented, the scale of the rela-
                                    5
                                                                                                                 tionships illustrated here may still allow for some acceptable
                                   20                                                                            observations.

                                                                                      6200 cal                       River valleys within the contemporary Humber River basin
                                   25                                                                            likely did not exist prior to the last glaciation; thus, the key
                                                                                                                 event to begin this account is the formation of the Oak Ridges
                                   30
                                                                                                                 interlobate moraine between 15 000 and 13 000 14C BP. As the
                                        B                                                                        Lake Ontario lobe of the ice sheet retreated eastward, much
                                   35
                                   16 000 14 000 12 000 10 000 8000          6000     4000     2000       0      of the landscape of the contemporary Humber River basin
                                                             Calibrated age (ka BP)
                                                                                                                 would have been uncovered. Given the general scale and pat-
                                                                                                                 tern of postglacial rebound, this area was still likely charac-
           FIGURE 9. Plot of relative incision at Kleinburg since deglaciation                                   terized by a topographic high at the Oak Ridges Moraine. As
           (showing rapid incision initially followed by slow incision in the late                               well, surficial geology was characterized by a complex stratig-
           Holocene). A: The shaded zone provides an envelope which links the                                    raphy of basal till, glaciolacustrine clays, and glaciofluvial
           dating of deglaciation (13 000 14C BP) from previous research                                         deposits on the south slope. As this surface exposure per-
           (Terasmae, 1980; Chapman and Putnam, 1984) with radiocarbon date
           error bars from this study. B: Plot of calibrated ages provides the same                              sisted, processes of fluvial erosion and stream channel initia-
           pattern of incision.                                                                                  tion would have begun to carve up the landscape. Based on
           Diagramme de l’incision relative estimée au site de Kleinburg depuis                                  the observations of valley morphology from the DEM, the
           la déglaciation (on observe une incision initiale rapide suivie d’une                                 channel pattern appears to have been initially characterized by
           diminution du taux d’incision plus lent au cours de l’Holocène). A : La                               sinuous meandering into the exposed glaciogenic deposits.
           zone ombragée associe l’âge de la déglaciation (13 000 14C BP) des
           études précédentes (Terasmae, 1980; Chapman et Putnam, 1984)                                              During the establishment and existence of Lake Iroquois
           aux erreurs des dates au radiocarbone de cette étude. B : Le dia-                                     in the Lake Ontario basin, ice retreat north of the Oak Ridges
           gramme des âges étalonnés montre le même patron d’incision.                                           Moraine was also occurring and was associated with the
                                                                                                                 development and existence of glacial Lakes Schomberg and
                                                                                                                 Algonquin. These proglacial lakes are generally associated
           as well, the pattern of point-bar shifting apparent in the stratig-                                   with the Huron basin; however, it is thought that lake levels
           raphy suggests that migration was in a northward direction. As                                        submerged many areas north of the Oak Ridges Moraine and
           the evolving meander bends shifted laterally, vertical incision                                       surrounding present day Lake Simcoe (Fig. 1). Despite con-
           was also occurring. This simultaneous lateral and downward                                            siderations for isostatic depression by the Laurentide Ice Sheet
           shifting has ultimately resulted in a raised alluvial package and                                     and patterns of glacial rebound, raised water levels in this
           exposure of the underlying glaciogenic material. The radiocar-                                        area would generally have been at a higher elevation com-
           bon sample KT10.1 taken from an organic layer within the                                              pared to water levels in the Lake Ontario basin. This is sup-
           point-bar deposits suggests an age of 60 ± 50 14 C BP                                                 ported by evidence of drainage from Lake Algonquin to the
           (Table III). Although this age appears much too recent to allow                                       Ontario basin (Chapman and Putnam, 1984). Based on this
           for the observed amount of migration and incision, problems                                           fact, infiltration and groundwater flux patterns would have been
           associated with calibration between radiocarbon years and cal-                                        characterized by flow through the complex stratigraphy to the
           endar years allows for the association of multiple calendar                                           south, some of it likely associated with Oak Ridges Moraine

                                                                                        Géographie physique et Quaternaire, 59(1), 2005
GPQ_59-1.qxd    15/09/06    13:27     Page 26

           26                                                                                                                R.T.J. PHILLIPS and A. ROBERT

                                                                                                   Cobble
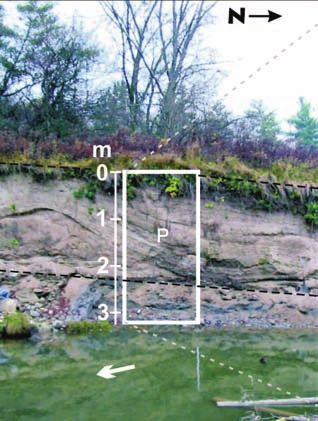
                                                                                                                            FIGURE 10. Exposed section at

                                                                                                   Gravel
                                                                                                   Sand
                                                                                                                            EHV1 showing a package of alluvial

                                                                                                   Clay
                                                                                                   Silt
                                                                                                                            sediments overlying non-alluvial
           Plan                          Terrace                   Section
                                                                                           m                                material. This channel reach
                                                                                                                            appears to be incising and has
                                                                                                         Dark motling
                                                                                                                            exposed a dense grey clay.
                                                                                           1             and roots          P: Position of photograph, 14C:
                                                                                                                            Radiocarbon date (KR1.1: 690 ±
                                                                                                        Fine sand and       60 14C BP), A: Abandoned channel.
                                                                                                        silt with           Section exposée au site EHV1
                                                                                                        sand lenses         montrant des alluvions au-dessus
                                                  m                                                                         d’un matériel d’origine non-alluvial.
                                              0                                                          Sand with          Cette section du chenal semble
                                                                                                         shells             continuer à s’inciser et expose une
                                                                                                                            couche d’argile grise et dense.
                                              1                                                                             P : Localisation de la photographie,
                                                                                                         Sand &             14
                                                                                                                               C : Date au radiocarbone
                                                      P                                                  gravel             (KR1.1 : 690 ± 60 14 C BP), A :
                                              2                                                                             Chenal abandonné.
                                                                                           2                   Cobble
                                              3                                                                paleobed

                                                                                                    Glaciogenic Clay

           sediments. This pattern of hydraulic head would have inter-                northern ice; however, it is unclear if the timing and formative
           esting implications for baseflow and stream-flow patterns on               history of the moraine support this suggestion. It is also unclear
           the south slopes of the moraine.                                           if this can explain the character and timing of valley evolution.
               The scale of meandering forms measured from the DEM                       Further melting and ice retreat north of the moraine gen-
           (Fig. 6) suggest that paleochannels were much larger during                erally resulted in melt-water collection by proglacial lakes, but
           initial incision. If the ancestral rivers in the Humber River basin        there is little topographic or sedimentary evidence that over-
           were indeed much larger than today, this would require greater             spill to the south was a significant process. There is some
           sources of water. Given the distribution of surficial accumula-            minor evidence of overspill in the surficial sediments just north-
           tions of moraine sediments, it is also possible that northern ice          east of Nobleton (see Fig. 3 for location) and it has been spec-
           was positioned at the moraine for some period of time follow-              ulated that some overspill at the moraine may have occurred
           ing the withdrawal of the Ontario basin lobe to the south. Thus,           near Palgrave (Eschman and Karrow, 1985); however, if over-
           initial fluvial incision south of the moraine could have been              spill was a dominant factor in valley formation on the south
           driven by melt-water directly from the melting edges of the                slope, then headwater valleys should extend over the moraine.
                                                                                                   Cobble

                                                                                                                            FIGURE 11. Exposed section at
                                                                                                   Gravel
                                                                                                   Sand
                                                                                                   Clay

                                                                                                                            EHV3 showing alluvial point-bar
                                                                                                   Silt

                                                                                             m                              deposits overlying a glaciogenic till
           Plan                          Terrace & Section                                   0                              deposit. Epsilon cross-bedding
                                                                                                                            suggests channel migration was
                                                                                                                            generally in a northward direction.
                                                                                                                            The contemporary channel
                                                                                                                            appears to be incising. P: Position
                                                                                                          Sandy epsilon     of photograph, 14C: Radiocarbon
                                                                                                          cross beds        date (KT10.1: 60 ± 50 14C BP).
                                                                                               1                            Section exposée au site EHV3
                                                                                                                            montrant les dépôts alluvionnaires
                                                                                                                            reposant sur un dépôt d’origine gla-
                                                                                                                            ciaire. Le chenal contemporain
                                                                                                          Organic           semble continuer à s’inciser.
                                                                                                          layers            P : Localisation de la photographie,
                                                                                                                            14
                                                                                                                              C: Date au radiocarbone (KT10.1:
                                                                                               2                            60 ± 50 14C BP).
                                                                                                                 Gravel
                                                                                                                 paleobed

                                                                                                                Sandy
                                                                                                                silt till
                                                                                               3
                                                                                                                   clasts

                                                             Géographie physique et Quaternaire, 59(1), 2005
GPQ_59-1.qxd     15/09/06         13:27    Page 27

           RIVER INCISION IN RELATION TO POST-GLACIAL EVENTS IN THE HUMBER RIVER BASIN, ONTARIO                                                                                                                27

                                                                                                                                                                          Relative to present lake level (m)
               Oak Ridges Moraine
                                                                                                                                                                   45
               Lake Iraquois (West)
                                                                                                                                                                   0
               Lake Ontario (West)
                                                                                                                                                                   -100
                                                  Early

                                                                   Main

               Lake Algonquin (Huron)                     K                       Mattawa                                   Nipissing
                                                                                          C
               Rapid Incision                         A        B
                                                                                                                      D
               Minimal Incision                                                                                                                            E

                                      14     13           12       11       10        9       8     7      6      5             4       3     2       1        0
                                                                                          Radiocarbon age (ka BP)

           FIGURE 12. Chronological correlation of deglaciation events and river                   Corrélation chronologique des événements de déglaciation et d’incision
           incision associated with the Humber River basin. A: Early fluvial inci-                 fluviale pour le bassin de la rivière Humber. A : Incision fluviale initiale
           sion due to melt-water with outlet temporarily associated with Lake                     associée aux eaux de fonte provenant temporairement du lac Iroquois.
           Iroquois. B: Continued fluvial incision with possible readjustments due                 B : Poursuite de l’incision fluviale par des réajustements associés à la
           to the drop in base-level. C: Radiocarbon date of intermediate terrace                  baisse du niveau de base. C : Datation au radiocarbone de la terrasse
           at EHV2 (KB39.2) associated with 65% of vertical valley incision.                       intermédiaire au site EHV2 (KB39.2) associée à 65% de l’incision de
           D: Radiocarbon date of abandoned channel at EHV2 within one metre                       la vallée. D : Datation au radiocarbone d’un chenal abandonné au site
           of the contemporary floodplain elevation. E: Some reactivation of inci-                 EHV2 dans le premier mètre de la plaine inondable contemporaine.
           sion, presumably associated with human settlement and develop-                          E : Réactivation de l’incision fluviale, probablement associée aux acti-
           ment. K: Partial lowering of Lake Algonquin associated with drainage                    vités humaines. K : Diminution partielle du niveau du lac Algonquin
           at Kirkfield. Deglacial chronology estimated from various sources                       associée au drainage à Kirkfield. La chronologie de déglaciation est
           (Karrow et al. 1961; Duckworth, 1979; Terasmae, 1980; Chapman and                       fondée sur plusieurs sources (Karrow et al., 1961; Duckworth, 1979;
           Putnam, 1984; Sly and Prior, 1984; Anderson and Lewis, 1985;                            Terasmae, 1980; Chapman et Putnam, 1984; Sly et Prior, 1984;
           Chapman, 1985; Eschman and Karrow, 1985; Muller and Prest, 1985;                        Anderson et Lewis, 1985; Chapman, 1985; Eschman et Karrow, 1985;
           Yu et al. 1997; Yu and Wright, 2001).                                                   Muller et Prest 1985; Yu et al., 1997; Yu et Wright, 2001).

           Overspill channels do not appear to be the dominant source                              leave the data disjointed (Fig. 5A). This pattern suggests that
           of melt-water controlling valley evolution. Further, the direct                         the contemporary drainage area, which contributes to this
           contribution of significant melt-water to the drainage systems                          jump in drainage area, was a much less effective source of
           is not supported by the increasing size of valley features                              water during the formation of the these valley features.
           downstream. The melting front of a glacier or even a proglacial                             Moraine sediments tend to consist of coarser material than
           lake would be expected to deliver water independent of                                  the till and lacustrine deposits, and thus are generally more
           drainage area.                                                                          hydraulically conductive. Further, the fine texture and density
               Instead, the increasing size of valley loops with increasing                        of basal till and glaciolacustrine deposits impart lower hydraulic
           drainage area (Fig. 5) suggests that melt-water may have also                           conductivities. Thus, the spatial association of headwater
           indirectly supplied water to the Humber River basin by way of                           drainage, valley morphology, and moraine sediments suggests
           atmospheric or hydrogeologic sources. It seems logical that                             that a major source of water to the ancestral rivers may indeed
           large accumulations of impounded water in the region would                              have been supplied by pro-glacial lake levels to the north driv-
           have moistened the atmosphere and induced significant                                   ing groundwater flux to the south slopes. Additional evidence
           groundwater flow through conductive sediments. While deeper                             of this relationship with the basin hydrostratigraphy is the con-
           hydrostratigraphy would have been involved, some of this                                temporary drainage network surveys performed by Hinton et
           groundwater flow would be associated with the Oak Ridges                                al. (1998) which show that most river baseflow in the basin is
           Moraine sediments. Moraine sediments are also associated                                associated with moraine sediments.
           with the in-filling of large sub-glacially formed channels (i.e.                            Given the significant geomorphic effects of early river evo-
           tunnel valleys), and moraine sediments have been docu-                                  lution compared to contemporary processes, it is logical to pre-
           mented at depths of 150 m, where the base may be lower                                  sume that paleorivers were more competent with regard to erod-
           than 130 m above sea level (Barnett et al. 1998). Referring to                          ing and transporting sediment. Although river hydrology is an
           Figure 13, both main branches with the unique valley mor-                               important factor, the character and supply of the sediment may
           phology originate from areas with significant moraine depo-                             also play a role in changing river competence through the
           sition. As well, the area of contemporary drainage between                              course of river evolution. As much of the postglacial surface
           the two primary headwaters is an area where moraine depo-                               was characterized by a stratigraphic sequence of various glacio-
           sition was not as significant. Consequently, this area also may                         genic materials, initial incision was likely associated with rela-
           not have contributed water as effectively during initial post-                          tively young sediments, with potentially abundant silt and sand
           glacial incision, as suggested in Figure 5. Along the Humber                            sized materials. In contrast, it is possible that late Holocene
           River valley, there are two groups of valley loop data sepa-                            rivers have been eroding older, perhaps more resistant,
           rated by a sudden increase in drainage area which seems to                              deposits, and have suffered from a concentration of coarser

                                                                          Géographie physique et Quaternaire, 59(1), 2005
GPQ_59-1.qxd       15/09/06          13:27       Page 28

           28                                                                                                                   R.T.J. PHILLIPS and A. ROBERT

                                                                                                                               Figure 13. Map of Humber River
                                                                                                                               basin showing extent of valley mor-
                                                                                                                               phology in relation to surficial sed-
                                                                                                                       N       iment distribution and raised shore-
                                                                                                                               line. Shoreline and sediment
                                                                                                                               distribution modified from Sharpe
                                                                                                                               et al. (2001).
                                                                                                                               Carte de l’étendue de la morpho-
                                                                                                                               logie des vallées en relation avec
                                                                                                                               la distribution des dépôts de sur-
                                                                                                                               face et du niveau du lac pour le
                                                                                                                               bassin de la rivière Humber. Les
                                                                                                                               lignes de rivage et la distribution
                                                                                                                               des sédiments ont été modifiées
                                                                                                                               d’après Sharpe et al. (2001).

                                                                                                   Legend
                                                                                                        Looped incision
                                       e
                                      lin
                                     ore

                                                                                                        Narrow incision
                                 Sh
                                is

                                                                                                        Moraine sediment
                             uo
                          roq

                                                      Lake
                         I

                                                      Ontario
                      ke
                     La

               0                            km                  50

           material (e.g. till clasts) within the valley fill. This process is also           While this idea seems reasonable, there is some inconsis-
           suggested by the highly controlled and irregular meandering                        tency when compared to the radiocarbon date suggested by
           exhibited by the contemporary river channels.                                      the intermediate terrace at EHV2. Even the oldest age within
              Following the drainage of glacial Lake Iroquois after                           the dating error indicates that the river did not abandon this ter-
           12 000 14C BP, surfaces previously below the level of Lake                         race at the time Lake Iroquois was drained. In fact, the radio-
           Iroquois would have been exposed to the fluvial incision from                      carbon date suggests it was 1500 to 4000 14C BP later.
           the established drainage upstream. As levels of Early Lake                         However, it is possible that the response of the river channels
           Ontario were far below present day lake levels, this would                         upstream from the Lake Iroquois outlet was delayed.
           have also included incision into the surfaces which are now                           Following a relatively rapid drop in base-level, incision can
           lake bed. Sharpe et al. (1999) suggest that basin-wide read-                       occur as a wave which migrates upstream (Knighton, 1998).
           justment may have been responsible for the common occur-                           Presumably, a drop in the base-level would cause incision near
           rence of the distinctive set of river terraces within some valleys.                the outlet, but initially this would not effect local valley and

                                                                     Géographie physique et Quaternaire, 59(1), 2005
GPQ_59-1.qxd                   15/09/06       13:27     Page 29

           RIVER INCISION IN RELATION TO POST-GLACIAL EVENTS IN THE HUMBER RIVER BASIN, ONTARIO                                                                          29

                                                                                                                                          Figure 14. Valley profiles for the
                                     Iroquois Lakebed     Transitional                Incised Meander and Loop Valley                     Humber River and East Humber
                                         Narrow Incised Valley                            Morphology with Terraces                        River.
                               245
                                                                                               King Creek              Bolton             Profils de vallée des rivières
                               225                                                                                                        Humber et East Humber.

                               205                                             Kleinburg
           Elevation asl (m)

                               185

                               165                              Confluence

                               145               West Humber
                                                 Confluence
                               125                                                                                      East Humber
                                                                                                                        Humber
                               105
                                     0             10           20             30               40                50              60
                                                                         Distance Upstream (km)

           channel slopes upstream. Although the contemporary river pro-                                 lake levels did not significantly submerge areas immediately
           files do show an increase in slopes upstream of the conflu-                                   north of the Oak Ridges Moraine, presumably as a conse-
           ence, terraces can be observed a great distance upstream,                                     quence of glacial rebound.
           and thus this change in profile is likely a product of other basin
                                                                                                             In addition to rising levels in the Lake Ontario basin over the
           controls (Fig. 14). Differences between the longitudinal profiles
                                                                                                         middle Holocene, reduced incision may also have been aided
           upstream of the confluence are likely controlled by differences
                                                                                                         by dryer climates. Evidence of this is shown by Yu et al. (1997)
           in regional scale slopes (i.e. spatial character of regional topog-
                                                                                                         using shifts in oxygen isotopes at Crawford Lake just south-
           raphy immediately following glacial retreat). The longitudinal
                                                                                                         west of the Humber River basin. Yu et al. (1997) suggest that
           slopes of the terraces (Fig. 7) appear to closely follow the con-
                                                                                                         evidence at this lake indicates a dryer climate in the region
           temporary channel slopes. This suggests that differential uplift
                                                                                                         between ca. 5000 and 2000 14C BP. Presumably climate fol-
           may not have influenced incision processes or that valley inci-
                                                                                                         lowing this period has become wetter, which may also be con-
           sion occurred over a very short period. It is possible that the
                                                                                                         tributing to the slight increases in incision observed within the
           rapid lowering of base-level due to drainage of Lake Iroquois
                                                                                                         last 1000 14C BP.
           had some effect on upstream incision, however, the timing and
           pattern of incision seem to be more complex.                                                      Evidence discussed in this study (EHV1 and EHV3) sug-
                                                                                                         gests that there has been some reactivation of incision in the
               The rising level of Lake Ontario through the Holocene
                                                                                                         Humber River basin within the last one thousand years, and
           would have reduced incision rates, particularly at reaches just
                                                                                                         perhaps more recently. It is possible that this idea is supported
           above the outlet. Relatively little incision has occurred at EHV2
                                                                                                         by the work of Weninger and McAndrews (1989) on aggrada-
           in the last 6000 14C BP (Fig. 9). Further, the end of Lake
                                                                                                         tion rates in the lower Humber River valley. Using sediment
           Algonquin roughly 10 500 14C BP would have reduced the
                                                                                                         cores from two flood ponds, they found a significant increase
           amount of water received on the south slopes of the Oak
                                                                                                         in aggradation rates starting about 150 years ago. These rates
           Ridges Moraine. Consequently, most of the uncertainty regard-
                                                                                                         far surpassed the measured late Holocene aggradation rates
           ing valley evolution lies in the period between 10 500 and
                                                                                                         attributed to lake-level rise, prior to 150 years ago. These
           6000 14C BP. If incision was still active during this time, it is
                                                                                                         aggradation rates in the lower Humber River valley are gen-
           unclear what factors were the most important in driving it. If the
                                                                                                         erally considered a response to basin sediment supplies due
           majority of river incision occurred before the end of Lake
                                                                                                         to erosion from agricultural surfaces, but might also be due to
           Algonquin, this conflicts with the radiocarbon date taken at
                                                                                                         increased incision upstream. Increased incision upstream is
           EHV2. Post-Algonquin incision could perhaps be associated
                                                                                                         not surprising given the effects of deforestation and urban-
           with a warming of the Holocene climate following the Younger
                                                                                                         ization on decreases in evapotranspiration and infiltration, and
           Dryas cold period (Yu and Wright, 2001) or with subsequent
                                                                                                         increases in runoff.
           high lake stages in the Huron basin. During the Holocene, var-
           ious high stages in the Lake Huron basin have been described                                      While increased human settlement may be the driving fac-
           and are thought to be associated with water from glacial Lake                                 tor behind recent incision, the effects of changing basin hydrol-
           Agassiz (Teller, 1985; Buhay and Betcher, 1998). In particular,                               ogy on local channel incision are relatively heterogeneous.
           the Mattawa highstands occurred ca. 10 000 and 8000 14C BP,                                   Variations in local valley and channel slopes, valley confine-
           and the Nipissing Flood phase occurred ca. 5000 and                                           ment, and sediment characteristics will cause variations in the
           4000 14C BP (Eschman and Karrow, 1985; Lewis et al., 1994).                                   geomorphic response. For example, evidence of recent inci-
           However, only the Mattawa highstands correlate with the age                                   sion suggests more activity at the EHV1 and EHV3 field sites,
           of the river terrace at EHV2, and evidence suggests that these                                with less apparent incision throughout the valley near EHV2.

                                                                                Géographie physique et Quaternaire, 59(1), 2005
Vous pouvez aussi lire