Structural Map of the Atlantic Ocean Carte structurale de l'océan Atlantique
←
→
Transcription du contenu de la page
Si votre navigateur ne rend pas la page correctement, lisez s'il vous plaît le contenu de la page ci-dessous
Explanatory Notes
Notes explicatives
Peter MILES & Philippe BOUYSSE

Structural Map of the Atlantic Ocean
Carte structurale de l'océan Atlantique
1:20 000 000 scale
Échelle 1/20 000 000                   (2012)

             COMMISSION DE LA CARTE GÉOLOGIQUE DU MONDE
             COMMISSION FOR THE GEOLOGICAL MAP OF THE WORLD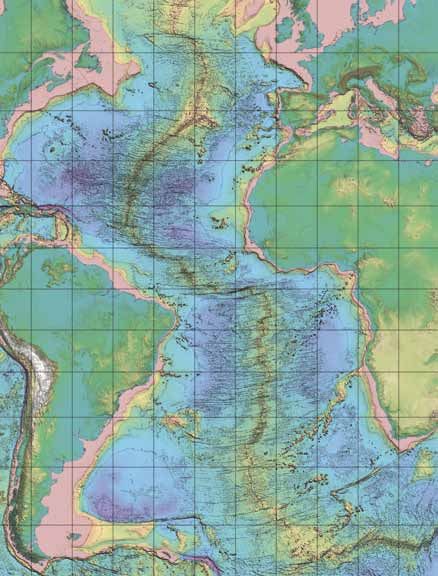
COMMISSION OF THE GEOLOGICAL MAP OF THE WORLD
 COMMISSION DE LA CARTE GÉOLOGIQUE DU MONDE

STRUCTURAL MAP OF THE ATLANTIC OCEAN
CARTE STRUCTURALE DE L’OCÉAN ATLANTIQUE

               (1st edition / 1e édition)

               Explanatory notes
               Notes explicatives

                          By

           Peter Miles & Philippe Bouysse
                      (CGMW)

                         2012
© CCGM/CGMW 2012
ISBN 978-2-917310-14-4

The reproduction of excerpts or the totality of this text is authorized provided the authors and the publisher are duly credited.
Tout ou partie de ce texte peut être reproduit sous réserve d’en mentionner les auteurs et l’organisme responsable de la publication.

CCGM-CGMW
77, rue claude-bernard
75005 Paris, France
ccgm@club-internet.fr
www.ccgm.org
SUMMARY / SOMMAIRE

Abstract                                                   Résumé
Foreword, 4                                                Avant propos, 12
Mapping an ocean, 5                                        Cartographier un océan, 13
Physiography, 5                                            Physiographie, 13
Structural Map, 5                                          Carte structurale, 13
   Introduction, 5                                            Introduction, 13
   Onshore areas, 5                                           Zones émergées, 13
      Precambrian, 5                                             Précambrien, 14
      Central Atlantic Magmatic Province (CAMP), 5               Province Magmatique de l’Atlantique Central
                                                                 (CAMP), 14
      Early Cretaceous rifting, 6
                                                                 Rifting tu Crétacé inférieur, 14
      Parana-Etendeka Traps, 6
                                                                 Trapps du Parana-Etendeka, 14
      Cameroon Hot-Line, 6
                                                                 Ligne chaude du Cameroun, 14
      Paleogene volcanism, 6                                     Volcanisme Paléogène, 14
      Neogene volcanism, 6                                       Volcanisme Néogène, 14
      Hotspots, 6                                                Points-chauds, 15
      «Alpine» orogens, 6                                        Orogènes «Alpins» , 15
   Offshore areas, 6                                          Zones sous-marines, 15
      Magnetic Anomalies and age of the oceanic crust, 6        Anomalies magnétiques et âge de la croûte océa-
                                                                nique, 15
      Structural features, 7
                                                                Éléments structuraux, 15
      Anomalous submarine plateaus, 7                           «Plateaux océaniques», reliefs sous-marins «anor-
      Subduction zones, 7                                       maux, 15
      Deep-sea drill sites, 7                                   Zones de subduction, 15
                                                                Forages océaniques profonds, 16
      Sediment thickness, 7
                                                                Épaisseur des sédiments, 16
      Zone of oceanic crust deformation, 8
                                                                Zone de déformation de la croûte océanique, 16
      Continental margins, 8                                    Marges continentales, 16
      Transitional Crust, 9                                     Croûte transitionnelle, 17
      The seafloor spreading ridges, 8                          Rides d’expansion océanique, 17

   Overview of the opening of the Atlantic Ocean and          Grands traits de l’ouverture de l’océan Atlantique et
   adjacent oceanic basins, 8                                 des bassins océaniques adjacents, 17

   Marginal Seas, 9                                           Mers marginales, 18

   Seismicity, 9                                              Sismicité, 18

Geodynamic Sketch, 9                                       Esquisse géodynamique, 18

Documents contulted in preparation of the map, 19          Documents consultés pour la préparation de la carte, 19

   Maps, 19                                                   Cartes, 19

   Data sets, 19                                              Données, 19

References (text and map), 19                              Références (texte et carte), 19
THE STRUCTURAL MAP OF THE ATLANTIC OCEAN
At the scale of 1:20 000 000 – First edition
2012
EXPLANATORY NOTES
ABSTRACT
This pamphlet accompanies the Structural Map of the Atlantic Ocean which synthesizes
the interpretation of geological and geophysical data compiled from oceanographic cruises
spanning several decades and their published results.
The main structural map is presented in the framework of the continental structural features.
The oceanic areas include the following parameters:
• The age of the oceanic crust in Epochs.
• Magnetic anomaly chron picks where they have been observed or interpreted.
• Seafloor spreading axes, active and fossil.
• Transform faults and fracture zones.
• Anomalous relief and subduction zones.
• Seaward dipping reflector (SDR) volcanic sequence.
• Earthquake epicentres and source depths.
• Hotspots.
• Deep ocean drilling sites - DSDP( IPOD), ODP and IODP - where basaltic basement or
transitional crust was reached.
• Sediment thickness - contours over oceanic crust and thinned continental crustal areas.
• Crustal deformation zones.
Summary of continental geology related to the geodynamic evolution of the ocean.
The map is accompanied here by a corresponding Geodynamic Sketch (inset in the map)
and Physiographic Map (inset in these notes). These display the tectonic plates pattern and
illustrate the morphology and their juxtaposition. This includes associated oceanic features
included in the text.
FOREWORD
The Commission for the Geological Map of the World (CGMW/CCGM) is a scientific Non-Governmental Organization
(NGO) recognised as Category A by UNESCO and affiliated to the International Union of Geological Sciences (IUGS).
It was initiated in an early form in 1881 during the 2nd International Geological Congress (IGC) held in Bologna. During
the 1980s the CGMW co-published with UNESCO the maps of the five oceans of the globe for the first time (including
the ‘Antarctic Ocean’). These were part of the ‘Geological Atlas of the World’ and printed at a relatively small scale. Two
decades later our knowledge of the deep seafloor of the world’s oceans has improved to such an extent that during the
1990s the Commission decided to initiate a new series of seafloor maps featuring whole oceans, whose first release in
2004 was the Structural Map of the Indian Ocean. This map of the Atlantic Ocean1, issued for the 34th IGC in Brisbane in
2012, is the third one of this series, being an extension of, and replacement for, the 2008 North Atlantic map. It overlaps
the adjoining Indian Ocean map. Publication of the map received financial support from UNESCO, the Geological
Survey of Norway (2008) and IFREMER.
1 Authors of the map: Peter Miles, Philippe Bouysse and Kaiser de Souza with the contributions of Brian Tucholke, Carmen Gaina,
Laurent Gernigon, Dietmar Müller, Alexandra Robert and GEUS.
4MAPPING AN OCEAN STRUCTURAL MAP
From an Earth science perspective the compilation of a structural INTRODUCTION
map of an ocean, as opposed to an atlas or onshore cartography, The Atlantic Ocean is the result of the break-up of the Pangea
is not as straightforward an exercise as is at first apparent. The super-continent which began between what is now North
reasons for this are: America and Africa (north-central Atlantic) in the Early –
● The map cannot be a truly geological. That is, the Middle Jurassic. This formed the Laurasian super-continent
seabed geology and other formations cannot be of North America and Eurasia as it separated from Gondwana
mapped as in land geology otherwise it would mainly which consisted of present day South America, Africa, Arabia,
represent Plio-Quaternary sediments. India, Madagascar, Australia, and Antarctica. A second break-
● It is also not possible to construct a conventional up phase occurred when Gondwana divided into several
tectonic map because the evolution of the oceanic continental blocks. As concerns the South Atlantic, this involved
lithosphere is never greater than ~200 Ma in age. Africa rifting from Antarctica, then from South America rifting
● The map is also not simply an illustration of one from south to north. Eventually North America and Greenland
geophysical parameter (seismicity, magnetic broke with Eurasia to open the NW Atlantic and Norwegian Sea.
anomalies, spreading rate etc.) but a representation of The Atlantic and Indian Oceans continued to expand, closing
all physical parameters, plus observed and interpreted the Tethys Ocean. Following this the African Plate changed
lineations. direction from west to northwest towards Europe while South
America began to move north. Interaction of these motions
● Unlike the majority of maps devoted to an oceanic with those of Cocos, Nazca, and Caribbean plates form the
area, there is also a need to include some land structural complex transform, trench and subduction plate boundaries of
geology that places island and surrounding continent the Caribbean Plate which abuts the North Atlantic Ocean. Here
structures in context. This provides complimentary the boundary between the North and South American plates is
information in understanding the evolution of an as yet poorly defined, and is distributed within a band facing the
ocean basin, such as in the fit of adjacent Precambrian front of the Lesser Antilles arc.
shields prior to rifting and separation of the continental
fragments.
● The map must also compile and overlay different ONSHORE AREAS
entities of information in such a way as not to impede On this map, the onshore is represented in a somewhat different
an acceptable balance between clarity and detail. way if compared with previous CGMW seafloor maps. The
For all these reasons we chose to title this kind of cartography a geology has been simplified and the stress was laid on pivotal
“structural map”, a term not heavily constrained by semantics. factors involved in the genesis and evolution of the Atlantic
Ocean, mainly relevant to large magmatic events (hotspots,
As to the size of the printed map, publishing experience led large igneous provinces – LIP), but also connected to deep
us to avoid large dimensions owing to printing constraints, intra-continental graben fracturation. Consequently, the Andean
user convenience, display clarity and cost. The final scale is volcanic belt, the Karoo LIP sequence (at ca. 183 Ma) predating
chosen as 1:20,000,000 at the Equator and corresponds to that the initial rifting of the South Atlantic, or the deep inland remote
of the Indian Ocean structural map. The projection is Mercator Cenozoic volcanics, such as in Hoggar or Tibesti, are not shown.
using the WGS-84 ellipsoid generally adopted by the offshore Thereafter, some comments are made on the differents items of
sciences community such as the International Hydrographic the onshore section of the legend.
Organization and the Intergovernmental Oceanographic
Commission. Consequently the north and south boundaries of precambrian
the map were limited to 72˚N and 72°S in order to avoid too
The nearly 4 Ga lasting Archean and Proterozoic formations
much distortion of the polar regions, while retaining significant
were put together in a single Precambrian unit (extracted from
detail in the northern Norwegian-Greenland Sea and Southern
the 3rd edition of the Geological Map of the World, 2010) which
Ocean / Weddell Sea.
displays the subaerial extent of the old cratonic areas. However,
To maintain legibility in the constraints of an A0 sheet the the Appalachian Mountains, the Iberian Peninsula and France,
Map of the Atlantic Ocean comprises a main Structural map may locally include undifferentiated Neoproterozoic-Lower
with an inset of the Geodynamic sketch, accompanied by these Paleozoic formations. A very minute outcrop of Mezoproterozoic
“explanatory notes” where we include a physiographic map. is also located in the southern tip of West Falkland island.
CENTRAL ATLANTIC MAGMATIC PROVINCE (CAMP)
PHYSIOGRAPHY
At the Triassic-Jurassic boundary (200 Ma ago), a dramatic
It would have been difficult to include some additional entities event occurred, related to the break-up of the Pangaea and the
of information onto a single structural map without loss of rifting and subsequent opening of the central part of the Atlantic,
clarity. This applies particularly to the detail involved with and probably also to the second largest mass extinction of living
physiography. However, geophysical data bases do now allow organisms. This event represents catastrophic outpourings of
production of high resolution computer generated images of the huge volumes of tholeiitic basaltic lavas, preserved in eastern
physiography of the Earth’s surface and seafloor using colour North America, northern South America, West Africa, and
shaded relief. These displays are derived from elevation and southwestern Europe (cf. Hames et al., 2003). This magmatic
bathymetric data sets and provide increased information and climax produced the largest known example of continental flood
aesthetic value. For these reasons it was considered necessary to basalt, extending over 7 x 10⁶ km², and maybe more if one takes
defer to the physiographic sketch to the “explanatory booklet”, into account the coeval seaward dipping reflectors within the
reduced to an A3 format. relevant present-day continental margins. The basaltic remnants
5were identified as deeply eroded dykes, related sills, subaerial Bight FZ). Onshore, the volcanism stretches from a relatively
lava flows and buried continental flood basalts, some of the small area of Baffin Island, to eastern Scotland and northern
latter covering large areas such as within the Amazon graben or Ireland (e.g. the Giant’s Causeway), including Greenland traps
in the region adjoining Morocco, Algeria and Mauritania. (both visible on the east and west coast) and the Faroes Islands.
A simplified picture of these occurrences is given in the map,
taken into account published papers (Chabou et al, 2007; Jourdan NEOGENE VOLCANISM
et al., 2003; Jourdan et al., 2009; Knight et al., 2004; McHone, This specific item applies only to the intra-oceanic islands (from
2000; Ragland et al., 1984). These remnants stretch out from Jan Mayen to the north, to Bouvet to the south) and archipelagos
the Amazonian and West African cratons to the south, as far as which, Iceland excepted, appear generally as minute dots owing
Newfoundland and Brittany (Kerforne dyke) to the north, and to the scale of the map. This age corresponds only to the subaerial
the green dashed line gives an approximate idea of the original exposures, regardless of that of their deeper substratum. The
extent of this huge magmatic province. The small exposures ca. 100,000 km² wide Iceland is crossed through by the Atlantic
of doleritic sills (“ophites”) of the Pyrenees are related to the Oceanic spreading system. The onshore pattern (cf. the
CAMP event (Rossi et al., 2003) and are shown as dots on the Geologic Map of the Arctic, 2011) is more complex than that of
map. the normal oceanic accretionary ridge outside the island. This
peculiar feature results from the hotspot interacting with the
EARLY CRETACEOUS RIFTING
plate-tectonics spreading process.
During Early Cretaceous, a phase of continental rifting
The same mode of representation is used for the present-day
connected to the rifting and subsequent oceanic spreading of
sub-aerial part of the volcanic line produced by the subduction
the South Atlantic, is marked by the structuration of a system
of the Atlantic oceanic crust beneath the continental gap left
of grabens (formerly coined as “aulacogens”, i.e. aborted pre-
between North and South America for the Lesser Antilles, and
oceanic rifting): the Benue graben system extending towards
South America and Antarctica for the South Sandwich, both
Central Africa and the conjugate Amazon graben. On the map,
island arcs being similar in shape and size, but not in their
they appear as the 3000 m isopach line (cf. Tectonic Map of
geological evolution.
Africa, 2010; Mapa Tectónico de América del Sur, 1978).
HOTSPOTS
PARANA-ETENDEKA TRAPS
The different types of “hotspots were” plotted in the 3rd edition
At the time of their formation, some 133 Ma ago (Hauterivian),
of the Geological Map of the World (2010). For the present
the quite extensive Parana traps of southern Brazil formed a
Atlantic Map, only four typical oceanic and quite well defined
single LIP with the Etendeka traps of Namibia, as a result of
hotspots were selected in order of importance of today’s activity:
the climaxic production of the then young Tristan da Cunha
Iceland, Azores, Tristan da Cunha, Bouvet. All four, centred on
hospot. Up to recently, the extension of the remnants of the
an island or an archipelago, are located on or in the vicinity of
Namibian traps was somewhat reduced (cf. Geological Map of
the active spreading axis. Iceland is still very active. Tristan
the World, 2010). But, it gained a very significant increase with
da Cunha that played a pivotal role in the genesis of the South
the discovery of coeval basalts subcroppings in eastern Angola
Atlantic and the build-up of the hotspots trails of Walvis Ridge
(cf. Sub-Kalahri Geological Map, 2001; D. Frizon de Lamotte
and Rio Grande Rise, seems to be geologically speaking close
and F. Guillocheau, pers. comm. 2011).
to exhaustion. The Azores hotspot is quite active and is marked
CAMEROON HOT-LINE by a significant thermal bulge over the spreading axis and at the
crossroads of North America, Europe and Africa plates.
Unlike “classical” hotspot tracks, the some 2000 km long
alignment, spanning from the outskirts of Lake Chad to the tiny “ALPINE” OROGENS
island of Pagaloo in the Gulf of Guinea straddles both continental
The evolution of the Atlantic is coeval with the Alpine orogenic
and oceanic lithospheres (Fitton, 1987). This “Cameroon Line”
belts considered in their broad sense. It is the reason why their
shows ages which are not distributed in accordance with a
limits are shown with a specific symbol. In the frame of the
regular space progression of the magmatism throughout time.
map are concerned: the Antarctic Peninsula, Andes, Alps-Jura,
The today active shield-volcano of Mount Cameroon is located
Pyrenees, Betic and Maghrebides.
in the middle of this line. This is the reason why this kind of
feature is labelled “hot-line”. The age distribution of effusive
volcanism and plutonic complexes ranges from present to 70 OFFSHORE AREAS
Ma (Deruelle et al., 2007). These authors have postulated that
MAGNETIC ANOMALIES AND AGE OF THE OCEANIC CRUST
the volcanic occurrences are controlled by oblique shear zones
prolonging present-day oceanic fracture zones. This Cenozoic When seafloor spreading mid-oceanic ridge (MOR) lavas cool
alignment is more or less parallel to the predated Cretaceous they “fossilize” the vector and intensity (normal or reversed)
Benue graben system. Along with the Cameroon Line sensu of the Earth’s magnetic field at that geological time to generate
stricto some probably parental magmatism was plotted, such linear, and (mostly) identifiable magnetic anomalies. As the
as the Quaternary scoria cones of Jos, in Central Nigeria. The lavas were accreted to the seafloor along spreading centres –
Cameroon Hot-Line is shown with a specific colour. the principle element in the geological structure of an ocean
– they can be dated by using a timescale of the geomagnetic
reversal sequence. This has been derived from correlating deep
PALEOGENE VOLCANISM
sea drilling ages of oceanic basement, normally the immediate
A wide area of tholeiitic volcanism characterises a “North overlying sedimernts, with the anomalies. Using the identification
Atlantic Igneous Province”, related to the activity of the powerful of a number of characteristic magnetic anomalies it is possible
Iceland hotspot during the Paleogene, coinciding with the to map the ocean floor age and measure the seafloor spreading
opening of the northern part of the Atlantic Ocean (north of the processes. Crust of unknown age, or of current different age
6interpretations, and crust of unknown type (oceanic/thinned partial melting of the overlying mantle material to provide the
continental) is shown in dark grey to differentiate from known source of the magma that generates the island arc volcanoes.
thinned continental crust (mid grey). The subduction zone, where the oceanic lithosphere plunges
beneath the arc lithosphere, is shown with large solid red
The chronostratigraphic ages (epochs, mainly using ICS
triangles. In front of the Lesser Antilles a powerful terrigenous
geological RGB colours) are used here and not the geomagnetic
input coming from the south (Amazon and Orinoco rivers) has
ages (or “chrons” corresponding to the geomagnetic reversal
built a huge active sedimentary accretionary prism, reaching
chronology) as often displayed in geophysical texts. This is
a thickness of some 20km where Barbados Island is emerging
to maintain consistency with geological events (e.g. the K/T
(Casey Moore, 2000). It is decreasing towards the north and is
boundary). These chronostratigraphic (geological) ages of
disturbed by the subducting Tiburon and Barracuda ridges. This
the oceanic crust have been obtained by interpolation between
active sedimentary subduction front is marked by red line with
digitized magnetic anomaly picks of fixed age (Müller et al.,
small solid triangles.
1997). It was also considered valuable to show the location
of the principal magnetic anomaly picks used in this age Subduction vectors show the orientation and convergence rate.
calculation plus other recent picks that detail seafloor spreading To the north of the Caribbean arc (from Cuba to Bonaire-
better in some areas. In the legend a table provides the list of Curaçao-Aruba) the convergence translates into the Puerto Rico
each standard anomaly (or chron, ‘C’) and its age, following the trench and onto a westerly (left-lateral) strike slip system of
geomagnetic timescale of Cande & Kent (1995) from C1o (0.78 faulting. To the south the convergence is translated into (right-
Ma) to C33o (79.08 Ma), and after Gradstein et al. (1994) for lateral) strike slip motion into the north of South America.
C34 (83.0 Ma). These picks are shown as small circles colour The Scotia Arc has a shape and size quite similar to those of
coded for each chron. As there is no single magnetic pick data the Lesser Antillas arc and translates into a left-lateral transform
set for the whole of the map area the anomalies are shown, fault bounding the Falklands Plateau. It has no significant
consistently, in three sections: sedimentary accretionary prism.
1. North of the Newfoundland-Azores-Gibraltar lineation after
Gaina et al. (2002) plus Müller et al. (1997) anomalies 13y to DEEP-SEA DRILL SITES
34 y in the Newfoundland Basin and Iberian Abyssal Plain. The deep-sea drilling sites occupied by the international scientific
Anomaly C20 is shown as C20o and C20y north and south consortia of DSDP (IPOD), ODP, IODP are shown as black
of the match respectively. Also shown here are anomalies stars with their site identification number. Only those holes that
M0 and M3 in the northern part after Tucholke et al. (2007), reached basaltic basement or marginal thinned continental crust
Miles et al. (1996) and Russel and Whitmarsh (2003). are shown. These drill-holes are important because the basalt
2. Between the Newfoundland-Azores-Gibraltar lineation and sampled can be dated using radiometric techniques and sediment
the Fifteen-Twenty FZ after Müller et al. (1997) and (1999). sampled immediately above the basement can be dated from
their microfauna. In the latter case the age of the oceanic crust
3. South of the Fifteen-Twenty FZ after Müller et al. (1997).
predates the sediment age. As referred to above, these samples
permit control on the age of the oceanic crust and calibration of
STRUCTURAL FEATURES
the magnetic anomaly timescale reversal sequences. However,
The following structural features have been mapped: axes of Sibuet et al. (2007) showed that the serpentinization process in
oceanic accretion (mid-ocean ridges) with full present day some regions can also result in the formation of magnetic grains
spreading rate scalers in cm y-1; extinct spreading axes in the which produce magnetic anomalies similar to those of typical
Baffin Bay, Labrador Sea, Norwegian Sea, Bay of Biscay, Scotia oceanic crust.
Sea and Southern Ocean. Principal selected transform faults,
with their fracture zone extensions, are mapped from satellite SEDIMENT THICKNESS
gravity and published texts. Extensions to, inferred and other
Compilations of sediment thickness, principally from seismic
FZs can be seen from magnetic anomaly pick sequences.
reflection measurements, can be rare and often generalized.
However the Atlantic Ocean has coverage from the NGDC
ANOMALOUS SUBMARINE PLATEAUS
world sediment thickness grid. This has been used to construct
Bathymetric highs associated with anomalous volcanic 1km isopachs (lines of equal thickness) shown as dashed lines
basement (seamounts, ‘aseismic’ ridges, oceanic plateaux, with an overprinted grey hue whose intensity increases between
features of uncertain or disputed origin and selected significant 1 and 15km. The thickest sediments occur along the continental
buried basement features) are shown in a pale yellow hue. margins and thick sediment fans extend seaward of the large
Notable features include the J anomaly Ridge2 south of the river deltas and estuaries such as the St Laurence (Laurentian
Grand Banks, the Greenland-Iceland, the Faeroes ridges, Azores Channel), Amazon cone and Congo Fan.
triple junction, Walvis Ridge and Rio Grande Plateau.
Barbados is the emergent part of a large sedimentary accretion
SUBDUCTION ZONES over 15km thick associated with the convergence of the North
American/South American plates, and Caribbean tectonic
Two subduction zones exist in the Atlantic Ocean/Southern
plate. Here sediment is being taken from the descending oceanic
Ocean, facing the Lesser Antilles and the Sandwich island arcs.
plate and piled up along the plate boundary to form complex
The under-thrusting and relatively cold oceanic crust of the
sedimentry structures, shear zones and methane hydrates.
North and South American plate(s) is progressively heated as it
is forced down into the plastic asthenopheric mantle beneath the
ZONE OF OCEANIC CRUST DEFORMATION
Caribbean and Scotia plates. It becomes dehydrated and triggers
East of the Lesser Antilles Island Arc, and coincident with the
2 The J Anomaly Ridge lies beneath the J Magnetic Anomaly at the young end diffuse boundary between the North and South American Plates,
(M-4 to M-0, Barremian) of the M series magnetic anomalies (cf. Tucholke is a region of deformation caused by adjacent compressional and
and Ludwig, 1982).
7tensional forces. The compressional stress of this sector has led THE SEAFLOOR SPREADING RIDGES
to the formation of the Tiburon and Barracuda ridges. Another
The Atlantic Ocean spreading centre – generically known
region of deformation exists across the Azores – Gibraltar plate
as the Mid-Atlantic Ridge (MAR) – is also known as the
boundary between the Eurasian and African Plates. These areas
Reykjanes Ridge between the Charlie-Gibbs FZ and Iceland,
are shown overprinted with hatching. They are associated with
the Kolbeinsey Ridge north of Iceland to the Jan Mayen FZ and
diffuse seismicity. They also reflect the complex tectonics along
the Mohns Ridge to the north. It forms the boundary between
the south western Eurasian Plate margin.
the North American and Eurasian/African Plates and that
An additional zone of deformation is shown along the Rio between the South American and African Plates. In the South
Grande Plateau, a hot-spot trail, and may not represent the same Atlantic the MAR bifurcates at the Bouvet Triple Junction into
structure as seen in true oceanic crust. the Southwest Indian and America-Antarctica ridges to bound
the Antarctic Plate. These plate boundaries ware created from
CONTINENTAL MARGINS evolving phases of spreading during the Mesozoic and Cenozoic
The delineations used in this map between continental shelf, Eras, at different times and at different rates. This can be seen
slope and oceanic crust should not be confused with the on the map by the width of the coloured strips located on either
legal term ‘extended continental shelf’ used in the United side of the ridge; these bands represent the area of oceanic
Nations Convention on the Law of the Sea (UNCLOS). The floor generated by the ridge during the time of a geological
latter is a political boundary constructed by the application of stratigraphic Series or time Epoch (i.e. Late Cretaceous) since
parameters laid down by the UNCLOS Article 76 which applies early in the Jurassic Period. The thin black arrows that overprint
morphological and geological factors in specific contexts not the ridge axes give the (combined) spreading rate scaler.
used here.
The continental margin represents that part of the continent OVERVIEW OF THE OPENING OF THE ATLANTIC
situated at depth beneath sea level. It extends from the outer OCEAN AND ADJACENT OCEAN BASINS
continental shelf – more or less arbitrarily bounded by the 200m The breakup of Pangea initiated the formation of the Atlantic
isobath – to a continental slope and rise that meets oceanic crust Ocean with rifting during Early to Middle Jurassic time that
at an average water depth of about 3000m. In this map the slope separated Gondwana (South America, Africa and other southern
is not always shown to include its full morphology sensu stricto, continental masses) from Laurasia (North America and Eurasia).
but as a representation of its location bounding the shelf edge Spreading was well established by CM21 time when incipient
and deep water or outer banks. Sediment fans and extended seafloor spreading began in the Caribbean to separate South and
continental rises are not included as slope where they would Central America.
obscure sediment thickness contours. The continent-ocean
Prior to this, east-west orientated Early Jurassic rifting between
boundary may also lie beneath the lower slope and extended
Africa and Antarctica began at around 190 Ma. This initiated the
continental rises.
Karoo volcanics and extended along the east African margin into
The shelf (After rifting, Africa continued to separate from South America As explained, these earthquakes are not distributed randomly,
in the south and at CM11 time (~132 Ma, Early Cretaceous), rather they define accurately the plate boundaries and faults.
Iberia, already fully disconnected from Africa, moved apart At the MAR seismicity is generated by tensional stress exerted
from the Eurasian Plate when opening the Bay of Biscay. by the injection of magma at the axis of the ridge (oceanic
Rifting then began between North America and Eurasia accretion). At transform faults the shear stress is caused from
(Gibraltar – Rockall) and seafloor spreading may have started opposite movements along the fault between the offset ridge
in the Tagus Abyssal Plain by CM3 time (~124 Ma, mid- axes either side of the fault. Both these causes of earthquakes
Early Cretaceous), possibly the earliest identifiable anomaly are generally shallow and of low magnitude.
in that region. After this, mantle exhumation developed in the There is a concentration of earthquakes along the Lesser
Newfoundland basin and Iberia margin, the J anomaly Ridge Antilles Island Arc. This is the only active subduction zone in
and Madeira-Torre Rise formed and normal seafloor spreading the North Atlantic Ocean and forms the boundary between the
resumed and migrated north to establish seafloor spreading by oceanic crust of both American Plates which is being under-
C34 (84 Ma, Late Cretaceous) and later into the Labrador Sea. thrust beneath the Caribbean Plate. Friction occurring at the
The Labrador Sea opened by C30 at the latest, although a C32 sloping interface between the two plates produces the stresses
pick (~72 Ma, latest Cretaceous) is plotted from the data set that generate seismicity during their release, and features what
in crust of unknown age. Spreading then extended to the west is known as a “Wadati-Benioff zone” which in this region
of Rockall by C24 time (~52 Ma, early Eocene) to separate generates the whole range of earthquake magnitudes and focal
Greenland and Eurasia and then ceased first in the Baffin Bay and depths.
then in the Labrador Sea between C20 and C13 time respectively The same process occurs for the seismicity of the South Sandwich
(45 - 33 Ma, mid-Eocene to basal Oligocene) leaving strike slip island arc where the oceanic crust of the South American plate
motion in the Davis Strait. The new spreading centre between dips beneath the crust of South Sandwich microplate.
Greenland and Eurasia (Rockall), formed first along the proto Other earthquakes are seen to be associated with the east
Reykjanes and Mohns Ridges, and then by C13 time along a and west areas of crustal deformation – both associated with
now fossil Aegir Ridge. The latter was abandoned by C7 time plate boundary adjustments. Also the Azores triple junction
(~26 Ma, late Oligocene) when the Jan Mayen continental block bathymetric high volcanic centre, associated with the MAR,
separated from Greenland and spreading jumped to Iceland. shows some off axis activity.
During this time Iberia moved north to partially close the Bay of
Biscay and began to move with Eurasia.
GEODYNAMIC SKETCH
The MAR is offset by fracture zones of various scales. These
express the response to tectonic plates’ motions on a curved The Geodynamic sketch gives an overview of the configuration
Earth. They also play an important role in the circulation of of the plate boundaries from the Norwegian – Greenland Sea to
deep-sea currents in that they form breaches in submarine ridges the Southern Ocean at the present time. Ten lithospheric plates
that normally would impede the circulation of bottom waters appear in the map:
essential to maintain the climatically important, nutrient rich − The large North American, South American, Antarctic,
ocean circulation pathways. African and Eurasian plates;
− The mid-sized Caribbean, Cocos, Nazca (the latter two only
MARGINAL SEAS very partially), and Scotia plates;
Three marginal seas have connections with the Atlantic Ocean. − The South Sandwich and South Shetland micro-plates.
Within the frame of the map, two appear partially (Mediterranean The main bathymetric features, including principal fracture
and Caribbean seas) and one fully (Scotia Sea). The first two zones, are included with their toponomy. It also identifies the
experienced a very complex history if compared to the more major oceanic plateaux and significant seamount chains. The
recent Scotia Sea, and their structural map is either published regions associated with each tectonic plate are colour coded
in June 2012 (Mediterranean) or in progress (Caribbean). This and differentiate, in a generalized way, between oceanic and
is the reason why their structural pattern is here oversimplified. continental regimes. Isolated micro-continents (e.g. the Jan
The basement of the Caribbean Sea is mainly formed of a Mayen micro-continent in the uppermost part of the map),
complex oceanic crust and was shown by a grey stipple on a outer banks and thinned continental crust are shown in their
white background. continental context.
SEISMICITY
Seismicity is an important parameter in the study of current
regional geodynamics. It underlines the limits of the lithospheric
plates (spreading axes, transform faults and subduction P.R. Miles & Ph. Bouysse, CCGM, Paris
zones) and active intra-plate rifting. Earthquake epicentres
are symbolized with open diamonds and are shown for both June 2012
on and off-shore occurrences. The time interval used for the
occurrences is from 1973 to 2006 in order to both represent
activity and maintain clarity. Also to this end only 4 categories
of earthquake magnitude have been selected for display, the
symbol size increasing for magnitude ranges 5.0-5.9; 6.0-6.9;
Acknowledgements:
7.0-7.9; 8.0 and greater. The 4 categories of focal depths are
shown as colour coding of the diamonds for depths 0-35 km; G.M. Elliott, Imperial College, London.
36-70 km; 71-300 km and 301-700 km. J-C. Sibuet, Ifremer, Brest.
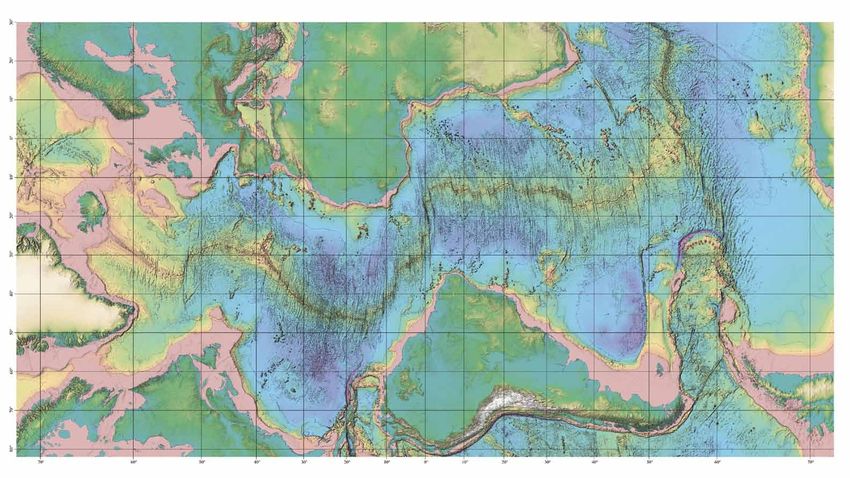
9PHYSIOGRAPHIC MAP O
CARTE PHYSIOGRAPHIQUE
Compiled by
Alexandra Rob
Me
Data: GEBCO 2008 - 30 arc second grad.
World Mercator datum: WGS84 -8648 -7500 -5000 -2500OF THE ATLANTIC OCEAN
E DE L’OCÉAN ATLANTIQUE
/ Compilée par
bert (ENS, Paris)
eters
Isobaths: every 1000 m
0 2500 5000 6813 Isobathes : tous les 1000 mCARTE STRUCTURALE DE L’ATLANTIQUE
A l’échelle de 1/20 000 000
1e édition - 2012
NOTES EXPLICATIVES
RESUMÉ
Ce fascicule accompagne la Carte Structurale de l’Océan Atlantique qui synthétise les inter-
prétations géologiques et les données géophysiques, couvrant plusieurs décennies, compilées à
partir des campagnes en mer et des publications qui en ont résulté.
La carte principale, structurale, représente l’océan et les continents qui l’encadrent avec leurs
traits structuraux simplifiés. Dans le domaine océanique sont représentés les éléments suivants:
• Âge de la croûte océanique, par époques.
• Positions des anomalies magnétiques standard (ou «chrone»), là où elles ont été mesurées ou
interprétées.
• Axes d’expansion océanique, actifs et fossiles.
• Failles transformantes et zones de fracture.
• Reliefs sous-marins «anormaux» et zones de subduction.
• Séquences des réflecteurs océaniques pentés vers l’océan (SDRs).
• Épicentre des séismes et profondeurs des foyers.
• Points-chauds.
• Sites de forages océaniques profonds (DSDP, IPOD, ODP, IODP) où le substratum ou la
croûte transitionnelle ont été atteints.
• Épaisseur des sédiments, les isopaques étant dessinées sur la croûte océanique ou sur les
secteurs de croûte continentale amincie.
• Zones de déformation crustale océanique
Représentation des éléments de géologie continentale liés à l’ouverture de l’océan Atlantique.
La carte structurale est accompagnée d’une Esquisse géodynamique (en encart dans la carte)
et d’une Carte physiographique (insérée au centre de ces notes). Ces deux documents annexes
montrent la disposition des plaques lithosphériques qui couvrent ou enserrent le domaine atlan-
tique, la morphologie de l’ensemble, ainsi que la toponymie d’un certain nombre de structures
sous-marines évoquées dans le texte.
AVANT PROPOS
La Commission de la Carte Géologique du Monde (CCGM/CGMW) est une organisation non-gouvernementale
(ONG) scientifique de catégorie A pour l’UNESCO et affiliée à l’Union Internationale des Sciences Géologiques
(IUGS). Elle a vu le jour, sous une forme embryonnaire, en 1881 lors du 2e Congrès Géologique International (CGI)
de Bologne. Dans les années 1980, la CCGM a co-publié avec l’UNESCO, et pour la première fois, les cartes à petite
échelle des cinq océans de la planète (comprenant l’océan «Antarctique») incluses dans l’Atlas Géologique du Monde.
Deux décennies plus tard, notre connaissance de la nature du fonds des océans avait tant progressé que la Commission
a décidé de mettre en chantier un nouveau type de programme de cartographie des fonds marins, à l’échelle d’un
océan ou d’une mer marginale, dont la première sortie est la Carte Structurale de l’Océan Indien (2004). La présente
carte couvrant la totalité de l’océan Atlantique1, publiée pour le 34e CGI de Brisbane (2012), est la troisième de cette
série et constitue l’extension de la Carte Structurale de l’Atlantique Nord (2008), qu’elle remplace. Elle recouvre la
partie SW de l’océan Indien. La carte a bénéficié pour sa réalisation d’un soutien financier de l’UNECO, du Service
Géologique du Norvège (2008) et de l’IFREMER.
1 Auteurs de la carte : Peter Miles, Philippe Bouysse et Kaiser de Souza avec les contributions de Brian Tucholke, Carmen Gaina,
Laurent Gernigon, Dietmar Müller, Alexandra Robert et le GEUS.
12CARTOGRAPHIER UN OCÉAN PHYSIOGRAPHIE
Réaliser la carte d’un océan en essayant de synthétiser de la Comme on vient de le dire, il aurait été très difficile d’ajouter
manière la plus appropriée ses caractéristiques principales dans sur la carte principale quelque information complémentaire que
le domaine des sciences de la Terre, n’est pas un exercice aussi ce soit, sans en affecter sa perception visuelle. Cela s’applique
facile qu’on pourrait le penser. En voici les raisons: tout particulièrement au volet physiographique. Les bases de
données géophysiques permettent maintenant de produire des
• La carte ne peut pas être une carte géologique, au
images numérisées à haute résolution de la physiographie de
sens strict du terme, c.-à.-d. représentant la nature des
toute la surface terrestre, émergée et immergée, en utilisant une
formations affleurantes (ou sub-affleurantes) comme
représentation du relief combinant couleur et ombrage. Ces
c’est le cas pour les cartes géologiques régulières
procédés de représentation sont dérivés d’ensembles de données
levées à terre. Sinon, la plus grande partie des surfaces
altimétriques et bathymétriques et fournissent des images de
sous-marines serait représentée par des sédiments plio-
plus en plus précises et d’une grande qualité esthétique. Pour
quaternaires.
toutes ces raisons, il a été jugé nécessaire de reporter l’esquisse
• La carte ne peut pas correspondre, non plus, à une
physiographique dans les présentes “Notes explicatives”, mais
carte tectonique en raison de l’évolution spécifique de
réduite au format A3.
la lithosphère océanique dont l’age ne dépasse jamais
les quelque 200 Ma.2 CARTE STRUCTURALE
• La carte n’est pas la simple cartographie d’un paramètre
géophysique (carte de la sismicité, des différentes INTRODUCTION
anomalies gravimétriques, du flux de chaleur,…). L’océan Atlantique résulte de l’éclatement du super-continent
• La carte devrait inclure des éléments de la géologie Pangée, qui commença à se produire quand ce qui est maintenant
des terres émergées (continents environnants et l’Amérique du Nord se sépara de l’Afrique pour former au
îles disséminées au sein de l’océan), alors que ce Jurassique moyen et supérieur, l’Atlantique nord-central,
n’est pas le cas, jusqu’à présent, pour la plupart extension occidentale de l’océan Téthysien d’orientation sub-
des cartes consacrées aux océans. En effet, de latitudinale. S’individualisent ainsi les super-continents Laurasia
telles informations sont susceptibles d’apporter un (Amérique du Nord et Eurasie) et Gondwana (Amérique du Sud,
éclairage complémentaire à la compréhension de Afrique, Arabie, Inde, Madagascar, Australie, et Antarctique).
l’évolution du bassin océanique, comme par exemple Une deuxième phase de rupture a lieu lorsque le Gondwana
la correspondance des boucliers précambriens de part se divise lui-même en plusieurs blocs continentaux. En ce qui
et d’autre du bassin océanique, ou la relation d’une concerne l’Atlantique Sud, il s’agit d’abord du rifting entre
subduction avec l’arc volcanique correspondant. l’Afrique et l’Antarctique, puis de l’Amérique du Sud se séparant,
• Enfin, la carte ne peut pas être le simple empilement progressivement, de l’Afrique, du sud vers le nord. Enfin,
des donnés géologiques et géophysiques qui décrivent l’Amérique du Nord et le Groenland se détachent de l’Eurasie
cet océan. Une sélection raisonnée de ces dernières est pour ouvrir le NW de l’Atlantique et la mer de Norvège. Ainsi,
indispensable pour éviter qu’une telle accumulation ne les océans Atlantique et Indien continuent leur expansion, en
compromette un équilibre acceptable entre lisibilité et stoppant l’extension téthysienne, et l’Atlantique va désormais
niveau d’information. croître suivant un axe subméridien. Ensuite, le mouvement de
Pour toutes ces raisons, nous avons choisi de dénommer ce type la plaque Afrique passe d’une direction W à une direction NW,
de concept cartographique, “Carte Structurale», un terme qui vers l’Europe, tandis que l’Amérique du Sud commence à se
n’est pas trop connoté sémantiquement. déplacer vers le N. L’interaction de ces mouvements avec ceux
des plaques Cocos, Nazca, et Caraïbe génère un ensemble de
En ce qui concerne la taille de la carte imprimée, l’expérience
frontière complexe pour la plaque Caraïbe qui affronte la croûte
nous a conduits a adopter un format raisonnable, car de trop
océanique de l’Atlantique Central. À cet endroit, la frontière
grandes dimensions occasionnent de nombreux inconvénients:
entre les plaques Amérique du Nord et Amérique du Sud est mal
limitation due à la taille des presses, problèmes de manutention
définie et est distribuée le long d’une bande qui fait face à la
et d’espace pour le stockage et l’affichage mural, nécessité de
convexité de l’arc insulaire des Petites Antilles.
proposer un prix de vente attractif. C’est pourquoi l’échelle finale
d’impression est le 1/20 000 000 (à l’équateur), et correspond à ZONES ÉMERGÉES
celle de la Carte Structurale de l’Océan Indien. La projection
Sur cette carte, les zones émergées ont été représentées
de Mercator utilise l’ellipsoïde WGS-84 généralement adopté
d’une manière un peu différente de celle qui avait été retenue
par la commodité des sciences océanographiques, comme
précédemment pour les cartes CCGM des océans. La géologie
l’Organisation Hydrogéographique Internationale et la
a été simplifiée et l’accent a été mis sur les facteurs de premier
Commission Océanographique Intergouvernementale. En
ordre qui ont été impliqués dans la genèse et l’évolution de
conséquence, les limites nord et sud de la carte ont été fixées à
l’océan de l’océan Atlantique, ressortissant principalement à
72°N et 72° S afin d’éviter une trop grande distorsion des régions
une activité magmatique importante (points-chauds, grandes
polaires, tout en préservant des détails intéressants en mer de
provinces magma- tiques ou LIP en anglais), mais aussi à une
Norvège-Groenland et dans l’océan Austral/mer de Weddell.
fracturation intra-continentale profonde (grabens). C’est la
Afin de maintenir la lisibilité de la carte, dans le cadre d’une raison pour laquelle la longue chaîne volcanique des Andes, la
impression en format A0, la Carte Structurale de l’Océan séquence LIP du Karoo (vers 183 Ma) antérieure au rifting de
Atlantique comprend une carte structurale principale, l’Atlantique Sud, ou les secteurs volcaniques isolés, à l’intérieur
accompagné d’une Esquisse Géodynamique en encart. A des continents, comme le Hoggar ou le Tibesti, n’ont pas été
l’intérieur de ces Notes explicatives, on trouvera une Carte représentés. Ci-après, on trouvera quelques commentaires
Physiographique. sur les différents éléments de la légende consacrée aux zones
2 Ma = million d’années émergées.
13précambrien l’importance des restes de trapps en Namibie étaient limités à une
L’Archéen et le Protérozoïque qui constituent quelque 4 Ga de zone côtière (cf. La Carte Géologique du Monde, 2010). Mais la
l’histoire de la Terre ont été regroupés dans l’unité Précambrien découverte, par forage, de basaltes contemporains enfouis dans
(contours tiré de la 3e édition de la Carte Géologique du Monde, l’Angola oriental permet d’étendre significativement vers l’est,
2010) qui montre l’extension des affleurements des vieilles la superficie initiale de ces trapps (cf. Sub-Kalahari Geological
zones cratoniques. Cependant, certains secteurs des Appalaches, Map, 2001; D. Frizon de Lamotte et F. Guillocheau, pers. comm.
de la péninsule Ibérique et de France, peuvent localement inclure 2011).
des formations du Néoprotérozoïque-Paléozoïque inférieur
LIGNE CHAUDE DU CAMEROUN
indifférencié. Un petit affleurement de Mesoprotérozoïque a été
reporté sur l’extrémité sud de l’île Ouest-Falkland. Cette ligne volcanique qui s’étend des approches méridionales
du lac Tchad jusqu’à la petite île de Pagalu (ex-Annobon)
PROVINCE MAGMATIQUE DE L’ATLANTIQUE CENTRAL dans le golfe de Guinée, affecte une lithosphère continentale
(CAMP) puis océanique, ce qui est inhabituel. De plus, cette “ligne du
À la limite Trias-Jurassique (il y a 200 Ma) se produit un Camerounˮ montre que les âges des édifices éruptifs ne sont pas
événement majeur lié au rifting de la Pangée conduisant à en accord avec une migration régulière au cours du temps. Le
l’ouverture de la partie centrale de l’Atlantique et probablement volcan actif du Mont Cameroun se trouve au milieu de cette
à la deuxième plus grande extinction en masse d’organismes ligne. C’est pourquoi ce genre de linéament volcanique, qui ne
vivants. Il s’ensuit un épanchement catastrophique d’énormes correspond donc pas à l’image classique d’une trace de point-
volumes de laves basaltiques dans l’est de l’Amérique du chaud, a été dénommé “ligne-chaudeˮ. La distribution des âges
Nord, le nord de l’Amérique du Sud, l’Afrique Occidentale, et du volcanisme effusif et des complexes plutoniques associés,
du sud-ouest de l’Europe et dénommé “Province Magmatique s’étend de 70 Ma à l’Actuel (Deruelle et al., 2007). Ces auteurs
de l’Atlantique Centralˮ (cf. Hames et al, 2003). La crise ont postulé que les manifestations de ce magmatisme sont
magmatique aurait produit, d’après les reconstitutions, la plus contrôlées par des décrochements continentaux, obliques par
grande surface de trapps (ou “basaltes de plateauxˮ issus de rapport à cette ligne, situés dans le prolongement des zones
laves très fluides) connue à ce jour, avec quelque 7 x 10⁶ km² de fracture actuelles du domaine océanique. Cet alignement
de superficie, et peut-être même plus si l’on prend en compte cénozoïque est plus ou moins parallèle au système, antérieur,
des couches particulières, de même âge, repérées dans le bâti des grabens de la Benoué. En même temps que la ligne du
des marges continentales bordières. Aujourd’hui, il n’en reste Cameroun sensu stricto, identifiable par une couleur rouge vif,
que des témoins représentés par des dykes profondément érodés on a reporté un magmatisme probablement parent, comme des
et des sills associés, des affleurements de laves relativement cônes de scories quaternaires de la région de Jos, dans le Nigeria
réduits, et des occurrences enfouies pouvant couvrir des surfaces central.
relativement grandes, comme dans le graben de l’Amazone ou
VOLCANISME PALÉOGÈNE
dans la région à cheval sur le Maroc, l’Algérie et la Mauritanie.
Un large secteur de volcanisme tholeiitique caractérise une
Une image simplifiée de ces indices éparpillés est donné dans
“Province Magmatique Nord-Atlantiqueˮ, lié à l’activité du
la carte, à partir de publications (Chabou et al, 2007; Jourdan
puissant point-chaud de l’Islande au cours du Paléogène, et
et al, 2003; Jourdan et al, 2009; Knight et al., 2004; McHone,
qui coïncide avec l’ouverture de la partie nord de l’océan
2000; Ragland et al., 1984). Ces témoins s’étendent depuis
l’Atlantique (au nord de la ZF de Bight). A terre, le volcanisme
les cratons d’Amazonie et d’Afrique occidentale dans le Sud,
s’étend depuis une zone relativement restreinte de l’île de Baffin
jusqu’à Terre-Neuve et la Bretagne (dyke Kerforne), dans le
jusqu’à l’Écosse occidentale (p. ex. la Chaussée des Géants en
nord. La ligne en tiretés vert donne une idée approximative de
Irlande), et comprenant les trapps du Groenland visibles à la fois
l’extension originelle de cette énorme province magmatique.
sur les côtes est et ouest du Groenland et les îles Féroé.
De petits affleurements de sills doléritiques (“ophitesˮ) dans les
Pyrénées sont issus de l’événement CAMP (Rossi et al., 2003) VOLCANISME NÉOGÈNE
et sont figurés par des points. Cette unité cartographique s’applique uniquement aux îles
RIFTING DU CRÉTACÉ INFÉRIEUR et archipels intra-océaniques (de Jan Mayen au nord jusqu’à
Bouvet au sud) qui, à l’exception de l’Islande, n’apparaissent
Au cours du Crétacé inférieur, une phase de rifting continental
sur la carte que comme des petits points. Cet âge néogène ne
est connectée au rifting principal qui a conduit à l’expansion
correspond qu’aux formations de surface, quel que soit l’âge de
océanique de l’Atlantique Sud. Elle est marqué par une
leur substratum. L’Islande, d’une superficie de quelque 100 000
structuration en grabens (naguère appelés “aulacogènesˮ,
km² est traversée par le système d’expansion océanique de
désignant un rifting pré-océanique avorté) : il s’agit du système
l’Atlantique. Ce dispositif, à terre, est plus complexe (cf. la Carte
de grabens de la Bénoué qui s’étend vers l’Afrique Centrale,
Géologique de l’Arctique, 2011) que celui qui caractérise, en
et du grand graben conjugué de l’Amazone. Ces derniers sont
mer, une ride d’accrétion océanique. Cette particularité résulte
représentés sur la carte par la ligne isopaque des 3000 m de
de l’interaction d’un point-chaud très actif avec le mécanisme
remplissage sédimentaire (cf. la Carte Tectonique de l’Afrique,
d’expansion généré par la seule tectonique des plaques.
2010; la Carte Tectonique de l’Amérique du Sud, 1978).
Ce même mode de représentation est appliqué à la partie émergée
TRAPPS DU PARANA-ETENDEKA de la ligne volcanique actuelle produite par la subduction de la
Au moment de leur formation, il y a environ 133 Ma croûte océanique atlantique dans les hiatus ménagés entre les
(Hauterivien), les vastes trapps du Parana (Brésil méridional) masses continentales d’Amérique du Nord et du Sud, pour les
ne formaient qu’une seule et même unité “LIPˮ avec ceux que Petites Antilles, et d’Amérique du Sud et d’Antarctique, pour les
l’on retrouve aujourd’hui en Namibie dans la région d’Etendeka, Sandwich du Sud; ces deux arcs insulaires étant assez similaires
conséquemment à la phase d’activité paroxysmale (stade pour la forme et la taille, mais dissemblables en ce qui concerne
panache) du point-chaud de Tristan da Cunha. Jusqu’à il y a peu, leur évolution géologique.
14Vous pouvez aussi lire