Two non-destructive neutron inspection techniques: Prompt gamma-ray activation analysis and cold neutron tomography
←
→
Transcription du contenu de la page
Si votre navigateur ne rend pas la page correctement, lisez s'il vous plaît le contenu de la page ci-dessous
Département de physique
                    Université de Fribourg (Suisse)

Two non-destructive neutron inspection techniques:
 Prompt gamma-ray activation analysis and cold
              neutron tomography

                                THESE

           Présentée à la Faculté des Sciences de l’Université
           de Fribourg (Suisse) pour l’obtention du grade de
                        Doctor rerum naturalium

                          Sébastien Baechler
                          de Rechthalten (FR)

                            Thèse No 1381

                        Edition Mécanographie
                                 2002
Acceptée par la Faculté des Sciences de l’Université de Fribourg (Suisse) sur proposition de:

Prof. Dr. P. Schurtenberger, Université de Fribourg, Président du Jury,
Prof. Dr. J.-C. Dousse, Université de Fribourg, Directeur de Thèse,
Prof. Dr. J. Jolie, Universität zu Köln, Directeur de Thèse,
Dr. E. Lehmann, Paul Scherrer Institut, Rapporteur.

Fribourg, le 3 juillet 2002

Les directeurs de thèse:                                                   Le doyen

Prof. Dr. J.-C. Dousse                   Prof. Dr. J. Jolie                Prof. Dr. A. von Zelewsky
Contents

Abstract                                                                          1

Résumé                                                                            2

PART I : PROMPT GAMMA-RAY ACTIVATION ANALYSIS

I-1 Introduction                                                                  3

I-2 Publications                                                                  9
    • Prompt gamma-ray activation analysis for determination of boron in
       aqueous solutions                                                          9
    • The k0-method in cold-neutron prompt gamma-ray activation analysis         21
    • Non-destructive analysis of a bulky sample from a natural fossil reactor   33

PART II : COLD NEUTRON TOMOGRAPY

II-1 Introduction                                                                43

II-2 Publications                                                                49
    • The new cold neutron tomography set-up at SINQ                             49
    • New features in cold neutron radiography and tomography, Part I :
       Thinner scintillators and a neutron velocity selector to improve the
       spatial resolution                                                        61

List of publications                                                             79
Curriculum vitae                                                                 83
Acknowledgements                                                                 85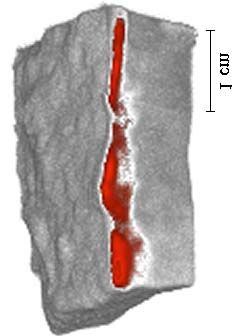
1
__________________________________________________________________________________
Abstract
Two non-destructive inspection techniques employing both cold neutron beams have been developed
at the Swiss spallation source SINQ of the Paul Scherrer Institute: (1) prompt gamma-ray activation
analysis (PGAA) and (2) neutron tomography.
PGAA is a nuclear analytical method for identifying and quantifying simultaneously the elements
contained in a sample. The technique consists in detecting capture gamma rays emitted by the target
material during neutron irradiation. The PGA facility at SINQ was designed, constructed, and tested
by Prof. J. Kern and Dr. M. Crittin. In the present work, a new analytical approach, namely the k0-
standardization, has been studied and applied to obtain higher accuracies in the determination of
element concentrations. First, this method has been applied successfully for quantitative determination
of boron in aqueous solutions. Then, standard reference materials were analyzed to assess the accuracy
of the method for multielement determination. Finally, the technique was applied to various samples
from archeology, geology, medicine, nuclear industry and material science. Of particular interest was
the concentration determination of hydrogen and boron, two elements that are difficult to measure
with other techniques. Besides, a neutron focusing capillary lens was used to measure element
concentrations in two-dimensional array across the surface of a bulky sample from a natural reactor. A
description of the PGAA technique and of some results is presented in the first part of this thesis.
A new cold neutron tomography set-up was developed at SINQ in collaboration with the University of
Ghent (Belgium) with the objective to complement the existing thermal neutron radiography station.
The new device was set up at the same beam line as the PGA instrument so that the two facilities were
employed alternately. Neutron tomography is similar to X-ray tomography, which is widely used in
medicine and industry. It provides three-dimensional information on the inner structure of a sample.
As a result of the differences between neutron and X-ray interaction mechanisms, complementary
information is provided by the two techniques. Unlike X-rays, neutrons have the prominent ability to
penetrate most metals easily while delivering a high contrast for many light elements. Besides, if cold
neutrons are used, thicker sections of metallic materials can be inspected. The whole tomography
system consisted of a rotation table and an imaging device, which was based on a scintillator
converting the neutron beam to a light image viewed with a CCD camera. The achievable resolution
was limited by the inherent divergence of the neutron guide (L/D = 70) and was about 0.24 mm under
optimal conditions. Furthermore, a neutron velocity selector was used to perform radiography and
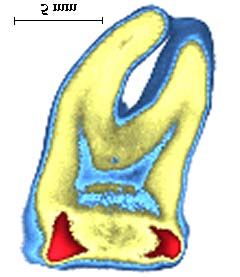
tomography experiments with monochromatic neutron beams. Finally, examinations were performed
on objects covering a broad range of application fields, such as geology, dentistry, archeology, nuclear
industry and aerospatial industry. A detailed presentation of the cold neutron tomography set-up and
some results obtained with this technique are given in the second part of this thesis.
Ph.D. Thesis, S. Baechler2
__________________________________________________________________________________
Résumé
Deux techniques d’inspection non-destructives utilisant des faisceaux de neutrons froids ont été
développées à la source de neutrons SINQ de l’Institut Paul Scherrer : (1) l’analyse par activation
neutronique prompte (PGAA) et (2) la tomographie neutronique.
L’analyse par PGA (Prompt Gamma-ray Activation) est une méthode nucléaire qui permet de
déterminer la concentration d’éléments présents dans un échantillon. Cette technique consiste à
détecter les rayons gamma prompts émis par l’échantillon suite à des réactions de captures
neutroniques. L’installation PGA à SINQ a été conçue, construite et testée par le prof. J. Kern et la Dr.
M. Crittin. Cette thèse propose une nouvelle approche analytique, nommée la standardisation du k0,
qui permet d’obtenir une meilleure précision dans la détermination des concentrations. Cette méthode
a été utilisée tout d’abord pour mesurer la quantité de bore dans des solutions aqueuses. Puis, la
mesure de matériaux de référence a prouvé la validité de la méthode pour des analyses multi-
élémentaires. Finalement, divers échantillons provenant de domaines très variés tels que l’archéologie,
la géologie, la médecine, l’industrie nucléaire et la science des matériaux, ont été étudiés avec cette
technique. Le PGAA s’est révélé particulièrement important pour l’analyse de l’hydrogène et du bore
qui sont difficilement mesurables avec d’autres techniques. En outre, une lentille à neutrons a permis
de déterminer la distribution bidimensionnelle d’éléments dans un échantillon provenant d’un réacteur
naturel. La première partie de cette thèse décrit la technique et les résultats de l’analyse par PGA.
Une installation de tomographie utilisant des neutrons froids a été développée en collaboration avec
l’Université de Gand (Belgique) sur la même ligne de faisceau que le système PGA, les deux
instruments étant utilisés de façon alternée. La tomographie neutronique est semblable à la
tomographie par rayons X, laquelle est couramment utilisée dans les sciences médicales et l’industrie.
Comme celle-ci, elle fournit des informations tridimensionnelles sur la structure des échantillons.
Cependant, comme les processus d’interaction des neutrons et des rayons X avec la matière sont
différents, les informations fournies sont complémentaires. Contrairement aux rayons X, les neutrons
pénètrent facilement la plupart des métaux, ce qui permet d’améliorer le contraste des éléments légers.
Par ailleurs, les neutrons froids rendent possible l’étude de matériaux métalliques encore plus denses.
L’installation comprenait une table de rotation et un détecteur, lequel était composé d’un scintillateur
et d’une caméra CCD. La résolution, qui était limitée par la divergence du guide de neutrons (L/D =
70), était d’environ 0.24 mm dans des conditions optimales. En outre, un dispositif permettant de
sélectionner la vitesse des neutrons a été utilisé pour des expériences de radiographie et de
tomographie nécessitant des faisceaux monochromatiques. Finalement, différentes études ont porté sur
des objets provenant de la géologie, l’archéologie, la médecine dentaire, l’industrie nucléaire et
l’aérospatiale. Cette technique et ses résultats font l’objet de la deuxième partie de cette thèse.
Ph.D. Thesis, S. BaechlerPart I : Prompt Gamma-ray Activation Analysis 3
__________________________________________________________________________________
PART I : PROMPT GAMMA-RAY ACTIVATION ANALYSIS
I-1 Introduction
Basic concept
Prompt gamma-ray activation analysis (PGAA) is a non-destructive nuclear method for performing
both qualitative and quantitative multi-element analysis of major, minor, and trace elements in
samples. Especially, the technique is used for the analysis of light elements such as H, B, C, N, Si, P, S
and Cl, as well as for heavy elements such as Cd, Sm, Gd and Hg [1].
The nuclear reaction used for PGAA is the neutron capture, also called (n,γ) reaction. When a neutron
is absorbed by a target nucleus, the compound nucleus is in an excited state with energy equal to the
binding energy of the added neutron. Then, the compound nucleus will almost instantaneously (< 10-14
s) de-excite into a more stable configuration through emission of characteristic prompt gamma rays. In
many cases, this new configuration yields a radioactive nucleus which also de-excites (or decays) by
emission of characteristic delayed gamma rays. PGAA is based on the detection of the prompt gamma
rays emitted by the target during neutron irradiation, while neutron activation analysis (NAA) is
utilizing the delayed gamma rays from the radioactive daughter nucleus (Fig. 1).
Prompt β-particle
Target gamma ray Radioactive
nucleus nucleus
Product
Neutron
nucleus
Compound Delayed
nucleus gamma ray
Fig. 1. Diagram illustrating the neutron capture by a target nucleus followed by the emission of gamma rays.
Ph.D. Thesis, S. Baechler4 I-1 Introduction
__________________________________________________________________________________
Consequently, PGAA is a complementary technique to NAA by allowing determination of elements
that do not form radioactive products after irradiation (e.g., H and B), and elements for which the half
life is too long to be conveniently measured by NAA (e.g., C.). Boron is the only exception to the
usual prompt gamma-rays measurement, in which the gamma measured is not due to the (n,γ) reaction.
Indeed, boron (like lithium-6) reacts with neutrons by emissions of α-particles, i.e. via the reaction
10
B(n, α)7Li. Most of the 7Li are formed in the excited state and de-excited instantaneously (7.3⋅10-14 s)
10
by emission of 477 keV gamma-rays. Thus, the boron neutron capture process is written as B(n,
αγ)7Li.
The PGAA technique requires mainly a source of neutrons and high-resolution spectrometers for
measurement of gamma rays with energies over the range from about 100 keV to 11 MeV. Then, the
energies of the prompt gamma rays identify the neutron-capturing elements, while the intensities of
the peaks at these energies reveal their concentrations. The development of analytical methods for
PGAA is given in details further in this chapter (see k0-standardization approach).
The PGA facility at PSI
The PGA facility was installed at the end of the cold neutron guide 1RNR12 at the Swiss spallation
source SINQ (Paul Scherrer Institute, PSI). At the SINQ, neutrons are produced with a spallation
reaction, in which a heavy metal (lead) is bombarded with the proton beam from the PSI accelerator
[2]. In 2001, the neutron flux at the exit of the PGA guide was about 1.8⋅108 n/cm2 at a nominal proton
current of 1.2 mA on the SINQ target.
The PGA set-up was designed, constructed, and tested by Prof. J. Kern and Dr. M. Crittin during her
Ph.D. work. The system consisted mainly of a sample chamber and holder, two spectrometers, i.e. a
Compton-suppressed spectrometer and a pair spectrometer, and detector shielding against neutrons
and gamma radiation. An interesting feature of this installation is the use of a neutron focusing lens to
perform two-dimensional scanning of samples. The PGA facility was described at length in Ref. [3]
and more succinctly through the papers in chapter I.2.
New software for acquisition (GARDAS, namely Gamma-ray Data Acquisition Software, by S.
Baechler) and for analysis (PEGASE, namely Program Evaluating Gamma-ray Spectra for the
determination of Elemental compositions, by Dr. L. Genilloud [4]) were developed under the Labview
environment.
Ph.D. Thesis, S. BaechlerPart I : Prompt Gamma-ray Activation Analysis 5
__________________________________________________________________________________
k0 standardization approach
For a sample irradiated in a neutron beam with flux φ for a time t, the peak area A of a neutron capture
γ-ray of energy Eγ from mass m of element x is in given by :
m x N Aθ x
Ax , Eγ = N x σφtI γ , x ε γ , x = ⋅ σφtI γ , x ε γ , x (1)
Mx
where Nx is the number of target nuclei, NA the Avogadro's number, θ the abundance of the capturing
isotope, M the atomic weight, σ the effective cold neutron capture cross-section, Iγ the γ-ray
abundance per neutron capture and ε the absolute full energy peak detection efficiency. Since most of
the factors in Eq. (1) have constant values, the peak area is only proportional to the mass and the
irradiation time. However, Iγ and σ are given with insufficient accuracy in nuclear data libraries and
thus the absolute method has not been pursued in PGAA work.
The usual analysis for PGA was carried out using a comparative method. Indeed, element
concentrations (or masses) were determined by comparing the gamma-ray count rate of an element in
an unknown sample to the corresponding element sensitivity. The analytical sensitivity S of an
element x is defined as the gamma-ray count rate of a known amount of the element:
Aγ t
Sx = (in cps⋅mg-1) (2)
m
This method, also called the relative standardization, has been applied to the PGA measurements at
SINQ by Dr. M. Crittin during her Ph.D. work.
However, element sensitivities are dependent upon the geometry and composition of the sample [5]. If
the sample matrix contains large concentrations of neutron absorbing nuclides, self-shielding occurs,
resulting in a decrease in element sensitivities. The presence of large concentrations of neutron
scattering nuclides may increase or decrease sensitivities, depending on the geometry of the sample.
Furthermore, scattering of cold neutron within the warm target results in an increase in the average
neutron energy, and a significant decrease in element sensitivities. The neutron flux and its energy
distribution are perturbed not only through complicated processes of absorption and scattering within
the sample, but also though the scattering from the wall of the sample box and from the atoms of the
ambient gas.
One approach to the problem is to prepare standards matching closely the sample in geometry and
composition for every element to be determined. On the other hand, this approach is time consuming
for multi-element analysis or for a large variety of samples.
Ph.D. Thesis, S. Baechler6 I-1 Introduction
__________________________________________________________________________________
The analytical biases due to neutron scattering and absorption are largely eliminated using the internal
monostandard method (or k-standardization) [5]. In other words, the sensitivity for a studied element x
is determined relatively to that of an internal comparator c. Then, using Eq. (1) and (2), the relevant
sensitivity ratio, namely the k-factor, is given by the following expression:
S x θ x σ 0, x I γ , x M x ε γ , x
k c ( x) = = ⋅ (3)
S c θ c σ 0, c I γ , c M c ε γ , c
It has been assumed that, for nearly all elements at neutron energies less than 5 meV, the neutron cross
section (σ) is inversely proportional to velocity v, hence σ=σ0⋅v0/v, where v0 is the standard velocity of
thermal neutron (2200 m/s). Thus, the k-factors are independent of the neutron energy, and the sample
matrix and geometry. This approach has been applied successfully at the PGA facility of SINQ for
quantitative determination of boron in aqueous solutions. The paper related to this study has been
accepted for publication in Nuclear Instruments and Methods in Physics Research A.
Furthermore, the k-factors can be evaluated as universal constants by eliminating the detector
efficiency dependance and thus applied in any PGA system:
S x ε γ ,x θ x σ 0, x I γ , x M x
k 0,c ( x ) = = (4)
S c ε γ ,c θ c σ 0, c I γ , c M c
Knowledge of the prompt k0-factors allows the determination of the relative concentration of any
element detectable in the sample. The relative concentration C of element x with respect to element y
in the same sample is given by the formula:
m x Sx ε γ , x k 0, c ( x )
Cx, y = = (5)
m y Sc ε γ ,c k 0,c ( y)
If the mass (or concentration) of one element is known, the absolute concentration of any other
element can be determined. Otherwise it is necessary to measure only a single standard containing the
comparator element to determine absolute concentrations. In this case the standard should be of
comparable geometry and have comparable scattering and absorption properties.
Prompt k0-factors have been determined for 26 elements to facilitate quantitative analysis, without the
necessity of using element standards. Results of this study were submitted for publication in Journal of
Radioanalytical and Nuclear Chemistry. In a previous work, theoretical k0-values were used in
combination with the neutron lens to perform elemental mapping of a sample coming from a natural
fossil reactor. For that study, more emphasis was given to qualitative than quantitative results. The
results of this project have been published [J. Radioanal. Nucl. Chem., 250 (2001) 39].
Ph.D. Thesis, S. BaechlerPart I : Prompt Gamma-ray Activation Analysis 7
__________________________________________________________________________________
Applications
Many applications, covering a wide variety of fields, were realized in collaboration with partners from
universities and research institutes. The most interesting applications fields are highlighted in the
following Table together with the object of the analysis and the different collaborations (more details
are given in chapter I.2).:
Fields Objects/Analysis Collaborations
Major components (Cu, Zn, Sn, Archeologists A. Mazur & K. Mazur (Musée
Archeology
Pb) in Roman brooches romain d’Avenches)
Boron in water samples Prof. U. Krähenbühl (Univ. Bern), J. Grimm,
(Diplomarbeit Chemie, Univ. Bern), Pierre
Geology
Multi-element analysis of powder Christe (Ph.D. Thesis, Univ. Basel)
samples
Boron taken up by cells in a new Dr. N. Stritt (Diploma-thesis NDS Medizin
Medicine
treatment for rheumatoid arthritis. Physik, ETHZ), Dr. N.E.A. Crompton (PSI)
Multi-element analysis of ashes Dr. H.F. Beer (PSI), Dr. P. Zimmermann (PSI)
Nuclear industry
from the PSI-incinerator.
Hydrogen in YBCO crystal Dr. H. M. Ronnow (Institut Laue-Langevin)
Hydrogen in Zr-alloys Dr. E. Lehmann (PSI)
Boron in Ni3Al-alloys F. della Torr (Ph.D. Thesis, PSI)
Material science
Boron in graphite reactor Dr. K. Kirch (PSI)
Determination of Ge/Bi & Si/Bi- V. Vaithianathan (Crystal Growth Centre, Anna
ratios in BGO/BGSO crystals University, India)
Outlook
The PGA facility was dismantled in January 2002 and will be transferred to the new Munich research
reactor FRM-II in a near future. A net increase of the performances is expected due to the higher
neutron flux available at FRM-II and the use of the new generation of highly efficient gamma-ray
spectrometers.
Ph.D. Thesis, S. Baechler8 I-1 Introduction
__________________________________________________________________________________
References
[1] Z. B. Alfassi, C. Chung (Ed.), Prompt Gamma Neutron Activation Analysis, CRC Press, Boca
Raton, Florida, 1995.
[2] For further information, see http://asq.web.psi.ch/ASQ/facilities/SINQSYSTEMS.html).
[3] M. Crittin, J. Kern, J.-L. Schenker, Nucl. Instr. and Meth. A 449 (2000) 221.
[4] L. Genilloud, PEGASE. Program evaluating gamma-ray spectra for the determination of
elemental compositions. Internal Report IFP-PAN, University of Fribourg, Switzerland, 2000.
[5] R.L. Paul, J. Radioanal. Chem. 191 (1995) 245.
[6] G. L. Molnár, ZS. Révay, R. L. Paul, R. M. Lindstrom, J. Radioanal. Chem. 234 (1998) 21.
Ph.D. Thesis, S. BaechlerNucl. Instr. and Meth. A 488 (2002) 410. 9
__________________________________________________________________________________
Prompt gamma ray activation analysis for determination
of boron in aqueous solutions
S. Baechler a,b, P. Kudejova c, J. Jolie c, J.-L. Schenker a, N. Stritt d
a
Physics Department, University of Fribourg, Ch. du Musée 3, CH-1700 Fribourg, Switzerland
b
Paul Scherrer Institute, CH-5232 Villigen, Switzerland
c
Institut für Kernphysik, Universität zu Köln, D-50937 Köln, Germany
d
Bundesamt für Gesundheit, CH-3003 Bern, Switzerland
Prompt gamma-ray activation analysis (PGAA) is a nuclear analytical technique for the determination of trace
and other elements in solid, liquid or gaseous samples. The method consists in observing gamma rays emitted by
a sample during neutron irradiation. Of particular importance for PGAA is the measurement of boron. Indeed,
this technique gives the opportunity to detect boron concentration down to the ppm or ppb level depending on
the sample matrix. Furthermore, boron cannot be easily measured by other methods without risks of
contamination. Trace analysis of boron in liquids has been performed and characterized at the PGA facility of
the neutron spallation source SINQ (Paul Scherrer Institute, Switzerland). First, a calibration curve was
determined with standard boron solutions. Then, the PGAA was applied for the determination of boron in
geological water samples. The results were compared with ICP-MS measurements. Finally, the method yielded
promising results to measure the concentration of boron taken up by cells in a new treatment for rheumatoid
arthritis.
Keywords: Prompt gamma-ray activation analysis; Boron detection; Non-destructive.
__________________________________________________________________________________________
1. Introduction for the identified elements. The measurements
used to detect boron are based on the detection
Prompt gamma-ray activation analysis of the 478 keV gamma rays following the
10
(PGAA) is a non-destructive technique to reaction B(n,α)7Li. The isotopic abundance
10
identify elements and determine their of B in natural boron is 18.3% of weight
concentration in a sample [1]. The method is units. The recoiling 7Li nucleus, initially in an
based on the detection of capture gamma rays excited state, decays with 94% by the Doppler-
emitted by a sample during neutron irradiation. broadened 478 keV prompt gamma ray [2].
Then, the elemental concentration is retrieved Thus, the boron peak is easy to identify in a
Ph.D. Thesis, S. Baechler10 I.2 Publications
__________________________________________________________________________________
prompt gamma-ray spectrum, because it is protons beam bombards a lead target, causing
wider than the other. it to be broken down whereby many neutrons
The sensitivity of an element is strongly are liberated, which are slowed down in a
correlated with its neutron capture cross- heavy water moderator. A fraction of the
section that varies nearly randomly between released neutrons are cooled by 25 K liquid
isotopes. Due to the exceptionally large cross- deuterium and transported to the experiments
10
section of B nucleus (3837 b for thermal by neutron guides [6]. The beam size at the
neutrons), boron can be easily detected by sample position is 20 mm wide and 50 mm
PGAA with a detection limit in the order of 1 high and the present neutron flux is about
mg/l, i.e. 1 ppm [3, 4]. Using cold neutrons 1.4⋅108 n/cm2s. The neutron wavelength
increases the sensitivity of boron because its spectrum measured by time of flight shows a
capture cross section follows the 1/v maximum at about 4 Å on a nearly Maxwellian
dependence, where v is the neutron velocity distribution [7].
[5]. The PGA facility is mainly composed of a
Boron concentration is relatively difficult to detection system, a sample box and shielding
determine using other methods. Indeed, (Fig. 1). The neutron beam interacts with the
although Inductively Coupled Plasma (ICP) sample placed in a target chamber made out of
techniques are very sensitive, they have aluminum. A sample changer, consisting of a
problems of contamination and evaporation Teflon ladder, enables to place six different
because the sample must be processed before samples that can be moved vertically by a step
measurements. On the other hand, PGAA motor. Then, prompt gamma rays are detected
requires no special preparations of samples, by the Compton-suppressed spectrometer
because it is a non-destructive method. These resulting in a high signal-to-noise ratio. The
conditions make boron a very suitable element spectrometer is composed of a coaxial-type
for PGAA. Consequently, the PGA facility at high-purity Ge detector shielded by a 240×240
SINQ has been directed specifically to boron mm2 by 250 mm long NaI(Tl)/BGO
analysis. The aim of the present study was to scintillator. The BGO part is situated in the
determine boron traces in liquid samples. forward direction where the Compton-scattered
radiation have the highest energies. Software
2. Experimental set-up for acquiring the data and positioning the
motor was developed on Labview and enables
The PGA facility has been built at the end the measurement of six samples automatically.
of the 1RNR12 cold neutron guide of the Swiss In the construction, special attention was
spallation source SINQ at the Paul Scherrer given to obtain a very low contribution of
Institute (Villigen, Switzerland). A 590 MeV gamma rays emitted following boron capture
Ph.D. Thesis, S. BaechlerNucl. Instr. and Meth. A 488 (2002) 410. 11
__________________________________________________________________________________
in the shielding. Consequently, B4C was Furthermore, the spectrometer is also protected
essentially excluded for neutron shielding. The by neutron/gamma shields consisted of
internal wall of the sample box is covered by cadmium foils (thickness 1 mm) and lead
an 6LiF polymer (6 mm thick). The entrances bricks (5-15 cm). Finally, the instrument,
to the gamma-ray collimators are covered by placed inside a concrete bunker, has a very low
6
1-cm-thick LiF tiles to avoid the neutrons background of gamma rays for (n,γ)
reaching the Ge detector. 6LiF tiles were used measurement. The PGAA facility at SINQ has
because of their low gamma emission. been described in more detail elsewhere [8].
Fig. 1. Schematic horizontal cut of the prompt gamma activation facility at SINQ.
3. Analytical method However, element sensitivities depend
strongly on the geometry and the composition
To perform analytical measurements, the of the sample [9]. Indeed, self-shielding occurs
method consisted in determining the analytical in samples containing large amounts of neutron
sensitivity (cps/mg) for different elements: for absorber nuclides (typically boron) resulting in
a precise amount of each of the pure elements, lower element sensitivities. Furthermore, an
the areas under the strongest peaks were increase or decrease in elemental sensitivities,
determined [8]. Then multi-elements samples depending on the sample geometry, ensues
were irradiated and the observed peak areas from large concentrations of neutron scattering
were compared with the corresponding nuclides (hydrogen particularly). Finally, the
analytical sensitivities. scattering of cold neutrons within a warm
Ph.D. Thesis, S. Baechler12 I.2 Publications
__________________________________________________________________________________
target (room temperature) results in an increase water sample (scatter nuclides). A sample
in the neutron energy, and thus a significant matrix of distilled water consists of 11.2 %
decrease in element sensitivity [10, 11]. weight units of hydrogen. In the present study,
Because the matrix of a multi-element sample the concentration of hydrogen in known and
is completely different from the one of a pure unknown samples was identical ( C 0, H = C H ).
material, this method is not really reliable on
Thus, relations (1) and (2) were simplified,
its own, but requires particular studies of the
with hydrogen as the inner monitor and boron
target. Besides, the impacts of these processes
as the element of interest
on the measurements are extremely difficult to
AB AH
be evaluated. CB =
k B, H
These analytical biases disappear in
homogenous samples if elemental ratios are with
A0, B A0, H
determined [9, 12, 13]. The ratio of the k B, H = (3)
C 0, B
experimentally measured sensitivity for a
studied element to that of an internal standard
The relative sensitivity k B , H was obtained by
is independent of sample geometry or
plotting the peak area ratio (B/H ratio) versus
composition. This ratio is defined as the
the boron concentration.
relative sensitivity k x , s and is determined with
known samples as follows: 4. Measurements and analysis
A0, x C 0, x
k x, s = (1) A set of standard samples with various
A0, s C 0, s
natural boron concentration in the range of 1-
where A0 is the net peak area and C 0 the 350 ppm were prepared by diluting the
concentration for the element of interest x and standard solution of 1 g/l boric acid (H3BO3)
the internal standard s in a known sample. with distilled water. Then, 1 ml of the prepared
Then, the concentration of the element of solutions were pipetted into polytetra-
interest in an unknown sample is give by fluoroethylene (PTFE) vials of cylindrical
Ax As shape that were 10 mm in outer diameter, 0.5
Cx = (2)
k x, s C s mm in thickness and 30 mm in height. Using
the analytical method described above,
where A is the net peak area and C the
changes in pipetted volume of solution did not
concentration for the element of interest x and
modify the accuracy of the results. Then, the
the internal standard s in an unknown sample.
samples were irradiated from 15 min (350
This approach was particularly suitable for
ppm) to 3 h (distilled water) depending on the
the analysis of boron (absorber nuclides) in
Ph.D. Thesis, S. BaechlerNucl. Instr. and Meth. A 488 (2002) 410. 13
__________________________________________________________________________________
boron concentration. Indeed, when a statistical vials (Fig. 3). Indeed, with hydrogenous
error of 2.4% was obtained in 2 h for the 1.75 samples, neutrons were scattered out of the
ppm sample, a 17.5 ppm solution required target into the surrounding material, thus
approximately 1 min for the same statistics. enhancing considerably the background. The
Finally, 1 ml solutions of three different Doppler broadening of the boron peak
geological samples provided by International increased considerably the probability of
Atomic Energy Agency (IAEA) were interference from other gamma rays [3]. In this
measured during 2 h. study, the boron peak was overlapped with
The prompt gamma-ray spectrum in Fig. 2 prompt gamma rays from 23Na (472 keV). This
shows the Doppler-broadened boron peak (478 contamination came from the NaI(Tl)
keV), as well as the strong hydrogen peak scintillator making up parts of the Compton-
(2223 keV) and the single- and double-escape suppressed detector. The statistical fluctuation
peaks. Several peaks corresponded to neutron of the boron peak concealed the Na peak in
capture reactions of carbon and fluorine, which case of high boron content in the samples (Fig.
were the major components of the Teflon vials. 3). A minor contribution came from the 6LiF
The background level was increased by a tiles used as neutron shielding material. In this
factor of 2 in the boron peak region when case, the 478 keV peak from the 6Li(n,γ)7Li
measuring liquid solutions instead of empty reaction was not broadened. Considering the
5
10
1
H(n,γ)2H
10 7
B(n,α) Li*
12
C(n,γ)13C
4
10
511 keV
SE
Counts / channel
3
10 DE
2
10
1
10
19
F(n,γ)20F
0
10
0 500 1000 1500 2000 2500
Energy [keV]
Fig. 2. Partial prompt gamma-ray energy spectrum measured at the PGA facility. The sample, a standard solution
containing 105 ppm of natB, was measured during 30 min.
Ph.D. Thesis, S. Baechler14 I.2 Publications
__________________________________________________________________________________
4
10
511 keV
10 nat
B (478 keV) B: 17.5 ppm
nat
B: 1.75 ppm
Counts / channel
23
Na (472 keV)
nat
B: 0.175 ppm
3
10
Distilled water
Empty vial
2
10
450 460 470 480 490 500 510 520 530
Energy [keV]
Fig. 3. Part of prompt gamma-ray spectra near the boron peak for various boron concentrations.
small cross section of the reaction (0.038 b for describes the boron Doppler-broadened shape
thermal neutrons), the influence of this peak and finally FBckg (E ) gives the background
was significant only at low boron
contribution. The line shape function for the
concentrations (< 5 ppm).
Doppler-broadened boron peaks is obtained as
A boron peak decomposition method was
the following integral:
developed by Magara and Yonezawa [14]. The π
( E − E0 + k cosθ ) 2
region of interest is decomposed into a broad ∫
FB ( E ) = N exp{−
0
2σ 2
}sin θ dθ (5)
peak, interfering normal peaks and a
background. The Doppler-broadened 478 keV where E 0 is the centroid position of the peak,
peak is represented by an integral of the N and σ represent the peak amplitude and
Gaussian function. The fitting function for the width, respectively. The relation k cosθ gives
explored boron Doppler-broadened peak area the Doppler broadening ∆E . Expression (5)
can be written as a sum of these separated has no analytical solution, nevertheless, after
functions integrating and some adjustments, the function
F ( E ) = FNa ( E ) + FLi ( E ) + FB ( E ) + FBckg ( E ) (4) can be written as follows:
Area ( E − E0 + k ) ( E − E0 − k )
FB ( E ) = {erf − erf } (6)
where FNa (E ) and FLi (E ) are common 4k 2σ 2σ
Gaussian shape functions for sodium (472
where the new parameter Area gives the
keV) and lithium (478 keV) peaks, FB (E )
searched boron peak net area.
Ph.D. Thesis, S. BaechlerNucl. Instr. and Meth. A 488 (2002) 410. 15
__________________________________________________________________________________
The background can be fitted to a linear because it includes the low energy step caused
function of energy with parameters a, b : by low angle Compton scattering of radiation
from the surrounding material back to the
FBckg ( E ) = aE + b . (7)
detector. According to the experience with
Another possibility is to use a more fitting procedure, the E 2 parameter can be set
complicated function according to Magara and
equal to the E 0 of the boron peak. The Origin
Yonezawa [14]:
5.0 was used for proper peak analysis and the
FBckg = A arctan{b( E − E2 )} + C (8)
fitting function F (E ) was implemented to the
where A, b, E 2 and C are free parameters. nonlinear fitting procedure. The resulting fit of
This function is suitable for intense boron the boron peak decomposition procedure is
peaks (i.e. concentration higher than 5 ppm) shown in Fig. 4.
20000
18000 Original data
23
Na (472 keV) Fit
Counts / channel
16000
14000
10
13 B (478 keV)
12000
12
11
10000
10
8000
9
8
6000
7
4000
6
2000
5
4 455 460 465 470 475 480 485 490 495
3
Deviation [σ ]
2
Deviation [σ]
1
0
-1
-2
-3
455 460 465 470 475 480 485 490 495
Energy [keV]
Fig. 4. Resulting fit for the seawater IAEA sample showing the decomposition of the 23Na and 10B peaks.
Ph.D. Thesis, S. Baechler16 I.2 Publications
__________________________________________________________________________________
5. Results and discussions method demonstrated good linearity over a
wide range (Fig. 5). The slope of the
The calibration curve was obtained by calibration plot gave the sensitivity of the
plotting the peak area ratio of the 478 keV technique, while the intercept yielded the
boron and the 2223 keV hydrogen versus the signal from the blank (background). According
known boron concentration of 21 samples (Fig. to the International of Pure and Applied
5). The measured value for 17.5 ppm natural Chemistry (IUPAC) definition, the limit of
boron solution are determined with a statistical detection (LOD) was given by the blank signal
error of 1% and for comparison: 0.175 ppm … plus three standard deviations of the blank
10%; 1.75 ppm … 2.5%; 175 ppm…0.7%. The signal [15]. In the present case, the blank
experimental data points fit the straight line signal was estimated by the intercept and the
given by the relation: y = (0.0369 ± 0.0001)x + standard deviation was determined by the
(0.012 ± 0.001), where y is the concentration in standard error on the intercept. Then, the
ppm units and x is the B/H ratio with related calculated value is substituted into the linear
errors corresponding to one standard deviation relation to obtain the corresponding
(1 SD). Indeed, the linear regression yielded a concentration. Thus, the LOD is given by
correlation coefficient R = 0.9997 and the 3⋅SD/slope = 0.08 ppm. Similarly, the limit of
200
2.5
180
2.0
160
1.5
B counts / H counts
140 1.0
120 0.5
100 0.0
0 1 2 3 4 5
80
60
40
20
0
0 50 100 150 200 250 300 350 400
Boron concentration (ppm)
Fig. 5. Linear fit of the calibration curve obtained by plotting the peak area ratio of boron and hydrogen versus
the boron concentration.
Ph.D. Thesis, S. BaechlerNucl. Instr. and Meth. A 488 (2002) 410. 17
__________________________________________________________________________________
quantification (LOQ), that is the lowest from the calibration curve determination. The
concentration which can be quantified with an results of the IAEA samples were in good
acceptable statistical significance, was agreement with the values obtained by ICP
determined by 10⋅SD/slope = 0.26 ppm. methods (Table 1) [16]. Although boron was
Finally, the calibration curve was used to most certainly detected in the sample
estimate boron concentrations of unknown “Groundwater 1”, insufficient statistics
samples. In that case, there were two sources restricted the concentration to a relative error
of uncertainties for measured data evaluation: of 30%. Moreover, the boron concentration of
the statistical errors from the spectrum this sample was below the limit of
evaluation based on 1SD and the uncertainty quantification.
Table 1. Analytical results of natural boron (in ppm) for three geological samples
Sample Description This work ICP-MS a ICP-OES a
Sea water 4.8 ± 0.2 4.9 ± 0.2 5.3 ± 0.3
Groundwater 1 0.20 ± 0.06 0.193 ± 0.006 0.22 ± 0.02
Groundwater 2 1.83 ± 0.07 1.75 ± 0.05 1.77 ± 0.09
a
Ref. 16
10
6. Conclusions and outlook neutron beams. The determination of B was
previously performed at a cold neutron beam
In the present investigation, PGAA was guide by Yonezawa et al. [17], as a part of the
used to determine natural boron concentration boron neutron capture therapy (BNCT) at the
in aqueous samples. The analytical procedure Japan Atomic Energy Research Institute
proved to yield reliable quantitative results for (JAERI). In that case, the detection limit of 10B
concentrations in the range from 0.26 to 350 in a blood sample was 0.14 ppm. Although
ppm of natural boron. The advantage of the blood and water matrices are slightly different
method was the independence of n-H for boron detection using PGAA, the results
scattering, the self-shielding of boron and demonstrate that our system is competitive.
geometry variance. As opposed to the boron Furthermore, the technique was applied to
amount needed for quantitative analyses, boron determine boron concentration in geological
trace was detectable down to 0.08 ppm (or samples. The results showed a good correlation
10
0.016 ppm of B). To our knowledge, the with the concentration obtained by ICP
performance of the PGA facility at SINQ was techniques.
better than other facilities located on thermal
Ph.D. Thesis, S. Baechler18 I.2 Publications
__________________________________________________________________________________
Other groups showed that PGAA was a containing the cells includes several steps.
10
very useful technique in medicine. As B in First, the cells are immersed in a nutritional
human tissue can be determined non- medium doped with KBH and placed in an
destructively and rapidly, many applications of incubator. Then, for different incubation
10
B have been carried out in BNCT treatment periods, they are extracted from this boronated
of brain tumors [3, 17-19]. The PGA facility at solution and mixed to the original KBH free
SINQ is used for a different medical medium. Finally, these solutions with cells are
application. Indeed, the technique permits to analyzed and it is possible to determine the
measure the concentration of boron taken up KBH concentration incorporated by cells as a
by cells in a new treatment for rheumatoid function of the incubation time. This study has
arthritis. Rheumatoid arthritis is an already started and the PGA technique to
autoimmune disease characterized by swollen detect boron yields promising results [21].
and painful inflammation of the membrane
(synovium) lining articular joints [20]. A Acknowledgements
recent technique is proposed to treat
synoviocytes with the 10B(n,α)7Li reaction, the The present study was supported by the
so-called boron neutron capture synovectomy Swiss National Science Foundation, the Paul
(BNCS). The aim in measuring at the PGA Scherrer Institute (PSI) and the University of
station is to study the kinetics of uptake by a Cologne. The authors would like to express
boron compound named KBH (K2B12H12 94% their gratitude to Prof. U. Krähenbühl and J.
10
enriched with B) in different cells lines. Grimm (University of Bern) for providing the
Beforehand, it is necessary to establish a IAEA samples and to Dr. N.E.A. Crompton
calibration curve using solutions of known (PSI) for his collaboration with the medical
amount of KBH in a nutritional medium. The application.
preparation of the unknown solutions
___________________________________________________
[1] Z.B. Alfassi, C. Chung (Ed.), Prompt [4] M. Crittin, J. Jolie, J. Kern, S. J. Mannanal,
Gamma Neutron Activation Analysis, CRC R. Schwarzbach, Boron detection by prompt
Press, Boca Raton, FL, 1995. gamma-ray activation analysis (PGAA), in:
[2] R.B. Firestone, V.S. Shirley (Ed.), Table of B. Larsson, et al., (Eds.), Advances in
Isotopes, 8th Edition, Wiley, New York, Neutron Capture Therapy, Elsevier,
1996. Amsterdam, 1996, p. 343.
[3] T. Kobayashi, K. Kanda, Nucl. Instr. and [5] J. Byrne, Neutrons, Nuclei and Matter, An
Meth 204 (1983) 525. Exploration of the Physics of Slow
Ph.D. Thesis, S. BaechlerNucl. Instr. and Meth. A 488 (2002) 410. 19
__________________________________________________________________________________
Neutrons, Institute of Physics Publishing, [16] J. Grimm, Studien zur Bestimmung von Bor
Philadelphia, 1994. und Analyse der Isotopenverhältnisse in
[6] G.S. Bauer, Nucl. Instr. and Meth. B 139 geochemischen Proben, Diplomarbeit
(1998) 65. Universität Bern, 2000.
[7] W. Wagner, G.S. Bauer, J. Duppich, S. [17] C. Yonezawa, H. Matsue, H. Sawahata, T.
Janssen, E. Lehmann, M. Lüthi, H. Spitzer, Kurosawa, M. Hoshi, Y. Ito, in: Y. Mishima
J. Neutron Res. 6 (1998) 249. (Ed.), Cancer Neutron Capture Therapy,
[8] M. Crittin, J. Kern, J.-L. Schenker, Nucl. Plenum Press, New York, 1996, p. 221.
Instr. and Meth. A 449 (2000) 221. [18] C.P.J. Raaijmakers, M. W. Konijnenberg, ,
[9] R.L. Paul, J. Radioanal. Chem. 191 (1995) L. Dewit, D. Haritz, R. Huiskamp, K.
245. Philipp, A. Siefert, F. Stecher-Rasmussen,
[10] R.L. Paul, E. A. Mackey, J. Radioanal. B.J. Mijnheer, Acta Oncologica, 34 (1995)
Chem. 181 (1994) 321. 517.
[11] E.A. Mackey, G. E. Gordon, R. M. [19] R. Rogus, O.K. Harling, I. Olmez, S.
Lindstrom, D. L. Anderson, Anal. Chem., 64 Wirdzek, Boron-10 prompt gamma analysis
(1992) 2366. using a diffracted neutron beam, in Progress
[12] R.M. Lindstrom, R.F. Fleming, R.L. Paul, in B.J. Allen et al., (Eds.), Progress in
E.A. Mackey, Proceedings of the Neutron Capture Therapy for Cancer,
international k0 Users Workshop, Plenum Press, New York, 1992.
Rijksuniversiteit Gent, 1992, p. 125. [20] J.C. Yanch, S. Shortkroff, R. E. Shefer, S.
[13] G.L. Molnár, Zs. Révay, R.L. Paul, R.M. Johnson, E. Binello, D. Gierga, A. G. Jones,
Lindstrom, J. Radioanal. Chem. 234 (1998) G. Young, C. Vivieros, A. Davison, C.
21. Sledge, Med. Phys., 26 (1999) 364.
[14] M. Magara, C. Yonezawa, Nucl. Instr. and [21] N. Stritt, Boron uptake in cells, a study
Meth. A 411 (1998) 130. about the kinetics of boron uptake in cells,
[15] J.C. Miller, J.N. Miller, Statistics for neutron-induced cell death (apoptosis) and
nd
Analytical Chemistry, 2 Edition, Ellis neutron-induced cell cycle arrest, Diploma-
Horwood Limited, Chichester, UK, 1988, p. Thesis, NDS Medizin Physik ETHZ, 2001.
115.
Ph.D. Thesis, S. BaechlerSubmitted for publication in J. Radioanal. Nucl. Chem. 21
__________________________________________________________________________________
The k0-method in cold-neutron prompt gamma-ray
activation analysis
S. Baechlera,b*, P. Kudejovac, J. Joliec, J.-L. Schenkera,
a
Physics Department, University of Fribourg, CH-1700 Fribourg, Switzerland
b
Paul Scherrer Institute, CH-5232 Villigen, Switzerland
c
Institut für Kernphysik, Universität zu Köln, D-50937 Köln, Germany
The k0-standardization method has been applied and evaluated at the cold-neutron prompt gamma-ray activation
(PGA) facility of the Swiss spallation source SINQ (Paul Scherrer Institute). The k0-factors for 26 elements of
interest were measured using chlorine as a comparator. The results showed good agreement with the values
determined at other cold and thermal neutron guided beams, except for a few elements.
Then, standard reference materials were analyzed to assess the accuracy of the method using the obtained k0-
factors. Finally, the technique was used for multielement determination in various samples coming from nuclear
waste storage, geochemistry and geology. In addition, the non-destructive nature of PGAA offered an
interesting application in archeology.
___________________________________________________________________________
1. Introduction rate of a known amount of the standard, is
strongly correlated with its neutron capture
Prompt gamma-ray activation analysis cross-section that varies nearly randomly
(PGAA) is a non-destructive nuclear technique between elements (or isotopes). Due to their
for measuring concentrations of various large cross section, PGAA is highly sensitive
elements in a sample [1]. The method consists to toxic elements as Cd and Hg and some rare
in observing capture gamma rays emitted earths, especially Sm and Gd. This technique is
promptly by a target material during neutron particularly suitable for non-destructive
irradiation. PGAA is an important tool for multielement analysis of both major and trace
analyzing light elements such as H, B, N, Si, P, components. For example, PGAA proved to be
S and Cl, which are usually difficult to the most adapted technique for quantitative
measure by conventional neutron activation determination of H, B, Si, S, P, Cl, Ca, Ti, Cr,
analysis (NAA). The analytical sensitivity of Mn, Fe and Ni in minerals [2]. The potential
an element, defined as the gamma-ray count of PGA is optimized when using low energy
Ph.D. Thesis, S. Baechler22 I.2 Publications
__________________________________________________________________________________
neutrons, which can be guided far from the aqueous solutions [6]. The relative
neutron source. First, the lack of fast-neutron sensitivities, namely k-factors, can be
and gamma-ray radiation reduces drastically evaluated as universal constants by eliminating
the background level. Furthermore, the capture the detector efficiency dependence. This
reaction rate of low-energies neutrons is extension introduces the so-called prompt k0-
improved due to the 1/v capture cross section factors [7, 8] that can be applied in any PGA
behavior. Both the lower background and the system for multielement analysis by analogy
enhanced cross section give rise to a with the k0-standardization in NAA [9, 10].
substantial improvement of analytical The k0-method yields only relative
sensitivities and detection limits [3]. concentrations of elements. Absolute concen-
A PGA facility has been built at the end of the trations require the determination of at least
1RNR12 cold neutron guide of the Swiss one element in the sample using the
spallation source SINQ at the Paul Scherrer comparative method for PGA based on
Institute [4]. The quantitative analysis was standard reference materials of similar matrix
carried out using a comparative method. and geometry or using another analytical
Element concentrations were determined by technique. The k0-factors for 26 elements have
comparing the gamma-ray count rate of an been measured with the cold neutron guided
element in a sample to the corresponding beam at SINQ. The results were compared to
element sensitivity. In a previous work, the k0-factors determined with both cold and
analytical sensitivities were determined for 11 thermal guided neutrons at other facilities.
elements, including H, B, N, Na, Si, S, Cl, K,
Ca, Ti, and Fe [4]. 2. Apparatus
However, the differences in composition and
geometry between samples and standards The PGA facility has been built at the end of
affect the accuracy of analytical results. the 1RNR12 cold neutron guide of the Swiss
Indeed, neutron self-shielding and scattering spallation source SINQ at the Paul Scherrer
effects in the target influence strongly element Institute. At SINQ, a 590 MeV protons beam
sensitivities. These analytical biases in the impinging onto a lead target produces neutrons
comparative standardization are largely through the spallation process. Recently, the
eliminated using an internal standardization; proton current has been upgraded to 1.3 mA.
i.e. the sensitivity for a studied element is Then a fraction of the released neutrons are
determined relatively to that of an internal slowed down into a cold moderator of liquid
comparator [5]. This approach has been deuterium at 25 K. Finally, cold neutrons are
applied successfully at the SINQ PGA facility transported to the PGA instrument by a curved
for quantitative determination of boron in neutron guide. The mean energy of the neutron
Ph.D. Thesis, S. BaechlerSubmitted for publication in J. Radioanal. Nucl. Chem. 23
__________________________________________________________________________________
distribution was about 3 meV. The beam size of neutron capture gamma rays, which
at the end of the guide is 20 mm wide and 50 combines the Evaluated Nuclear Structure
mm high and the neutron flux at the sample Data File (ENSDF) [13] and the new gamma-
position is about 1.8⋅108 n/cm2s. ray spectrum catalog for PGAA proposed by
Prompt gamma rays were detected by a Révay et al. [14]. Finally, relative
Compton-suppressed spectrometer composed concentrations are calculated for elements for
of a coaxial type high-purity germanium which the corresponding k0-factor was
(HPGe) main detector shielded by a 240×240 measured and inserted into the library.
mm2 by 250 mm long NaI(Tl)/BGO
scintillator. Indeed, the prompt gamma ray 3. Experimental procedure
spectra were greatly simplified when reducing
the background continuum due to Compton The k0-factors in PGA are determined using
scattering. Since guided cold neutron beams the following equation given by Molnár et al.
provide low gamma and fast-neutron [8]:
background, the germanium detector was in ( N γ , x ε γ , x ) mc
k 0,c ( x ) = ⋅ , (1)
close geometry to the target located into an ( N γ ,c ε γ ,c ) m x
aluminum chamber. A sample changer, where N γ is the net peak area under the gamma
consisting in a Teflon ladder, enabled to place line, ε γ the absolute full-energy peak detection
six different samples. In the construction of the
efficiency and m the mass for the element of
system, special attention was given to achieve
interest x with respect to the comparator
the lowest gamma-ray background.
element c . The precise determination of k0-
Consequently, 6LiF polymer and tiles were
factors mandates thus (1) an accurate
mainly used for neutron shielding because of
calibration of the detector efficiency, (2) the
their low gamma emission. The PGA facility
selection of a suitable comparator element and
has been described in more detail elsewhere
(3) standard samples with accurate elemental
[4].
ratios.
New analysis software, namely PEGASE for
Program Evaluating Gamma-ray Spectra for
3.1 Gamma-ray detection efficiency curve
the determination of Elemental compositions,
has been recently developed under the
PGAA required a gamma-ray detection
LabVIEW environment [11]. This program
efficiency curve covering a wide energy range,
includes an automated peak fitting procedure
i.e. from 100 keV to 11 MeV. First, the
based on the computer code GASPAN [12].
efficiency of the detector was measured
Then, the routine for elemental identification
between 81 keV and 1408 keV using calibrated
compares the resulting information to a library
Ph.D. Thesis, S. Baechler24 I.2 Publications
__________________________________________________________________________________
152 133 137 60
sources of Eu, Ba, Cs and Co an efficiency calibration up to 10829 keV with
recommended in the IAEA-CRP report [15]. high precision intensity values [15, 16]. The
The certified strengths of these radioactive target consisted of a 300-mg pill of urea
sources were used for the calculation of the CH4N2O was exposed 24 hours to the neutron
absolute efficiency curve. Then, the efficiency beam. In addition, selected gamma rays of the
12 35
calibration was extended to 3548 keV C(n,γ) and Cl(n, γ) reactions proposed in
56
measuring a Co source produced initially by Ref. [16] were used to fill in gaps in the
56
the Fe(p,n) reaction. Data points were calibration curve. For this purpose, two
deduced from emission probabilities proposed samples of 30 mg of chloranil C6ClO2 and 1.5
in Ref. [15]. Radioactive sources cannot be g of graphite were measured successively for 5
56
used above the highest energy of the Co hours. Finally, 66 data points with an average
source at 3548 keV. Thus, prompt neutron- uncertainty of 1.5 %, from 0.2 % to 3.4 %,
capture gamma rays are used to prolong the were considered for the construction of the
14
efficiency curve. The N(n,γ) reaction allowed efficiency curve, obtained by least-squares
1e−03
1e−04
Absolute efficiency
1e−05
1e−06
100 1000 10000
Energy [keV]
Fig.1. Absolute efficiency curve of the Compton-suppressed spectrometer at the PGA facility
Ph.D. Thesis, S. BaechlerSubmitted for publication in J. Radioanal. Nucl. Chem. 25
__________________________________________________________________________________
fitting to the following function suggested in samples in the range of 10 to 1000 mg were
GASPAN: prepared and sealed into FEP (Teflon) bags.
8
For highly sensitive elements, i.e. B, Cd, Sm
∑ ai ⋅log( E )( i−3)
ε (E) = 0.5 ⋅ erfc[−a12⋅( E − a2 ) ] ⋅10 i=3 (2) and Gd, certified standard solutions were
where ai are fitting parameters. The plot of the mixed with ammonium chloride in an
efficiency curve is shown in Fig. 1. The appropriate ratio. Then, 1ml of the prepared
deviation between the measured and fitted solutions was pipetted into Teflon vials of
values is in the order of 1.5% below 2 MeV, cylindrical shape. Finally, samples were
2.5% between 2 MeV and 5 MeV and around irradiated for 0.5 to 12 hours in order to obtain
4% above 5 MeV. sufficient statistics for the determination of
photopeak areas under gamma-lines of interest.
3.2 Standard samples Beforehand a vacuum of a few mbar was
created in the sample box in order to suppress
Chloride was adopted as the internal the peaks from neutron capture in nitrogen.
comparator since the chloride compounds are
available for a wide range of elements and 4. Results and discussion
offer a well-known stable stoichiometry as
well as a good sample homogeneity [8]. 4.1 k0-factors
35
Moreover, the Cl(n,γ) reaction was used for
detector efficiency calibration. Thus, chloride The k0-values of 26 elements related to the
compounds were applied to measure k0-factors 1951 keV peak of chlorine are reported in
of H (ammonium chloride), Na, Al, K, Ca, Cr, Table 1 for the gamma-lines mostly
Mn, Fe, Co, Ni, Cu, Zn, Hg. However, for appropriate to quantitative analysis. The errors
elements for which analytical sensitivities corresponded to the propagated uncertainties
largely deviate from those of Cl, chloride combining counting statistics and efficiency
compounds were replaced by appropriate function. Moreover, the standard deviation
mixtures of high-purity elemental compounds based on the different samples was consistent
with ammonium chloride [17]. Then, mixed with the calculated propagated error. The
standard powder samples were prepared for errors obtained were then less 4%, except for C
elements with low sensitivity such as Si, P, S, and N due to the low sensitivity, as well as for
Ti, Sn and Pb. In addition, k0-factors of C and Fe, Ni, Cu and Pb, when considering lines
N, which are elements with extremely low above 7 MeV due to uncertainties of the
sensitivity, were determined using H as efficiency curve. In this work, no effort was
comparator in standard samples of melamine made to improve the accuracy of the energy
(C3H6N6). For each of those elements, 4 to 6 values.
Ph.D. Thesis, S. BaechlerVous pouvez aussi lire