Une exploration des messages Twitter émis par les gouvernements en temps de COVID-19 - Mémoire Amine Kada Maîtrise en sciences de l'administration ...
←
→
Transcription du contenu de la page
Si votre navigateur ne rend pas la page correctement, lisez s'il vous plaît le contenu de la page ci-dessous

Une exploration des messages Twitter émis par les
     gouvernements en temps de COVID-19

                            Mémoire

                          Amine Kada

     Maîtrise en sciences de l'administration - avec mémoire
                    Maître ès sciences (M. Sc.)

                        Québec, Canada

                      © Amine Kada, 2021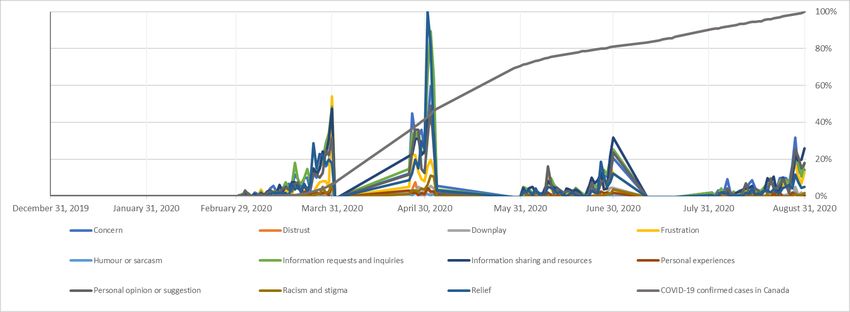
Une exploration des messages Twitter émis par les
     gouvernements en temps de COVID-19

                       Mémoire

                    Amine KADA

                 Sous la direction de :

               Professeur Sehl MELLOULI
Résumé
Les gouvernements se tournent de plus en plus vers les plateformes de médias sociaux telles que Twitter pour
diffuser des informations liées à la santé publique au grand public, comme en témoigne la pandémie de la
COVID-19. Le but de cet article est de mieux comprendre l’utilisation de Twitter par le gouvernement et les
responsables de la santé publique Canadiens comme plate-forme de diffusion de messages pendant la
pandémie, et d’explorer l’engagement et le sentiment du public à l’égard de ces messages diffusés. Nous avons
examiné les données de 93 comptes Twitter de responsables de la santé publique et du gouvernement au
Canada pendant la première vague de la pandémie (du 31 décembre 2019 au 31 août 2020). Nos objectifs
étaient les suivants: 1) déterminer les taux d'engagement du public auprès des publications Twitter des
gouvernements fédéral et provinciaux/territoriaux du Canada et des responsables de la santé publique, 2)
illustrer l'évolution du discours public Canadien pendant la première vague de la pandémie par des tendances
d’hashtag et 3) fournir un aperçu de la réaction du public aux tweets des autorités Canadiennes grâce à une
analyse des sentiments. Pour atteindre ces objectifs, nous avons extrait des publications Twitter, ainsi que les
réponses et les métadonnées qui leurs sont associées, en langue anglaise et française, pendant toute la période
de l’étude. Nos résultats suggèrent que les membres du public ont démontré un engagement accru envers les
comptes Twitter des officiels fédéraux par rapport aux comptes Twitter des officiels provinciaux et territoriaux.
Les analyses des tendances des hashtag ont illustré le changement de sujet dans le discours public Canadien,
qui était initialement axé sur les stratégies d'atténuation de la COVID-19 et qui a évolué pour aborder des
problèmes émergents tels que les effets de la COVID-19 sur la santé mentale. De plus, nous avons identifié 11
sentiments en réponse aux publications des officiels relatifs à la COVID-19. Cette étude illustre le potentiel de
tirer parti des médias sociaux pour comprendre le discours public pendant une pandémie. Nous suggérons que
des analyses routinières de telles données peuvent fournir des recommandations en temps réel aux
gouvernements et aux responsables de la santé publique sur les sentiments du public lors d'une urgence de
santé publique et peuvent aussi fournir des informations utiles sur les comptes/acteurs avec lesquels les
membres du public sont le plus engagés, ce qui peut être mis à profit pour diffuser des messages clés.

                                                       ii
Abstract
Governments are increasingly turning to social media platforms such as Twitter to disseminate public health
information to the public, as evidenced during the COVID-19 pandemic. The purpose of this paper is to gain a
better understanding of Canadian government and public health officials’ use of Twitter as a dissemination
platform during the pandemic, and to explore the public’s engagement with and sentiment towards these
messages. We examined the account data of 93 Canadian public health and government officials during the first
wave of the pandemic (December 31, 2019 – August 31, 2020). Our objectives were to: 1) determine the
engagement rates of the public with Canadian federal and provincial/territorial governments and public health
officials’ Twitter posts, 2) illustrate the evolution of the Canadian public discourse during the pandemic’s first
wave by a hashtag trends and 3) provide insights on the public’s reaction to the Canadian authorities’ tweets
through sentiment analysis. To address these objectives, we extracted Twitter posts, replies and associated
metadata available during the study period in both English and French. Our results suggest members of the
public demonstrated increased engagement with federal officials’ Twitter accounts as compared to
provincial/territorial Twitter accounts. Hashtag trends analyses illustrated the topic shift in the Canadian public
discourse, which initially focused on COVID-19 mitigation strategies and evolved to address emerging issues
such as COVID-19 mental health effects. Additionally, we identified 11 sentiments in response to officials’
COVID-19 related posts. This study illustrates the potential to leverage social media to understand public
discourse during a pandemic. We suggest that routine analyses of such data can provide real-time
recommendations to government and public health officials on public sentiments during a public health
emergency and can provide useful insights on the accounts/actors with which members of the public are most
engaged, which can be leveraged to disseminate key messages.
iiiTable des matières
Résumé........................................................................................................................................................ ii
Abstract ........................................................................................................................................................ iii
Table des matières ...................................................................................................................................... iv
Liste des figures .......................................................................................................................................... vi
Liste des tableaux ........................................................................................................................................ vii
Liste des sigles ........................................................................................................................................... viii
Liste des acronymes .................................................................................................................................... ix
Remerciements ........................................................................................................................................... xi
Avant-propos ............................................................................................................................................... xii
Introduction................................................................................................................................................... 1
Chapitre 1 : An exploration of Canadian government officials’ COVID-19 messages and the public’s reaction
using social media data................................................................................................................................. 2
1.1 Résumé .............................................................................................................................................. 2
1.2 Abstract .............................................................................................................................................. 2
1.3 Introduction......................................................................................................................................... 3
1.4 Methods ............................................................................................................................................. 4
1.4.1 Twitter as the target data platform ................................................................................................ 4
1.4.2 Government and public health officials’ social media accounts ...................................................... 4
1.4.3 Data access and format ............................................................................................................... 5
1.4.4 Data collection, filtering, and preprocessing .................................................................................. 5
1.4.5 Data analysis ............................................................................................................................... 7
1.5 Results ............................................................................................................................................. 12
1.5.1 Engagement metrics .................................................................................................................. 12
1.5.2 Hashtag trends .......................................................................................................................... 13
1.5.3 Sentiment analysis ..................................................................................................................... 15
1.6 Discussion ........................................................................................................................................ 16
1.7 Conclusion........................................................................................................................................ 19
1.8 References ....................................................................................................................................... 19
1.9 Supporting information ...................................................................................................................... 25
1.9.1 Appendix A : List of all Twitter handles included to obtain data to inform the study ....................... 25
1.9.2 Appendix B : Description of some metadata of a tweet ................................................................ 32
1.9.3 Appendix C : List of hashtags related to COVID-19 ..................................................................... 32
iv1.9.4 Appendix D : The initial categories of sentiments, their definition, and examples of tweets for each
category ............................................................................................................................................. 33
1.9.5 Appendix E : Engagement metrics results towards the COVID-related Canadian public discourse 34
1.9.6 Appendix F : Sentiment analysis results that depict the evolution of the public’s sentiments towards
the COVID-related Canadian public discourse over time ...................................................................... 35
Conclusion ................................................................................................................................................. 37
Bibliographie............................................................................................................................................... 38
vListe des figures
Figure 1: Data filtering and preprocessing workflow.
Figure 2: The overall sentiment analysis process.
Figure 3: The ratio of interest towards the COVID-related tweets by Canadian officials x number of COVID-19
confirmed cases in Canada from December 31, 2019 to August 31, 2020.
Figure 4: The hashtag trends related to the federal government of Canada from December 31, 2019 to August
31, 2020.
Figure 5: The hashtag trends related to the government officials of all Canadian provinces and territories from
December 31, 2019 to August 31, 2020.
Figure 6: The hashtag trends related to the federal health officials of Canada from December 31, 2019 to
August 31, 2020.
Figure 7: The hashtag trends related to the health officials of all Canadian provinces and territories from
December 31, 2019 to August 31, 2020.
Figure 8: Tweets, retweets, and likes of COVID-related tweets by Canadian Federal government officials x
number of COVID-19 confirmed cases in Canada from December 31, 2019 to August 31, 2020.
Figure 9: Tweets, retweets, and likes of COVID-related tweets of Canadian provincial/territorial government
officials x number of COVID-19 confirmed cases in Canada December 31, 2019 to August 31, 2020.
Figure 10: Tweets, retweets, and likes of COVID-related tweets of Canadian Federal public health officials x
number of COVID-19 confirmed cases in Canada December 31, 2019 to August 31, 2020.
Figure 11: Tweets, retweets, and likes of COVID-related tweets of Canadian provincial/territorial public health
officials x number of COVID-19 confirmed cases in Canada December 31, 2019 to August 31, 2020.
Figure 12: The relative proportion of the sentiments related to the federal government officials of Canada from
December 31, 2019 to August 31, 2020. Figure was scaled to the highest peak on July 19, 2020 where 937
(27.19%) of all sentiments were recorded. The peak was assigned a score of 100%.
Figure 13: The relative proportion of the sentiments related to the government officials of all the Canadian
provinces and territories from December 31, 2019 to August 31, 2020. The Figure was scaled to the highest
peak on May 03, 2020 where 435 (20.70%) of all sentiments were recorded. The peak was assigned a score
of 100%.
Figure 14: The relative proportion of the sentiments related to the federal health officials of Canada from
December 31, 2019 to August 31, 2020. The Figure was scaled to the highest peak on July 16, 2020, where
95 (31.77%) of all sentiments were recorded. The peak was assigned a score of 100%.
Figure 15: The relative proportion of the sentiments related to the health officials of all the Canadian provinces
and territories from December 31, 2019 to August 31, 2020. The Figure was scaled to the highest peak on
May 01, 2020, where 199 (31.53%) of all sentiments were recorded. The peak was assigned a score of 100%.
viListe des tableaux
Table 1: The final categories of sentiments, their definition, and examples of tweets for each category.
Table 2: Descriptive data showing the number of tweets, retweets, likes and the ratio of interest related to
COVID-related Tweets by Canadian government and public health officials from December 31, 2019 to August
31, 2020.
Table 3: COVID-19 hashtag trends per month used by the Canadian government and health officials’ accounts
from December 31, 2019 to August 31, 2020, demonstrating the topic shift.
Table 4: The proportions of expressed sentiments per month towards the government and health officials’
accounts from December 31, 2019 to August 31, 2020.
Table 5: List of all Twitter handles related to the official government Twitter accounts and government leaders
Twitter accounts included to obtain data to inform the study.
Table 6: List of all Twitter handles related to the health bodies Twitter accounts and healt body leaders Twitter
accounts included to obtain data to inform the study.
Table 7: Description of some metadata of a Twitter post.
Table 8 : The initial categories of sentiments, their definition, and examples of tweets for each category.
viiListe des sigles
SARS-CoV-2 : Severe acute respiratory syndrome coronavirus 2
MERS : Middle East Respiratory Syndrome
SRAS : Syndrome Respiratoire Aigu Sévère
SARS : Severe Acute Respiratory Syndrome
CSSE : Center for Systems Science and Engineering
NLP : Natural Language Processing
ML : Machine Learning
viiiListe des acronymes
COVID-19 : Corona Virus Disease 2019
OMS : Organisation Mondiale de la Santé
WHO : World Health Organization
ixA ma famille x
Remerciements
Je désire remercier mon directeur de recherche, Professeur Sehl MELLOULI, pour son encadrement et son
soutien infaillibles tout au long de mon cheminement. Je désire aussi remercier tous mes Professeurs que j’ai
côtoyé au sein de l’Université Laval, qui m’ont inspiré tout au long de mon parcours, et envers qui j’ai une
profonde gratitude. Je désire également remercier les membres du Knowledge Translation Program, Li Ka Shing
Knowledge Institute, Unity Health Toronto, et plus spécialement Dr. Christine FAHIM et Anupa J. PRASHAD
pour leur soutien constant et leur étroite collaboration lors de la réalisation du présent travail. Je voudrai
remercier mes amis, en qui j’ai trouvé un véritable support system, lors de ces temps difficiles empreints par les
retombées de la pandémie que nous vivons. Enfin, je ne remercierai jamais assez ma famille, qui a toujours été
là pour moi, pour me supporter dans toutes mes entreprises et pour leur amour inconditionnel.

                                                        xi
Avant-propos
L’article scientifique qui fait l’objet du chapitre 1 du présent mémoire, et dont je suis l’auteur principal, n’a toujours
pas été soumis à aucune publication scientifique au moment où j’écris ces lignes. Outre Professeur Sehl
MELLOULI en sa qualité de directeur de recherche, sont aussi co-auteurs de l’article les personnes suivantes :
• Arbi CHOUIKH en sa qualité de professionnel de recherche à l’Université Laval,
• Anupa J. PRASHAD en sa qualité de coordinatrice de recherche au sein du Knowledge Translation
Program, Li Ka Shing Knowledge Institute, Unity Health Toronto,
• Dr. Sharon E. STRAUS en sa qualité de directrice du Knowledge Translation Program, Li Ka Shing
Knowledge Institute, Unity Health Toronto,
• Dr. Christine FAHIM en sa qualité de scientifique au sein du Knowledge Translation Program, Li Ka
Shing Knowledge Institute, Unity Health Toronto.
xiiIntroduction
Le nouveau coronavirus (COVID-19, SARS-CoV-2) a été documenté pour la première fois en décembre 2019
dans la ville de Wuhan, province du Hubei, Chine [1]. Le virus s'est propagé rapidement dans le monde et le 11
mars 2020, l'Organisation Mondiale de la Santé (OMS) a déclaré l'épidémie de la COVID-19 comme étant une
pandémie [2]. A date du 27 avril 2021, un total de 148 335 023 de cas de COVID-19 ainsi que 3 131 636 de
décès liés à la COVID-19 ont été confirmés dans 192 pays et régions [3], dépassant ainsi les cas relatifs au
Syndrome Respiratoire du Moyen-Orient (MERS), au Syndrome Respiratoire Aigu Sévère (SRAS) et les
précédentes épidémies liées au virus H1N1 [4-6].
Au fur et à mesure que les cas augmentaient et que la propagation communautaire empirait, les gouvernements
ainsi que les responsables de la santé publique du monde entier ont adopté des mesures pour réduire la
transmission, y compris le lavage des mains [7], la distanciation sociale et l'auto-isolement [8, 9]. De nombreux
responsables se sont tournés vers les médias sociaux, en plus des médias traditionnels (la télévision, la radio,
etc.), en tant que plates-formes à travers lesquelles des informations pourraient être diffusées [10, 11].
Le but de notre étude est de fournir un aperçu de la manière dont les gouvernements fédéral et
provinciaux/territoriaux du Canada ainsi que les responsables de la santé publique ont utilisé Twitter comme
plateforme pour diffuser des messages relatifs à la COVID-19 et de déterminer l'engagement et la réaction du
public à ces messages. Nous avons choisi Twitter comme plate-forme de médias sociaux pour conduire notre
étude, car il s'agit de l'une des plus grandes plates-formes de médias sociaux au monde et permet aux
utilisateurs de diffuser des informations en temps réel à un large public [12].
À l'aide de l'exploration des données, d'analyses quantitatives et qualitatives et de techniques d'apprentissage
automatique, nous visons à fournir aux responsables des gouvernements et de la santé publique, grâce à nos
recherches, des informations clés sur la manière d'optimiser les messages lors d'urgences de santé publique.
Nos objectifs étaient de 1) déterminer les taux d'engagement du public avec les publications Twitter des
gouvernements fédéral et provinciaux/territoriaux ainsi que des responsables de la santé publique Canadiens,
2) les tendances de hashtag et les changements de sujets dans le discours public Canadien relatif à la COVID-
19 sur Twitter, et 3 ) une analyse de sentiments approfondie des réponses des utilisateurs de Twitter aux
publications Twitter liées à la COVID-19 des gouvernements et des responsables de la santé publique.
1Chapitre 1 : An exploration of Canadian
government officials’ COVID-19 messages and the
public’s reaction using social media data
1.1 Résumé
Les gouvernements se tournent de plus en plus vers les plateformes de médias sociaux telles que Twitter pour
diffuser des informations liées à la santé publique au grand public, comme en témoigne la pandémie de la
COVID-19. Le but de cet article est de mieux comprendre l’utilisation de Twitter par le gouvernement et les
responsables de la santé publique Canadiens comme plate-forme de diffusion de messages pendant la
pandémie, et d’explorer l’engagement et le sentiment du public à l’égard de ces messages diffusés. Nous avons
examiné les données de 93 comptes Twitter de responsables de la santé publique et du gouvernement au
Canada pendant la première vague de la pandémie (du 31 décembre 2019 au 31 août 2020). Nos objectifs
étaient les suivants: 1) déterminer les taux d'engagement du public auprès des publications Twitter des
gouvernements fédéral et provinciaux/territoriaux du Canada et des responsables de la santé publique, 2)
illustrer l'évolution du discours public Canadien pendant la première vague de la pandémie par des tendances
d’hashtag et 3) fournir un aperçu de la réaction du public aux tweets des autorités Canadiennes grâce à une
analyse des sentiments. Pour atteindre ces objectifs, nous avons extrait des publications Twitter, ainsi que les
réponses et les métadonnées qui leurs sont associées, en langue anglaise et française, pendant toute la période
de l’étude. Nos résultats suggèrent que les membres du public ont démontré un engagement accru envers les
comptes Twitter des officiels fédéraux par rapport aux comptes Twitter des officiels provinciaux et territoriaux.
Les analyses des tendances des hashtag ont illustré le changement de sujet dans le discours public Canadien,
qui était initialement axé sur les stratégies d'atténuation de la COVID-19 et qui a évolué pour aborder des
problèmes émergents tels que les effets de la COVID-19 sur la santé mentale. De plus, nous avons identifié 11
sentiments en réponse aux publications des officiels relatifs à la COVID-19. Cette étude illustre le potentiel de
tirer parti des médias sociaux pour comprendre le discours public pendant une pandémie. Nous suggérons que
des analyses routinières de telles données peuvent fournir des recommandations en temps réel aux
gouvernements et aux responsables de la santé publique sur les sentiments du public lors d'une urgence de
santé publique et peuvent aussi fournir des informations utiles sur les comptes/acteurs avec lesquels les
membres du public sont le plus engagés, ce qui peut être mis à profit pour diffuser des messages clés.
1.2 Abstract
Governments are increasingly turning to social media platforms such as Twitter to disseminate public health
information to the public, as evidenced during the COVID-19 pandemic. The purpose of this paper is to gain a
better understanding of Canadian government and public health officials’ use of Twitter as a dissemination
2platform during the pandemic, and to explore the public’s engagement with and sentiment towards these
messages. We examined the account data of 93 Canadian public health and government officials during the first
wave of the pandemic (December 31, 2019 – August 31, 2020). Our objectives were to: 1) determine the
engagement rates of the public with Canadian federal and provincial/territorial governments and public health
officials’ Twitter posts, 2) illustrate the evolution of the Canadian public discourse during the pandemic’s first
wave by a hashtag trends and 3) provide insights on the public’s reaction to the Canadian authorities’ tweets
through sentiment analysis. To address these objectives, we extracted Twitter posts, replies and associated
metadata available during the study period in both English and French. Our results suggest members of the
public demonstrated increased engagement with federal officials’ Twitter accounts as compared to
provincial/territorial Twitter accounts. Hashtag trends analyses illustrated the topic shift in the Canadian public
discourse, which initially focused on COVID-19 mitigation strategies and evolved to address emerging issues
such as COVID-19 mental health effects. Additionally, we identified 11 sentiments in response to officials’
COVID-19 related posts. This study illustrates the potential to leverage social media to understand public
discourse during a pandemic. We suggest that routine analyses of such data can provide real-time
recommendations to government and public health officials on public sentiments during a public health
emergency and can provide useful insights on the accounts/actors with which members of the public are most
engaged, which can be leveraged to disseminate key messages.
1.3 Introduction
The novel coronavirus (COVID-19, SARS-CoV-2) was first documented in December 2019 in Wuhan City, Hubei
Province, China [1]. The virus spread rapidly around the world and by March 11, 2020, the World Health
Organization (WHO) declared the COVID-19 outbreak a pandemic [2]. Worldwide, as of April 27, 2021, a total
of 148,335,023 cases of COVID-19 and 3,131,636 deaths were confirmed in 192 countries and regions [3], with
cases surmounting those of the Middle East Respiratory Syndrome (MERS), the Severe Acute Respiratory
Syndrome (SARS) and the previous H1N1 epidemics [4-6].
As cases increased and community spread worsened, government and public health officials worldwide enacted
measures to reduce transmission including handwashing [7], social distancing, and self-isolation [8, 9]. Many
officials have turned to social media, in addition to traditional media sources (e.g., television, radio), as a platform
through which information could be disseminated [10, 11].
The purpose of our study is to provide insight on how Canadian federal and provincial/territorial government and
public health officials used Twitter as a platform to disseminate COVID-19 information and to determine the
public’s engagement with and reaction to these messages. We chose Twitter as the target research social media
3platform since it is one of the world’s largest social media platforms and allows users to disseminate real-time
information to a wide audience [12].
Using data mining, quantitative and qualitative analyses, and machine learning techniques, we aim to provide
through our research insights for government and public health officials on how to optimize messages during
public health emergencies. Our objectives were to 1) determine the engagement rates of the public with the
Canadian federal and provincial government and public health officials’ Twitter posts, 2) hashtag trends and
topics shift related to the Canadian public discourse regarding COVID-19 on Twitter, and 3) an in-depth
sentiment analysis of Twitter users’ responses to government and public health officials’ COVID-19 related
Twitter posts.
1.4 Methods
1.4.1 Twitter as the target data platform
We chose Twitter as our target research social media platform. Twitter is a microblogging and social networking
platform, launched on July 15, 2006, and on which registered users post and interact with 280-character
(previously 140-character) messages known as tweets. Since its launch, Twitter has become an important
channel for public communication [13]. Its usefulness, efficiency and impact has particularly been demonstrated
in the contexts of politics [14], crisis [15], brand communications [16] and everyday interpersonal exchanges
[17]. Twitter has naturally evolved as a key public health dissemination tool during outbreak situations [18], as
was observed during the COVID-19 pandemic. Furthermore, Twitter has been increasingly used to conduct
research, as it allows for the study of large-scale, world wide web communication [19].
1.4.2 Government and public health officials’ social media accounts
To provide insights regarding Canadian public officials’ discourse during the COVID-19 pandemic, we canvassed
four categories of Twitter accounts: provincial/territorial and federal government officials’ accounts, and
provincial/territorial and federal public health officials’ accounts, respectively. We selected these accounts since
government and public health authorities have led the dissemination of COVID-19 related information to the
public in Canada.
For the provincial/territorial and federal government official accounts, we downloaded tweets from the official
department/organizational accounts (e.g., @Canada, @ONgov, @GouvQc) as well as the individual accounts
of the corresponding organizations’ leaders (e.g., Canada’s Prime Minister Justin Trudeau, Ontario’s Prime
Minister Doug Ford, and Quebec’s Prime Minister François Legault). We replicated this model for the public
health officials’ accounts, downloading tweets from organizational handles (e.g., @GovCanHealth,
@ONThealth, @sante_qc) as well as the leaders of these organizations (e.g., Canada’s Minister of Health the
4Honourable Patty Hajdu, Ontario’s Minister of Health and Long-Term Care the Honourable Christine Elliot, and
Quebec’s Minister of Health and Social Services Christian Dubé). In Appendix A, we present the full list of all
Twitter handles included to obtain data to inform this study.
To ensure the validity of the selected accounts, we limited our data collection to Twitter-verified accounts only.
Verified accounts are often reserved for well-known organizations or individuals [20] and are indicated by a blue
verified badge that appears next to the account holder’s name. It is important to note that a verified badge does
not imply an endorsement by Twitter.
1.4.3 Data access and format
Twitter offers two relevant Application Programming Interface (API) components to access tweets data and
metadata. These applications are the Representational State Transfer (REST) API, used to retrieve past tweets
matching established criteria, within a search window available for Twitter searches; and the streaming API,
used to subscribe to a continuing stream of new tweets matching the criteria, delivered via the API as soon as
they become available. Each of these two APIs is offered by Twitter on three different levels, known as the
standard API, the premium API and the enterprise API [21]. To inform our study, we accessed tweets through
the REST component of the premium API.
Our data analysis was conducted using R, which is a programming language and free software for statistical
computing and graphics [22]. R is widely used among statisticians and data miners for developing statistical
software and data analysis. We used rtweet, which is a community-maintained R client for accessing Twitter’s
REST and stream APIs [23] in order to access the data and metadata needed to perform our analysis.
Mining tweets through the Twitter REST Premium API provided us with the text of the tweets as well as with
several metadata, including the sending user’s Twitter name and numerical ID, the time of posting, geolocation
information (when available), and various data points which relate to the sender’s Twitter profile settings that we
briefly describe in Appendix B [24].
1.4.4 Data collection, filtering, and preprocessing
Between December 31, 2019 and August 31, 2020, we archived Twitter posts, replies and associated Metadata
published by the Twitter accounts presented in Appendix A. We selected this study period as it represented a
period that preceded and followed the first wave of the COVID-19 pandemic, which was confirmed using Google
Trends data [25, 26]. In total, we assessed 65,793 archived tweets, and 80,256 archived replies.
To filter through the archived tweets and replies to identify tweets and replies relevant to the study, we used
hashtags present in the tweets’ metadata. To facilitate this, we established a list of hashtags related to COVID-
519 (see Appendix C for full list of included hashtags). Included tweets were required to have at least one of these
COVID-19 related hashtags in order to be retained in the study dataset. To develop the list of COVID-19 related
hashtags, we used relevant literature [27, 28] and social media tools and guides [29-31]. Some of these hashtags
were related specifically to the COVID-19 pandemic (e.g., #COVID-19, #2019nCov), others were related to
public health messaging or COVID-19 impacts (e.g., #StayHome, #StayHomeSaveLives), or related topics (e.g.,
#N95, #PPE which describe the required personal protective equipment needed during the pandemic).
This process was followed by a second round of filtering. First, we eliminated any non-English or non-French
language tweet and reply from our dataset. Next, we removed retweets to reduce repetition in the dataset.
Finally, we converted all tweets and replies text to lowercase to avoid duplication due to text case. The second
round of filtering resulted in a total of 24,550 tweets and 46,731 replies. The data filtering and preprocessing
workflow is depicted in Figure 1.
Figure 1: Data filtering and preprocessing workflow
Finally, and in order to give context to the analysis we performed on the tweets and replies, we collected data
related to the number of COVID-19 confirmed cases in Canada on a daily basis from December 31, 2019 to
August 31, 2020. This data was obtained from the COVID-19 Data Repository maintained by the Center for
Systems Science and Engineering (CSSE) at Johns Hopkins University [32].
61.4.5 Data analysis
We performed three types of data analysis on our filtered dataset of COVID-19 related tweets:
1. Analysis of the Canadian public’s engagement with government and public health officials’ tweets.
2. Hashtag analysis to illustrate the evolution of the Canadian public discourse during the pandemic’s first
wave.
3. Sentiment analysis to provide insights on the public’s reaction to the Canadian authorities’ tweets.
We mention that all federal officials’ accounts (government officials or heath officials) target all Canadians.
However, provincial/territorial accounts (government officials or health officials) target the respective population
of each province or territory. We observe that the targeted population is not the same. However, when combined,
provincial/territorial tweets target all Canadians. Consequently, the data analysis of the provincial/territorial
tweets is conducted on the combined set of tweets. Doing so, our data comparison is based on two sets of
tweets targeting the same population.
1.4.5.1 Engagement metrics analysis
We established three engagement metrics with tweets: the number of retweets, the number of likes, and the
ratio of interest. A retweet is a re-posting of a tweet; Twitter's retweet feature helps users to quickly share a tweet
with all of their followers. Retweets can be considered as a sign of value as a user finds a tweet valuable enough
to share it with their audience. Participants can also “like” Tweets by clicking a heart icon. Likes can be
considered as a sign of appreciation users can express towards tweets. These metrics demonstrate the rate at
which a tweet has been approved and shared by Twitter users. The ratio of interest is the ratio of number of
interactions to the number of tweets, where the number of interactions is the sum of the number of likes and the
number of retweets [33, 34]. The ratio of interest provides the average of interactions for each tweet. To provide
more context to the data, we transposed these tweets against the evolution of COVID-19 confirmed cases in
Canada on a daily basis during the study period.
1.4.5.2 Hashtag trends analysis
A hashtag is used to index keywords or topics on Twitter. This function allows Twitter users to easily follow topics
they are interested in. The hashtag trends analysis aims to show how the COVID-19 discourse evolved during
the study period.
The hashtags analysis was conducted by presenting the most popular hashtags in our dataset and by eliminating
all the hashtags that were used to filter the Tweets that we presented in Appendix C. Doing so, we were able to
observe what people really discussed in this period of time. In addition, and to give the data more context, we
7crossed the evolution of trending hashtags over time with the number of COVID-19 confirmed cases in Canada
on a daily basis.
1.4.5.3 Sentiment analysis
Sentiment analysis is also known as a subjectivity analysis, opinion mining or appraisal extraction. Sentiment
analysis can be conducted using an automated mining of attitudes, opinions, views and emotions from text,
speech and database sources [35]. This mining is produced through Natural Language Processing (NLP) and
Machine Learning (ML) techniques [36]. The objective of sentiment analysis is to understand the emotions
underlying a data source.
In the context of this study, we sought to capture public sentiments in response to government and public health
officials’ tweets. We based our classified of tweet replies in 10 sentiment categories identified in the Chew &
Eysenbach’s 2010 study of Twitter data during the H1N1 pandemic (See Appendix D) [37].
We refined these 10 sentiment categories to ensure that they captured the full spectrum of sentiments in our
dataset. To do so, we first conducted a training phase followed by an automated text classification phase. We
used MonkeyLearn [38], an online machine learning platform, to perform this analysis (see Figure 2).
Figure 2: The overall sentiment analysis process
In the training phase, we manually coded 1,424 randomly selected Twitter replies from our existing dataset using
the 10 Chew & Eysenbach sentiment categories. Where needed, the coders added new categories to capture
new sentiments. The coders continued to conduct iteratively rounds of coding until a Cohen’s Kappa of greater
8than 0.6 was reached, which indicates a good level of coder agreement on the classification of replies according
to their sentiments [39].
In the first round, using a dataset of 500 tweets from the 1,424 tweets, the Kappa coefficient was 0.46 which
demonstrated low levels of agreement between the coders. The coders reconciled coding discrepancies and
refined the coding framework using a consensus discussion which included the addition or removal of sentiment
codes. Using another set of 924 tweets, the coders independently categorized the sentiments and achieved a
Cohen’s Kappa value of 0.67 [40].
Following the training phase, we defined two new sentiment categories and adapted 3 categories. The final 11
sentiment categories used in this paper, including definitions and examples, are listed in Table 1.
Category Definition Examples
Concern Replies that express COVID-19 "omg ppl stay home for the love of god”
related fear, anxiety, worry, or sadness #stayathome
for self or others. May also express
skepticism.
Distrust Replies that contradict the reference "Deflecting much? You lied about masks!
standard or contain unsubstantiated It was all BS! You told Canadians we
information. May make speculations or didn’t know how to safely wear mask"
express distrust of authority or the
media. May include conspiracy "#CoronaVirus #CoVid19 LancetGate: Big
theories or misinformation. Pharma Corruption And Their COVID-19
Lies"
Downplay Replies that attempt to de-emphasize "there’s nothing to be afraid of."
the potential risks of COVID-19 or
bring it into perspective. May also "don’t forget to tell everyone that the
express a lack of concern or normal flu has 2x the cases and 8 deaths
disinterest. this year"
Frustration Replies that express anger, "This team should be fired! Shame on
annoyance, scorn, or volatile you!!"
contempt. May include coarse
language. "You are a disgrace and a fraud
#RESIGN"
Humour or Comedic or sarcastic replies. "You look so funny when you want to be
sarcasm credible"
"you have a funny way of showing your
appreciation"
Information Replies that include questions or "Here is a question: The man who died at
requests and demand clarifications or help. his home of covid19 (not hospital), was he
inquiries tested for covid19?"
"What measures exactly?"
9Information Replies containing COVID-19 news, "there are 598 cases in continuing care
sharing and updates, or any related information. facilities, 921 cases at [location]; 390
resources May be a title or summary of a linked cases at jbs in [location].”
article.
Personal Replies where users mention a direct "me and my wife are both feeling sick.
experiences (personal) or indirect (e.g. family or sore throat. tired. minor cough. chest
acquaintance) experience with tightness. we work at [location]. so lots of
COVID-19. exposure to the public. the phone line is
busy."
Personal Replies where users express opinions "help the front-line staff and give them
opinion or about the COVID-19 pandemic (i.e., proper equipment including n95 masks.
suggestion their perceptions on the SARS-CoV-2 please communicate with the health
virus, the COVID-19 situation or news) minister"
and provide suggestions.
"while social distancing may be
happening. self isolation isn’t. that is
disappointing. please make sure people
who are sick have the space they need to
heal away from other people."
Racism and Replies related to racist and "CCP restricted Wuhan ppl to go to
stigma discrimination-based expressions Beijing in Jan 2020. Why? Because CCP
knew that Wuhan Coronavirus was
dangerous. CCP allowed Wuhan ppl to go
to Canada, USA, etc in Jan 2020. Why?
Because CCP used Wuhan Coronavirus
as a bioweapon to attack the West.
#ChinaLiedPeopleDied"
Relief Replies that express joy, happiness or "Please keep the great job that you are
sense of peace. May also express doing"
grating and acknowledgement.
"thank you! so glad you and your family
are well. this is a reassuring message and
so appreciated."
Table 1: The final categories of sentiments, their definition, and examples of tweets for each category
Once we established our new sentiment analysis coding framework, we launched the trained machine learning
classification model to analyze the remaining dataset. We first validated the machine algorithm using an
agreement assessment and a machine learning classifier performance evaluation.
For the agreement validation, we compared manually coded tweets to machine coded tweets. The Cohen’s
Kappa coefficient value was of 0.47, mainly due to the categories of sentiments known as “Concern” and
“Frustration” which were confused by the machine model. We enriched the training dataset with additional
sentences for these categories and re-ran the analysis which led to a Cohen’s Kappa coefficient value of 0.74,
which signifies strong agreement between the manual and automated coding.
10Next, for the machine learning validity evaluation, we measured the performance of the classifier using the
following metrics:
▪ Accuracy: which is the number of correct predictions the classifier has made divided by the total number
of predictions [41]. The greater the Accuracy is, the more accurate our classifier is.
▪ Precision: which states the proportion of texts that were predicted correctly out of the ones that were
predicted as belonging to a given category or tag. In other terms, it shows the exactness of the classifier
vis-à-vis each text category by determining the ratio of texts that are truly belong to a given category to
the texts that are identified in that category [42].
▪ Recall: which is the ratio of texts that are correctly classified as belonging to a given category to the
total number of texts of that categories [42]. It shows the completeness of a given category with respect
to each category [43].
▪ F1 score: which is identified as a combination and harmonic means of precision and recall. This metric
is widely adopted to evaluate the performance of the classification for each of the categories [42]. The
greater the F1 Score, the better is the performance of our model.
The global measures of accuracy and F1 score for the model were 79% and 83%, respectively. For the categorial
measures, the precision averaged 65% and the recall averaged 78%. Notably, we managed to achieve a
significant recall and precision rate; often, improvement on one of these metrics is at the expense of the other
[44]. These results show that the automated model was able to correctly classify the sentiments using an
accuracy of 76%. Subsequently, we used the model to code the full dataset of 46,731 replies.
111.5 Results
1.5.1 Engagement metrics
In Figure 3 and in Table 2, we present the results related to the engagement metrics. We also present in
Appendix E additional engagement metrics results towards the COVID-related Canadian public discourse.
Figure 3: The ratio of interest towards the COVID-related tweets by Canadian officials x number of COVID-19 confirmed cases in Canada
from December 31, 2019 to August 31, 2020.
Government Officials of all Canadian Health Officials of all Canadian
COVID-19 Federal Government Officials of Canada Federal Health Officials of Canada
Provinces and Territories Provinces and Territories
confirmed (3 Twitter accounts) (4 Twitter accounts)
Months (30 Twitter accounts) (56 Twitter accounts)
cases in
Canada Ratio of Ratio of Ratio of Ratio of
Tweets Retweets Likes Tweets Retweets Likes Tweets Retweets Likes Tweets Retweets Likes
Interest Interest Interest Interest
December, 2019 0 0 0 0 - 0 0 0 - 0 0 0 - 0 0 0 -
January, 2020 12 7 4,728 1,397 875.00 14 5,336 85 387.21 150 4,921 5,243 67.76 215 33,244 15,948 228.80
February, 2020 234 10 537 187 72.40 52 829 43 16.77 218 17,939 5,969 109.67 367 12,713 3,559 44.34
March, 2020 51,802 303 176,994 278,134 1,502.07 1,492 97,721 90,486 126.14 812 193,767 275,694 578.15 2,835 646,234 155,052 282.64
April, 2020 929,100 293 67,705 92,811 547.84 1,892 65,765 155,289 116.84 974 101,030 204,650 313.84 2,588 99,129 117,841 83.84
May, 2020 2,368,790 202 20,474 29,214 245.98 1,435 25,064 48,562 51.31 1,115 49,036 103,091 136.44 1,920 40,353 56,395 50.39
June, 2020 3,015,562 144 11,805 10,893 157.63 786 14,292 34,585 62.18 876 29,876 47,777 88.64 1,287 26,607 49,457 59.10
July, 2020 3,460,185 77 5,161 2,252 96.27 664 12,722 27,338 60.33 659 25,685 45,952 108.71 1,119 32,453 72,028 93.37
August, 2020 3,854,051 54 3,861 5,232 168.39 505 9,468 16,630 51.68 617 19,673 40,100 96.88 868 27,447 52,310 91.89
Table 2: Descriptive data showing the number of tweets, retweets, likes and the ratio of interest related to COVID-related Tweets by
Canadian government and public health officials from December 31, 2019 to August 31, 2020.
The results show that the provincial/territorial government officials of Canada tweeted a total of 6,840 COVID-
related tweets for a total of 30 Twitter accounts analyzed (an average of 228 tweets per account). We also
observe that the federal government of Canada tweeted a total of 1,090 COVID-related tweets for a total of 3
Twitter accounts analyzed (an average of 363 tweets per account). The calculated ratio of interest of the federal
government officials’ accounts is of 652.65, which is higher than that of the provincial/territorial government
officials of 88.34, meaning that the public engaged to a greater extent with tweets from the federal government
officials’ accounts. This was observed for the entire duration of the study, with a peak of engagement with federal
government officials’ accounts during the month of March.
12The results also show that the provincial/territorial health officials tweeted a total of 11,199 COVID-related tweets
for a total of 56 Twitter accounts analyzed (an average of 200 tweets per account). We also see that the federal
health officials tweeted a total of 5,421 COVID-related tweets for a total of 4 Twitter accounts analyzed (an
average of 1355 tweets per account). The calculated ratio of interest of the federal health officials’ accounts is
of 215.90, which is higher than that of the provincial/territorial health officials of 128.65, meaning that the general
public in Canada engaged more with the federal health officials than with the provincial/territorial health officials.
The periods that recorded the highest engagement are the months of March and April.
Furthermore, we observe that the general public in Canada engaged more with the federal government officials’
than with the federal health officials. However, we observe that the general public engaged generally more with
the provincial/territorial health officials than with the provincial/territorial government officials.
Overall, our results suggest that the general public demonstrated increased engagement with federal Twitter
accounts with an overall ratio of interest of 165.90 as compared to provincial/territorial Twitter accounts with an
overall ratio of interest of 157.11. We also observe that in average, each federal Twitter account tweeted more
than a provincial/territorial Twitter account.
1.5.2 Hashtag trends
In Figure 4-7 and Table 3, we present the results of the hashtags analysis.
Figure 4: The hashtag trends related to the federal government of Canada from December 31, 2019 to August 31, 2020.
13Figure 5: The hashtag trends related to the government officials of all Canadian provinces and territories from December 31, 2019 to
August 31, 2020.
Figure 6: The hashtag trends related to the federal health officials of Canada from December 31, 2019 to August 31, 2020.
Figure 7: The hashtag trends related to the health officials of all Canadian provinces and territories from December 31, 2019 to August
31, 2020.
14Months December, 2019 January, 2020 February, 2020 March, 2020 April, 2020 May, 2020 June, 2020 July, 2020 August, 2020
MENTALHEALTH (44) LONGTERMCARE (49) FLATTENTHECURVE (238) FLATTENTHECURVE (193) PHYSICALDISTANCING (151) PHYSICALDISTANCING (79) TESTANDTRACE (60) TESTANDTRACE (49)
LONGTERMCARE (17) MENTALHEALTH (20) SOCIALDISTANCING (120) PHYSICALDISTANCING (184) MENTALHEALTH (96) TESTANDTRACE (78) MENTALHEALTH (44) EPIDEMIOLOGY (44)
PLANKTHECURVE (80) STAYHOME (85) TESTANDTRACE (67) FLATTENTHECURVE (35) PHYSICALDISTANCING (43) MENTALHEALTH (37)
PHYSICALDISTANCING (79) PLANKTHECURVE (82) FLATTENTHECURVE (65) LONGTERMCARE (24) EPIDEMIOLOGY (40) PHYSICALDISTANCING (22)
Hashtags LONGTERMCARE (55) MENTALHEALTH (65) STRONGERTOGETHER (44) MENTALHEALTH (22) LONGTERMCARE (31) LONGTERMCARE (17)
and their n/a
occurrences SLOWTHESPREAD (51) LONGTERMCARE (48) PLANKTHECURVE (30) EPIDEMIOLOGY (21) DÉPISTAGE (17) DÉPISTAGE (16)
MENTALHEALTH (34) PROTECTTHEVULNERABLE (43) STAYHOME (25) DÉPISTAGE (17) PLANKTHECURVE (15) STAYSAFE (6)
STAYHOME (26) TESTANDTRACE (42) PROTECTTHEVULNERABLE (25) PLANKTHECURVE (16) FLATTENTHECURVE (10) STRONGERTOGETHER (4)
PROTECTTHEVULNERABLE (25) TOGETHERAPART (42) LONGTERMCARE (18) TOGETHERAPART (15) STRONGERTOGETHER (7) STOPTHESPREAD (4)
STRONGERTOGETHER (22) STRONGERTOGETHER (36) STOPTHESPREAD (16) STRONGERTOGETHER (13) TOGETHERAPART (4) TOGETHERAPART (3)
Table 3: COVID-19 hashtag trends per month used by the Canadian government and health officials’ accounts from December 31, 2019
to August 31, 2020, demonstrating the topic shift.
Provincial/territorial governments used much more COVID-19 related hashtags compared to the federal
government (443 versus 135 respectively). While all government accounts used hashtags related to COVID-19
mitigation strategies such as #SocialDistancing or #PhysicalDistancing, we observed some trend differences.
For instance, the federal government included hashtags on the economic fallout of the COVID-19 pandemic
using the hashtag #EconomicResponse, while provincial/territorial governments focused on mental health
impacts of the COVID-19 pandemic using the hashtag #MentalHealth (see Figures 4-5) that was mentioned 47
times by the provincial/territorial governments and only 10 times the federal government.
Conversely, among public health officials, federal officials used more COVID-19 hashtags compared to
provincial/territorial health officials (1,437 hashtags versus 1,280 hashtags, respectively). While all public health
officials, similar to the government officials, used hashtags related to COVID-19 mitigation strategies such as
#SocialDistancing or #PhysicalDistancing, the federal health officials were more interested in the testing and
tracing as measures to control the pandemic using the hashtags #TestAndTrace and #Depistage, when the
provincial/territorial health officials were more interested in encouraging habits that aim to slow the spread of the
virus such as hand washing using the hashtag #WashYourHands.
Table 3 illustrates the topic shift over time in the COVID-related Canadian public discourse combining the four
categories of tweeting sources. We observe an immediate shift in public discourse from the period preceding
the first wave of the COVID-19 pandemic to the period of the first wave (beginning March 2020) with top trending
tweets related to COVID-19 mitigation strategies (e.g., #SocialDistancing, #TestAndTrace and #StayHome) and
COVID-19 mitigation goals (e.g., #FlattenTheCurve, #PlankTheCurve and #StopTheSpread) During provincial
lockdowns, we saw trends such as #StayAtHome emerge. We also saw changes in language, for instance,
#PhysicalDistancing quickly replaced the hashtag of #SocialDistancing. Overall, the COVID-19 related Canadian
discourse was fairly consistent throughout the first wave of the pandemic.
1.5.3 Sentiment analysis
Table 4 presents the results related to the sentiment analysis. We also present in Appendix F additional results
that depict the evolution of the public’s sentiments towards the COVID-related Canadian public discourse.
15Humour Information Information Personal Racism
Sentiments Personal
Months Concern Distrust Downplay Frustration or requests and sharing and opinion or and Relief
experiences
sarcasm inquiries resources suggestion stigma
December, 2019 0% 0% 0% 0% 0% 0% 0% 0% 0% 0% 0%
January, 2020 0% 0% 0% 0% 0% 0% 0% 0% 0% 0% 0%
February, 2020 16% 1% 1% 9% 1% 8% 4% 5% 6% 1% 4%
March, 2020 24% 1% 2% 10% 2% 19% 14% 11% 14% 3% 12%
April, 2020 21% 2% 3% 11% 1% 15% 12% 10% 12% 3% 12%
May, 2020 20% 2% 4% 11% 1% 20% 11% 11% 12% 3% 17%
June, 2020 23% 2% 2% 12% 2% 17% 13% 11% 11% 3% 11%
July, 2020 23% 1% 3% 13% 1% 18% 11% 11% 13% 3% 13%
August, 2020 25% 2% 2% 13% 1% 16% 14% 11% 14% 2% 14%
Total sentiment 22% 1% 2% 11% 1% 16% 11% 10% 12% 2% 12%
Table 4: The proportions of expressed sentiments per month towards the government and health officials’ accounts from December 31,
2019 to August 31, 2020.
Following the sentiment analysis that we conducted in our study, we found that the results suggest that Twitter
can be used to track and measure the public sentiments about the COVID-19 pandemic almost in real time. In
fact, while conducting our sentiment analysis of the replies of the general public to COVID-19 related tweets
posted by provincial/territorial and federal governments and health officials in Canada, we were able to detect
and track 11 different sentiments, namely: “concern”, “distrust”, “downplay”, “frustration”, “humor or sarcasm”,
“information requests and inquiries”, “information sharing and resources”, “personal experiences”, “personal
opinion or suggestion”, “racism and stigma” and “relief”. Our findings reveal that 22% of the replies express
“concern”, while 16% of the replies are related to “information requests and inquiries” where the general public
have been addressing questions to the Canadian officials related to different subjects such as travel restrictions
or lockdown restrictions. Also, many Twitter users expressed their “frustration” towards the Canadian officials
discourse on Twitter representing an overall 11% of the total number of the tweets replies that we studied.
Moreover, our analysis shows that the public have been less frustrated with the discourse of the Canadian health
officials than with the discourse of the Canadian governments’ officials. Finally, only 12% of the replies expressed
relief towards the public discourse of the Canadian officials on Twitter, therefore acknowledging the efforts that
are put by the Canadian officials.
1.6 Discussion
In this paper, we analyzed data collected from the Twitter platform by looking at the messages posted by
government entities (at different levels: federal and provincial/territorial) during the first wave of the COVID-19
pandemic. This collected data have been analyzed from three different perspectives: engagement metrics,
hashtag trends, and sentiment analysis.
The findings of our study related to the engagement metrics analysis demonstrated that the general public was
more engaged with the federal officials’ accounts than with the provincial/territorial officials’ accounts. Generally,
by hypothesis, people are more connected to their closest level of government [45]. Consequently,people should
16Vous pouvez aussi lire