2019 Rapport canadien sur les modes de paiement et les tendances des paiements - Payments Canada
←
→
Transcription du contenu de la page
Si votre navigateur ne rend pas la page correctement, lisez s'il vous plaît le contenu de la page ci-dessous

2019 Rapport canadien sur les modes de paiement et les tendances des paiements
Rapport 2019 sur les modes de paiement
et les tendances des paiements au Canada
Notes des auteurs
Michael Tompkins
Responsable, Politiques et recherches, Paiements Canada
mtompkins@paiements.ca
Viktoria Galociova
Économiste, Paiements Canada
vgalociova@paiements.ca
Ayant reçu de leur part des données, des renseignements,
des précisions sur les hypothèses et des commentaires sur
le présent rapport ou les précédents, Paiements Canada tient
à remercier les organisations suivantes :
Banque du Canada
INTERAC®
INTRIA
Symcor
Technology Strategies International
Euromonitor International
RFi Group
Léger
Ipsos Canada
Les points de vue exprimés dans le présent rapport appartiennent aux auteurs
et ne doivent pas être attribués aux organisations susmentionnées.
Les documents de travail de Paiements Canada traitent de diverses
questions liées à son rôle. Les points de vue exprimés dans le présent
document sont ceux des auteurs au moment de la publication et ne               @paymentscanada
représentent pas nécessairement ceux de Paiements Canada.
                                                                               Payments Canada

© Paiements Canada, 2019                                                       www.payments.ca
®
    Marque déposée d’Interac Corp..                                            ISSN 2369-3541
                                                                                                 ii
CONTENTS
   ii Author Notes                                                  36   Appendix I:
   1 Executive Summary                                              36     Detailed Payment Segment Charts
   4 Payments from Coast to Coast                                   36     Figure A1: Total Annual CPMT Transactions
   7 Introduction and Methodology                                          (Volume and Value)
   8 The Payments Landscape                                         36     Figure A2: All Payment Method
   9 Findings                                                              Annual Totals
   9   ACSS Data                                                    37     Figure A3: Average Transaction Size
  10   Overall Canadian Payment Transaction Trends                  37     Figure A4: All Payment Method Average Annual
  11   Year-over-year 2018                                                 Growth Volume (10, 5 and 1 year CAGR)
  12 The Payment Environments                                       38     Figure A5: Value (10, 5 and 1 year CAGR)
  12   A. Proximity Transactions and the                            40   Appendix II: Methodology, definitions and
       Evolving POS Environment                                          segment descriptions
  13   Cash                                                         40     A. Methodology
  15   Debit Cards                                                  41     B. Definitions and segment descriptions
  16   Credit Cards
  18   Prepaid cards
  19   Contactless payments (via card
       and mobile devices)
  20   The e-commerce Environment
  21   Featured Analysis A
  24   B. The Remote Transaction Environment
  24   Cheque and paper items
  25   EFT
  26   Featured Analysis B
  27   Online transfers
  29   Featured Analysis C
  32   Remote consumer transactions
  33   Cheques are still paying the rent
  33   Remote commercial transactions
  34   C. Business Payments

                                                                                              PDF Navigation
                                                                                              This is an interactive PDF.
                                                                                              Click on any listing in
                                                                                              Contents to be taken to that
                                                                                              page. Click on      from any
                                                                                              page to return to Contents.

2 019 C A N A D I A N PAY M E N T M E T H O D S A N D T R E N D S
RÉSUMÉ
Chaque année, Paiements Canada dresse un portrait général des modes de paiement et des tendances du secteur
au pays. Elle a travaillé en étroite collaboration avec des fournisseurs de services de paiement, des consultants du
domaine et des chercheurs afin de réunir un ensemble exhaustif de données pour 2018 et d’effectuer une analyse
réfléchie des habitudes de paiement des consommateurs et des entreprises.
Le marché des paiements au Canada a crû en 2018, atteignant un total de 21,1 milliards d’opérations de
consommateurs et d’entreprises d’une valeur de plus de 9,9 billions de dollars. La comparaison avec les données
d’il y a cinq ans fait ressortir une transition remarquable : les Canadiens continuent d’augmenter leur recours aux
modes de paiement électroniques.
D’après les données de 2018, les cartes de débit et de crédit représentent toujours la plus grande portion du
volume total des opérations, tandis que les transferts électroniques de fonds (TEF), les chèques et les effets papier
dominent toujours sur le plan de la valeur globale des opérations (voir la figure). Dans l’ensemble, l’utilisation des
cartes de crédit au Canada a augmenté en 2018, si bien que le volume des opérations faites par carte de crédit
a frôlé le volume des opérations faites par carte de débit. Parallèlement, la croissance de l’utilisation des TEF
par les entreprises a fait grimper la valeur globale des TEF, qui a presque atteint la moitié de la valeur de toutes
les opérations comprises dans le Rapport canadien sur les modes de paiement et les tendances des paiements.
Le volume des chèques et des effets papier ne représentait que 3 % du volume total des paiements en 2018, mais
la valeur totale des chèques et effets papier est restée somme toute élevée, soit plus de 39 % de la valeur totale
des opérations.
Figure : Totaux des paiements et des opérations en 20181

                                      Volume en 2018                                                                               Valeur en 2018

                                                                                               Guichets automatiques; 0,7 %  11 %
        Guichets automatiques;                Cartes prépayées;                                                                         Cartes prépayées;
             2,4 %  40 %                       1,4 %  74 %                                          Argent comptant; 0,9 %  32 %       0,2 %  73 %

        Chèques et effets                       Transferts en ligne; 2 %  573 %                        Cartes de débit; 3 %  24 %      Transferts en ligne; 1,4 %  550 %
       papier; 3,2 %  29 %
                                                                                            Cartes de crédit; 6 %  41 %

                                                                            Argent comptant;
                                                                              21 %  40 %

                                      21,1 G                                                                                      9,9 T$
       TEF; 13 %
         21 %                                                                                                                                                 TEF;
                                                                                                                                                            49 %  45 %

    Cartes de crédit;                                                                               Chèques et effets
      28 %  52 %                                                   Cartes de débit;
                                                                                                   papier; 39 %  10 %
                                                                      29 %  29 %

Cette dichotomie entre le volume et la valeur des opérations s’explique principalement par le fait que les Canadiens
font leurs opérations dans deux environnements très distincts, à savoir celui des points de vente et celui des
paiements à distance.

1   Les flèches représentent la hausse ou la baisse de l’utilisation des principaux modes de paiement sur la période 2013-2018.

2 019 C A N A D I A N PAY M E N T M E T H O D S A N D T R E N D S                                                                                                             1
Points de vente
On appelle « opérations au point de vente » les opérations ayant lieu aux emplacements physiques (commerces ayant
pignon sur rue) ou virtuels (boutiques en ligne) des bénéficiaires, y compris les applications d’achat et autres plateformes
de commerce électronique. En 2018, un total de 15,7 milliards de paiements a été effectué au point de vente, pour une
valeur de plus de 856 milliards de dollars (moyenne de 54 $ par opération).
La poursuite de la croissance des paiements électroniques transforme l’environnement des points de vente, de
plus en plus axé sur le commerce électronique et les appareils mobiles. Les tendances suivantes ont aussi été observées
en 2018 :
L’utilisation de l’argent comptant a continué de baisser significativement, perdant plus de 9 % en volume,
principalement au profit des paiements par carte au point de vente, mais l’argent est néanmoins demeuré l’un
des principaux modes de paiement, avec 4,5 milliards d’opérations.
La carte de débit2, qui avait supplanté l’argent comptant à titre de mode de paiement le plus répandu pour la
première fois en 2016, a continué sur sa lancée : le nombre d’opérations de débit a atteint 6 milliards. Cette
tendance s’est maintenue en 2018, où le nombre de transactions de débit a atteint six milliards.
La carte de crédit3 est demeurée le deuxième mode de paiement au point de vente pour ce qui est du volume
des opérations, dépassant en valeur tous les autres modes de paiement au point de vente réunis.
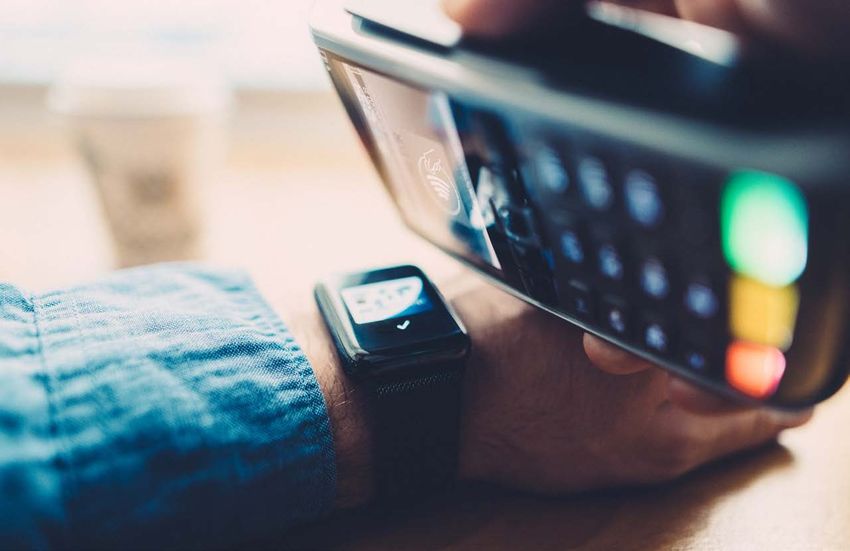
Fait à souligner, les paiements sans contact4 (par carte ou par appareil mobile) au point de vente ont connu une
forte croissance : ils ont totalisé 4,1 milliards d’opérations, pour une valeur de 129,9 milliards de dollars. Depuis
2017, le volume et la valeur des paiements sans contact ont augmenté de près de 30 %.
La carte prépayée (physique ou virtuelle) a poursuivi sa croissance en volume à un rythme presque deux fois
supérieur au taux de croissance combiné des cartes de débit et de crédit (9 % contre 5 %); les Canadiens ont eu
davantage recours aux cartes prépayées, surtout pour le commerce électronique5
2 La catégorie « carte de débit » comprend toutes les opérations (point de vente, carte au dossier, en ligne, paiement sans contact, etc.).
3 La catégorie « carte de crédit » comprend toutes les opérations (point de vente, carte au dossier, en ligne, paiement sans contact, etc.).
4 Le terme « paiement sans contact » désigne le fait pour un consommateur d’acheter un produit ou un service en utilisant une technologie d’identification par radiofréquence (IRF) ou de communication
en champ proche (CCP), c’est-à-dire en déposant sa carte ou son téléphone cellulaire sur le terminal.
5 Il s’agit ici de toutes les opérations par carte de débit ou de crédit (point de vente, carte au dossier, en ligne, paiement sans contact, etc.).
2 019 C A N A D I A N PAY M E N T M E T H O D S A N D T R E N D S 2
Opérations à distance
Les opérations à distance comprennent toutes les opérations qui ne sont pas effectuées à un emplacement physique
(commerce ayant pignon sur rue) ou virtuel (en ligne) du bénéficiaire, c’est-à-dire les cas où le payeur fait plutôt appel à
une institution financière ou à un fournisseur de services de paiement en tant qu’intermédiaire qui accepte les instructions
de paiement et transfère les fonds au bénéficiaire par le biais de ses services. Les opérations à distance permettent au
payeur d’enclencher des opérations par chèque, transfert électronique de fonds ou transfert en ligne (opérations de
personne à personne). En 2018, 4,5 milliards d’opérations ont été effectuées à distance, pour une valeur approximative
de 9 billions de dollars (moyenne de 1 993 $ par opération). Ces opérations représentent 91 % de la valeur totale des
opérations au Canada, mais seulement 25 % du volume total.

Les tendances suivantes ont aussi été observées en 2018 :
             Les TEF (y compris les dépôts directs, les prélèvements automatiques et les paiements de facture en ligne
             faits à partir d’un compte de dépôt) ont encore une fois occupé une place prépondérante dans les opérations à
             distance, tant au chapitre du volume que de la valeur.
             Le recours aux chèques personnels a chuté; pour la première fois, l’utilisation par les consommateurs des
             transferts en ligne a dépassé en volume et en valeur leurs opérations par chèque. Malgré le recul du volume
             des chèques, la valeur totale des chèques est restée élevée dans l’ensemble, ayant représenté plus de 39 % de
             la valeur totale des opérations.
             Les chèques commerciaux ont constitué 70 % du volume total des chèques et 98 % de la valeur totale des
             chèques, et le volume et la valeur des chèques commerciaux ont respectivement diminué de 6 % et augmenté
             de 1 % .6
             Ce sont encore les transferts en ligne qui ont connu la plus forte croissance, soit une hausse de 52 % du volume
             et de 44 % de la valeur. Fait intéressant, les appareils mobiles sont en voie de devenir le canal de choix pour les
             transferts en ligne : 35 % des consommateurs s’en servent régulièrement pour faire des paiements.

6   Sont comptabilisées dans les opérations par chèque les grosses opérations que les institutions financières font entre elles pour accorder et rembourser des prêts à un jour, opérations qui
    gonflent dans une certaine mesure la valeur globale des chèques.

2 019 C A N A D I A N PAY M E N T M E T H O D S A N D T R E N D S                                                                                                                            3
LES PAIEMENTS D’UN
OCÉAN À L’AUTRE

Les paiements des
consommateurs et
des entreprises du
Canada – Perceptions
et utilisation
Ici, au Canada, tous ont des points de vue et des préférences uniques à
l’égard des paiements, depuis l’expérience à la caisse jusqu’à l’envoi de
fonds à un ami ou à une autre entreprise. Fait intéressant : les préférences
des consommateurs et des entreprises se recoupent parfois. Explorons
ensemble les paiements d’un océan à l’autre et découvrons où et comment
sont effectuées chaque année au pays plus de 21,1 milliards d’opérations
totalisant plus de 9,9 billions de dollars.

2 019 C A N A D I A N PAY M E N T M E T H O D S A N D T R E N D S          4

Canadiens aux points de vente
Les Canadiens continuent de délaisser l’argent comptant et les chèques au profit des transferts en ligne et des
paiements sans contact, qui ont représenté des milliards d’opérations.

                 Les cartes de débit ont supplanté                                       Paiements sans contact :
                 l’argent comptant, avec 6 milliards                                     carte de débit ou carte de
                 d’opérations (contre 4,5 milliards                                      crédit? Découvrez le mode de paiement
                 en argent comptant). Toute l’information                                le plus populaire chez les consommateurs à
                                                                                         la page 19.
                 sur cette donnée importante à la page 15.

Les Canadiens ont réalisé                                           Saviez-vous que les Ontariens et

15,7
                                                                    Britanno-Colombiens optent pour
                                                                    le paiement sans contact plus souvent
                                                                    que les autres Canadiens?

milliards                                                           Plus d’info sur ce mode de paiement à la page 19.

d’opérations au point
de vente dans des                                                                    Dans quelle province le
emplacements physiques                                                               recours aux chèques est-il
ou virtuels, pour un total de                                                        le plus fréquent, et pourquoi?
856 milliards de dollars.                                                            Réponse à la page 33.
Détails à la page 12.

                                Plus du tiers des Canadiens ont
                                utilisé une tablette, un téléphone                          Quatre
                                ou un autre appareil pour faire
                                un achat en 2018. Plus d’information
                                sur le commerce électronique à la page 20.
                                                                                            millions
                                                                                            de Canadiens sont inscrits
                                                                                            au dépôt automatique
                                                                                            des virements Interac.
Les Canadiens effectuent en moyenne                                                         Combien utilisent la
quatre opérations au moyen                                                                  fonction Demande de
d’applications d’achat chaque mois.                                                         fonds? Consultez la page 28 pour
Et vous dans tout cela? Découvrez les nouvelles applications
                                                                                            tout savoir sur les transferts électroniques,
d’achat à la page 20.
                                                                                            le mode de paiement connaissant la plus
                                                                                            forte croissance.

2 019 C A N A D I A N PAY M E N T M E T H O D S A N D T R E N D S                                                                  5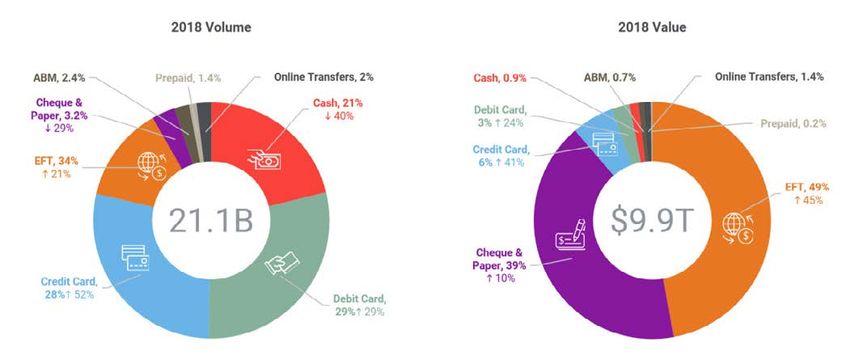
Opérations à distance chez les entreprises
Les entreprises canadiennes continuent d’offrir davantage de modes de paiement électroniques à leurs clients, les
opérations en argent comptant et par chèques devenant de moins en moins fréquentes. Les entreprises n’abandonnent
pas les effets papier aussi rapidement que les consommateurs, mais l’adoption des nouveaux modes et des nouvelles
technologies de paiement va en s’accélérant.

          Le transfert
          électronique
          de fonds (TEF)
                                                                    4,5 milliards
                                                                    d’opérations à distance de
est le mode de paiement                                             consommateurs et d’entreprises
favori des entreprises pour                                         ont eu lieu en 2018, totalisant environ
les opérations à distance                                           9 billions de dollars. Détails à la page 24.
(paiements faits par un tiers,
comme une banque), tant
sur le plan du volume que                                           De plus en plus d’entreprises utilisent
sur celui de la valeur.                                             les transferts électroniques, les
Découvrez cette tendance à la hausse                                décaissements en vrac de Virement
à la page 34.
                                                                    Interac ayant totalisé plus de 465
                                                                    millions de dollars. Plus de détails sur cette
                                                                    transition à la page 35.

 Les entreprises ont de moins en moins                                                     Saviez-vous que

                                                                                           20 %
 recours aux chèques. Est-ce que l’imagerie
 des chèques ralentit cette tendance?
 Réponse à la page 25.

                                                                                           des commerçants
                                                                                           utilisent actuellement
Les entreprises canadiennes cherchent                                                      Alipay ou WeChat Pay
des façons faciles et efficaces de traiter                                                 au Canada?
les paiements, et les fournisseurs de                                                      Pour en savoir plus sur la montée
méthodes de paiement numériques                                                            des nouvelles méthodes de paiement
                                                                                           numérique, consultez la page 35.
répondent à l’appel. Découvrez comment les entreprises
canadiennes paient à la page 34.

Les Canadiens exigent des modes de paiement plus rapides et plus pratiques, et des systèmes et services de
paiements leur sont offerts partout au pays afin de créer un environnement efficace et riche en information. Pour
en savoir plus, consultez le Rapport canadien 2019 sur les modes de paiement et les tendances des paiements.

2 019 C A N A D I A N PAY M E N T M E T H O D S A N D T R E N D S                                                           6
INTRODUCTION AND METHODOLOGY
The Canadian economy depends on the exchange of close to $210 billion worth of payments and financial
transactions on average, each business day. Payments Canada is responsible for the clearing and settlement
infrastructure, processes and rules essential to the successful completion for many of those transactions, as
the owner and operator of the Automated Clearing and Settlement System (ACSS) and the Large Value Transfer
System (LVTS).
Payments Canada is pleased to present the 2019 Canadian Payment Methods and Trends (CPMT) report. Through the
CPMT, Payments Canada is able to compile data for its member financial institutions and share knowledge with the
larger payments industry to promote a common understanding of trends in Canada.
The primary objective of the research is to inform readers about the most common domestic consumer and
business transactions, providing a holistic view of the Canadian payments market.7 To that end, the CPMT analysis
includes ACSS data, external payment service provider data, Canadian market research, and expert analysis.8
Experts and market survey research are used to fill in areas where accurate payment use data are unavailable.9
Data collected in 2018 were combined with data collected from past research to provide a multi-year observation
span to view trends. In the following sections, 2013 and 2018 data were primarily compared to understand how
payment methods and trends have evolved historically. In some cases, year-over-year comparisons (2017 to 2018)
were mentioned to provide either a broader or more narrow view of the trends being discussed. Transaction
information from the ACSS, credit and prepaid cards, cash and key payment service provider data were
also included.10
There are certain payment methods that are not included in the report. First, securities and derivatives transactions/
trades are excluded from the research.11 Next, some payment types that have not reached volumes that would
have a significant impact on the national payments market were excluded. This includes payment methods that
do not make up at least one per cent of the volume or value of either remote or point-of-sale transactions (such
as virtual currencies).12 Finally, LVTS (wire) transactions are excluded as they are low in volume and very large in
value so they obscure the value trends of the other payment types of interest.13
7 Appendix II B includes definitions on a variety of terms used throughout the paper.
8 Please see Appendix II A for details on methodology and assumptions, including consumer and business survey market research methodologies.
9 To view older reports, please see:
Canadian Payment Methods and Trends: 2018. Payments Canada Discussion Paper No.8, December 2018;
Canadian Payment Methods and Trends: 2017, Payments Canada Discussion Paper No.7, November 2017; etc.
10 This paper also includes transactions that may not specifically be used for the exchange of goods and services. For example, ABM transactions are used to obtain cash, where the cash is used for
actual payments. Both types of transactions fall within the scope of this research, as each represents an important element of the payments market in Canada. However, we recognize that this may
be seen as a form of double counting.
11 Where a payment is made to purchase investments (e.g., cheque, credit card or AFT credit), the transaction will be counted among the appropriate payment segments. When derivatives, securities,
and other assets are exchanged and no payment is required or results, the exchange of value is not included.
12 Only seven per cent of adult Canadians have used a virtual currency. Overall, the survey finds that awareness of Bitcoin has been increasing but the usage has been dropping. TSI Canadian
Consumer Payments Survey, TSI 2019.
The Bitcoin Sentiment Tracker also finds that while Bitcoin has made significant headway in awareness, a majority of consumers are not yet familiar or comfortable enough with the concept.
Available at: https://www.payments.ca/sites/default/files/bitcoin-sentiment-tracker-final.pdf
13 For analysis on the LVTS, please see Payments Canada’s Annual Report at https://www.payments.ca/sites/default/files/paymentscanada_2018annualreport_final.pdf
2 019 C A N A D I A N PAY M E N T M E T H O D S A N D T R E N D S 7THE PAYMENTS LANDSCAPE The market for payments continues to be influenced by domestic and international payments innovations, payment service providers, payment systems modernization and regulators’ efforts to reshape the payments industry for the future. Domestic and international payments providers left a clear impression on the Canadian landscape in 2018, and growth in consumer and business appetite for friction-free, and fast payments grew. Additionally, partnerships and acquisitions between fintechs and incumbent financial institutions/payment service providers continued to emerge: TD announced the purchase of Layer 6, an AI company based in Toronto; Interac Corp. partnered with Bambora to expand acceptance of Interac transactions; and PayPal acquired HyperWallet (a Vancouver-based company), to enhance its payouts capabilities for e-commerce platforms and marketplaces. The large international technology companies and payment networks active in Canada made some significant measures to bring more real-time direct payments and mobile payments to Canada. Both Mastercard Send and Visa Direct established a more solid footing through partnerships with Canadian banks to utilize their debit card networks for direct, real time payments from bank accounts to people and businesses.14 In addition, Interac Corp and PayPal announced partnerships with Mastercard Send to use the Mastercard network to reach international consumers and businesses.15 Google Pay gained momentum through additional partnerships with Canadian financial institutions to support credit and debit card transactions16, and Apple Pay contactless use grew in Canada. 2018 was an important year for Canadian payments systems Modernization. Payments Canada introduced enhancements to the retail batch payments system, the ACSS, that allow Canadian businesses to exchange direct payments (i.e, AFT debits and credits) more frequently, and to provide improved funds availability. Benefits are most substantial for companies in Western Canada.17 In addition, the migration from the exchange of paper cheques to the use of cheque images was nearly completed, with about 70 per cent of cheques exchanged electronically as images.18 Regulators were also very influential in shaping the payments environment with a focus on defining public policy objectives for future systems, payment types and participants in the payments systems. A new regulatory oversight regime is currently being planned in Canada (Retail Payments Oversight Framework), which will, among other things, regulate non-bank payment services.19 In addition, the Department of Finance completed reviews and consultations on the merits of open banking and has been exploring the best approach for Canada to enable and regulate open banking technologies.20 14 BMO is the first large Canadian FI to offer Mastercard Send. TD, Peoples Trust, and DC Bank are the first Canadian FIs to offer Visa Direct in Canada. All five major Canadian banks currently offer Visa or Mastercard debit cards for use in online commerce or international POS payments. 15 Please see: https://newsroom.mastercard.com/press-releases/mastercard-and-interac-collaborate-to-give-canadians-a-fast-simple-and-secure-way-to-send-money-globally/ 16 Please see: https://www.interac.ca/en/googlepay.html 17 Please see: https://www.payments.ca/sites/default/files/04-Aug-17/eng_publication_combined_with_watermark.pdf 18 Several Canadian financial institutions offer apps for remote deposit capture, through the digital representation of the front and back of a cheque. 19 Please see: https://www.payments.ca/about-us/news/2019-federal-budget-includes-measures-improve-canadian-payment-system 20 Ibid. 2 019 C A N A D I A N PAY M E N T M E T H O D S A N D T R E N D S 8
FINDINGS
The sections below build upon a number of different data sources, including the data provided by the ACSS as well as
other consumer and business payments data. This combination of data sources provides a holistic view of the payment
trends observed in Canada.

ACSS Data
The national retail clearing system, the ACSS, cleared and settled 7.9 billion payments worth $7.1 trillion in 2018.
The ACSS provides the cornerstone of our analysis as it provides a third of the volume data and two-thirds of the
transaction value data used in the country.
The ACSS is used by financial institutions to clear deposit account based paper and electronic payment items. The
transactions are mainly low-value, high-volume retail payments, which can be categorized into three main types:
cheque and paper, debit, and EFT.21 Figure 1, below, provides an overview of how these categories have changed
over the last five years, in volume and value terms. In 2018, electronic payments in the ACSS made up 94 per cent
of the total volume and 58 per cent of the total value. EFT payments (e.g., pre-authorized debits and direct deposits)
collectively continue to maintain the largest share of value, followed by cheques.22

Figure 1: ACSS Historical Volume and Value

                             Volumes (in millions of transactions)                                                                 Values (in billions of dollars)

     8,000                                                                                               8,000

     7,000                                                                                               7,000

     6,000                                                                                               6,000

     5,000                                                                                               5,000

     4,000                                                                                               4,000

     3,000                                                                                               3,000

     2,000                                                                                               2,000

     1,000                                                                                               1,000

           0                                                                                                   0
                      2013

                                   2014

                                               2015

                                                            2016

                                                                         2017

                                                                                      2018

                                                                                                                          2013

                                                                                                                                       2014

                                                                                                                                                   2015

                                                                                                                                                                2016

                                                                                                                                                                                2017

                                                                                                                                                                                       2018

                                                                       Cheque and Paper                      Debit               EFT

21 Debit includes ABM, POS and INTERAC® Online; EFT includes AFT debits and credits, EDI and electronic remittances.
   For more details on the ACSS please see https://www.payments.ca/about-us/our-systems-and-rules/retail-system
22 In the system statistics, there are movements of funds by large financial institutions made via cheques which may inflate the overall value we are observing with cheques.

2 019 C A N A D I A N PAY M E N T M E T H O D S A N D T R E N D S                                                                                                                             9
Overall Canadian Payment Transaction Trends
In 2018, the Canadian payments market consisted of 21.1 billion transactions, worth $9.9 trillion. Since 2013, the total
payments market has increased by an average of one per cent per year in payments volume, and an average of five
per cent per year in payments value. The average transaction size of the combined payment methods was $468 in 2018,
up 22 per cent since 2013 (Table 1).23
Table 1: All Payment Method Annual Totals
Total Volume 2013 Total Volume 2018 Total Value 2013 Total Value 2018
Payment Method in millions % in millions % $ millions % $ millions %
Cash 7,399 37% 4,467 21% 135,307 2% 92,096 1%
Debit 4,681 23% 6,050 29% 205,815 3% 255,600 3%
Credit Card 3,884 19% 5,907 28% 390,176 5% 551,497 6%
EFT 2,350 12% 2,846 13% 3,380,486 44% 4,889,627 49%
Cheques and paper 944 5% 667 3.2% 3,526,551 46% 3,891,136 39%
ABM 657 3% 499 2% 77,069 1% 68,217 1%
Prepaid Cards 175 1% 304 1% 10,476 0.1% 18,155 0.2%
Online Transfers 59 0.3% 397 2% 20,727 0.3% 134,769 1%
TOTAL 20,149 100% 21,138 100% 7,746,608 100% 9,901,098 100%
The main difference between 2013 and 2018 is the remarkable transition away from paper-based payments to electronic
payments. In total, electronic payments transactions accounted for 73 per cent of the total payments volume and 59 per
cent of the total payments value in 2018. Since 2013, electronic payments volume has captured an additional 18 per cent
of the total payments market volume.24 This can be largely attributed to the increased adoption of emerging payment
channels, including contactless, e-commerce and P2P payments, that Canadians find great convenience in. In 2016, debit
card transaction volume at the POS surpassed cash transactions. In 2018 credit card transaction growth again outpaced
debit card transaction growth. Credit cards are poised to take over the top spot for volume at the POS in the coming years.
Cash payments volume declined by over 40 per cent between 2013 and 2018, ceding nearly three billion transactions to
card payments. Since 2013, debit and credit card based transactions have been the biggest beneficiaries, each making
tremendous strides in mostly their volumes of contactless payments. The 2018 data show that debit and credit card
transactions each grew their share of the total transaction volume, expanding to 28 and 29 per cent of the total volume
respectively. Credit cards have made sharp gains in the overall transaction volume, growing by 51 per cent over five
years, and almost catching up to Canada’s volume of debit card transactions.
EFT and cheque transactions still dominate the overall transaction value in Canada. EFT and cheques combine for over
$8.8 trillion and 89 per cent of the total transaction value. The historical comparison of transaction value illustrates
Canada’s transition away from cheque and paper items to the use of direct EFT payments. In 2013, cheque and paper
items represented 46 per cent of the total value of transactions, while in 2018 the value had dropped to 39 per cent. EFT
was 49 per cent of the total transaction value in 2018, with EFT having surpassed the total value of cheque and paper
items several years ago.25
Credit cards make-up more than twice the total value of transactions of debit cards (six per cent and three per cent,
respectively), making credit cards a key focal point in the transaction environment analysis below.
23 Please see Appendix I for a historical overview of the payment method average transaction sizes.
24 If we compare 2018 to 2008, we see some significant differences. In 2008, electronic payments made up only 41 per cent (growing by 76 per cent in 2018) and 39 per cent (growing by 97 per cent in
2018) of the total volume and value shares, respectively.
25 Figures A4a and A4b in the Appendix provide tables comparing 2013 and 2018 volumes and values.
2 019 C A N A D I A N PAY M E N T M E T H O D S A N D T R E N D S 10Year-over-year 2018
The analysis also included a look at the year-over-year changes, comparing the 2018 data to 2017. This perspective
allows us to identify if trends from past years have continued, or if new trends may be emerging.
Overall, electronic payments continue to grow, and paper-based payments continue to decline.26 Prepaid card use
has outpaced debit and credit card growth but still only represents one per cent of volume and 0.2 per cent of value.
Cheque and paper volumes declined by nine per cent year-over-year, and values declined by four per cent indicating that
Canadian consumers and businesses still see value in these payment types for higher value transactions. EFT growth
has softened from 2017, but this payment type still accounts for 49 per cent of payments value. Finally, the data show
the explosive growth of online transfers, a payment category that encompasses both Interac e-Transfer transactions and
certain PayPal transactions. Even though the growth is significant, online transfers only make up a small portion of the
total volume and value shares (two per cent of the total volume share and one per cent of the total value share).
Figure 3: Volume and Value Growth Year-Over-Year (2017 – 2018)
60%
52%
50%
44%
40%
30%
20%
9% 10%
10% 7% 5%
4% 4% 4% 4%
0%
-3% -3%
-10% -6%
-9% -9% -7%
-20%
Cheque Debit ABM Prepaid EFT Credit Online Cash
and paper Cards Card Transfers
Volume YOY Value YOY
26 Electronic payments include debit cards, prepaid cards, EFT, credit cards and online transfers. Paper-based payments include cheques, paper, ABM and cash.
2 019 C A N A D I A N PAY M E N T M E T H O D S A N D T R E N D S 11THE PAYMENT ENVIRONMENTS Canadians conduct payments in two distinct payment environments that support different use cases and payment options. The point-of-sale (POS) environment includes transactions that take place in physical stores or via virtual merchant locations, including online store fronts and in-app commerce. POS payments methods include cash, prepaid, debit and credit card transactions. In 2018, POS payments accounted for almost 75 per cent of the total Canadian transaction volume, and nine per cent of the total transaction value. POS payments as a share of total Canadian payments volume and value have not changed since 2013. The average value of a POS payment in 2018 was $54. The remote environment includes cheques, EFT and online transfers (electronic account-to-account transactions). Remote transactions use financial institutions or payment service providers as intermediaries that accept payment instructions and move funds to payees through their services. In 2018, remote transactions represented 25 per cent of the total volume and 91 per cent of the total transaction value.27 A. Proximity Transactions and the Evolving POS Environment In 2018, there were a total of 15.7 billion POS payments worth over $856 billion.28 In the last five years, POS volume has increased by a total of five per cent, while POS value increased in total by almost 25 per cent. The proliferation of new entrants (e.g., Square, Dream Payments and others) offering merchants new ways to accept payments has also impacted Canadian payment behaviour at the POS. These companies have helped more merchants move away from cash and expand into e-commerce. Figure 4, below, provides a historical overview of POS volume and value. An important trend in the POS environment is the growth of electronic payments. Research demonstrates that convenience and rewards are important drivers of this trend (discussed in detail below). The payment-card-acceptance footprint is also expanding to include in-app payments and devices, such as game consoles and smart speakers, to bring payments into emerging channels where Canadians increasingly want to transact. 27 Please see Figure A3 in the Appendix 28 For the purposes of this research, the POS includes both physical and virtual merchant locations, including online and in-app transactions. 2 019 C A N A D I A N PAY M E N T M E T H O D S A N D T R E N D S 12
Figure 4: POS Historical Volume and Value

                                         POS Volume                                                                   POS Value
    7,000                                                                                 600,000

    6,000                                                                                 500,000

    5,000
                                                                                          400,000
    4,000
                                                                                          300,000
    3,000
                                                                                          200,000
    2,000

     1,000                                                                                100,000

          0                                                                                    0
                2013       2014        2015        2016        2017        2018                     2013    2014   2015     2016   2017     2018

                                                     Debit             Prepaid Cards          Credit Card      Cash

CASH

         Highlights

         • Cash transactions at the POS have been                                         • Cash transaction value declined by seven
           declining for the last decade as cash payments                                   per cent in 2018, to represent 10 per cent of
           have been replaced by debit and credit                                           the total value of POS payments in 2018 (in
           card payments.                                                                   comparison to 18 per cent of the total POS
         • In 2018, both debit and credit transaction                                       value in 2013).
           volume was higher at the POS than cash                                         • Although the use of cash at the POS is
           volume.                                                                          declining, there are many businesses
         • Contactless payments (via cards and mobile                                       that prefer cash payments to cards (e.g.,
           devices) have been responsible for replacing                                     convenience stores, transit).
           large volumes of cash transactions.                                            • 63 per cent of Canadians regularly made cash
         • Cash transaction volume declined by nine per                                     purchases from businesses in 2018, including
           cent in 2018, to represent 26 per cent of total                                  about 15 per cent of Canadians that were
           POS payments volume in 2018 (in comparison                                       heavy cash users (those that made over half
           to 44 per cent of the total POS volume in 2013).                                 of their total payments via cash).29
                                                                                          • Cash continues to support payments for the
                                                                                            underground economy.

29 Leger/Payments Canada. 2018/2019 Canadian Consumer Payments and Transactions Survey.

2 019 C A N A D I A N PAY M E N T M E T H O D S A N D T R E N D S                                                                                  13
In 2018, there were a total of 4.5 billion cash transactions, worth $92.1 billion. Cash accounted for about 26 per cent of
the total volume of all POS transactions and about 10 per cent of POS transaction value. In total, cash volume is down
by about 40 per cent, since 2013. Cash has been losing volume to card payments at the POS for the last decade as
contactless credit and debit cards, along with prepaid cards, began to take off in Canada. For the first time in 2016 at
the POS, total cash volume (POS and remote transactions combined) was surpassed by debit card transaction volume,
marking a significant milestone in Canadian payments habits. This trend continued in 2017.
Cash is still prevalent for many, as 63 per cent of consumers reported making a cash purchase from a business in the
past seven days.30 Cash use remains strong with those identified as heavy cash users31 and by those who engage in the
underground economy.32 About 15 per cent of respondents indicated that they were heavy cash users in 2018.
A wide swath of Canadians were heavy cash users in 2018, using cash for over 50 per cent of their total purchases.
Surprisingly, younger Canadians (18 to 24 years old) were well represented among the heavy cash users, constituting
nearly one out of five of the highest cash using group. While the data supports the notion that younger Canadians are
more technology oriented, they also have lower incomes and are less likely to be fully banked, resulting in a greater
reliance on cash for purchases.33
The most popular driver of cash usage for both consumers and businesses is speed and ease of use. This driver is closely
followed by the desire of consumers to spend cash and coins that are on hand. Additional important drivers of cash usage
for consumers is payment acceptance and how some people/businesses will only accept cash. This behaviour may
explain several cash intensive use scenarios , such as payments to a person, rent payments, paying for home services,
or making donations (see Figure 5).
Figure 5: Reasons for Using Cash to Pay a Person or Business34
Reasons for using cash
44%
Fast or easy 46%
Had cash or coins I wanted to spend 39%
26%
Transaction was under $15 30%
16%
18%
Person/business would only accept cash
28%
16%
Cash helps me manage my spending
10%
0% 5% 10% 15% 20% 25% 30% 35% 40% 45% 50%
Business Person
30 Leger/Payments Canada. 2018/2019 Canadian Consumer Payments and Transactions Survey.
31 Heavy users are defined as those consumers who utilize a specific payment method for more than 50% of their monthly purchases.
32 Cash is one of the main contributors to the underground economy, which was estimated to be worth $51.6 billion in 2016 (the last year data is available) by Statistics Canada. The three industries
that accounted for more than half of underground economic activity include: residential construction, retail trade and accommodation and food services. For more information on the underground
economy, please see https://www150.statcan.gc.ca/n1/daily-quotidien/181012/dq181012a-eng.htm
33 Most 18 to 24 year olds have incomes lower than $19,000 and about one in four of them do not own a debit or a credit card. They may also be contributing to the gig economy, which is resulting in
higher than average cash on hand. Many young cash users are also from more rural provinces, such as Manitoba and New Brunswick.
34 Ibid.
2 019 C A N A D I A N PAY M E N T M E T H O D S A N D T R E N D S 14DEBIT CARDS35
Highlights
• Debit transaction volume continued to • The vast majority of debit used in online
outpace cash volume at the POS. purchases and for in-app transactions
• The average debit transaction was $42. are Visa and Mastercard debit payments.
• Debit contactless made up almost 60 per • Debit transaction volumes increased by four
cent of the total volume of contactless per cent in 2018, to represent 38 per cent of
transactions and 35 per cent of the total the total POS volume in 2018 (in comparison to
value of contactless transactions. 31 per cent in 2013).
• Debit transaction values also increased by four
per cent in 2018, to represent 30 per cent of
the total POS value in 2018 (about the same as
in 2013).
Debit card use continued to outpace cash usage in 2018, where Canadians used debit cards for nearly 35 per cent
more transactions than cash. Canadians are also now using their debit cards more frequently for their everyday lower
value purchases. Contactless debit (card and mobile) is now widely viewed as a convenient and easy substitute for cash
(discussed in more detail in the contactless section). In the overall payment analysis above, we noted that overall credit
card volume almost caught up with debit card volume in 2018. However, in the POS environment debit volume maintains
a significant lead over the volume of credit cards, owing mostly to debit based contactless transactions.
Generally, debit cards are used for more lower value transactions than credit. This fact has contributed to Canadians
using debit more frequently for contactless transactions, and credit cards for larger value purchases. As such, the
average transaction size for credit cards is more than double that of debit cards – $93 and $42 respectively.36
Visa and Mastercard branded debit is thriving in e-commerce use cases. In 2018 nearly 20 per cent of e-commerce
transactions were made using a Visa or Mastercard debit payment, accounting for 15 per cent of the e-commerce
transaction value. This development has come at the expense of other debit base alternatives, including PayPal and
Interac Online.
35 Debit cards include all debit card transactions (e.g., card on file, contact and contactless (including card and mobile) payments.
36 The number one reason stated for switching a pre-authorized payment to a credit card was that the consumer wanted to collect more rewards. TSI Canadian Consumer Payments Survey, TSI 2019.
2 019 C A N A D I A N PAY M E N T M E T H O D S A N D T R E N D S 15CREDIT CARDS37
Highlights
• Credit card payments at the POS have been • Credit card transaction values increased by
growing faster than debit card payments. This five per cent in 2018, to represent 58 per cent
trend is due to mostly to credit card rewards of the total POS payment value in 2018 (in
and the growth of e-commerce in Canada, comparison to 51 per cent in 2013).
where credit cards are the preferred method • The overall average credit transaction
of payment. was $93.
• Credit cards dominate the POS transaction • Canadians spend an average of $320 per week
value, accounting for more payments value via credit card contactless.
than all other payment methods combined.
• Canadians continue to be heavy credit card
• Credit card transactions at the POS have grown users, second only to South Korea in credit
by 41 per cent since 2013. card volume per capita (see Figure 6).
• Credit cards were the second-most-popular • Canadians are also making more remote
payment type at the POS in 2018. credit card payments, opting to use their credit
• Credit card transaction volumes increased by cards for more recurring household bills
five per cent in 2018, to represent 34 per cent and expenses. This trend is also linked to the
of the total POS payment volume in 2018 (in loyalty/rewards programs offered by credit
comparison to 23 per cent in 2013). card issuers.38
Credit card POS transaction value is more than all of the other POS payment methods combined, accounting for almost
60 per cent of the total POS value. Credit cards are highly entrenched into the payments of Canadians. When looking
at the countries with the highest credit card volume per capita from the top 10 economies, the Bank for International
Settlements research finds that Canadians are global leaders in credit card usage (Figure 6).
37 Credit cards include all credit card transactions (e.g., card on file, contact and contactless (including card and mobile) payments
38 Leger/Payments Canada. 2018/2019 Canadian Consumer Payments and Transactions Survey.
2 019 C A N A D I A N PAY M E N T M E T H O D S A N D T R E N D S 16Figure 6: Annual Credit Card Volume per capita Around the World39
Credit Card Volume per Capita Around the World
South Korea 231
Canada 136
US 116
France 56
UK 54
0 50 100 150 200 250
Source: BIS (2017)
Canada’s exceptional credit card use can be traced to a number of key factors. Research reveals that the main contributing
factors are credit card rewards and the expansion of e-commerce in Canada.
Canada has very high credit card issuance, where nearly nine out 10 Canadians have a credit card. In 2018, nearly 80 per
cent of Canadians had a credit card that offers some form of reward.40 Rewards programs are a key driver for Canadians
choosing to use their credit cards; past research on the topic showed rewards were the top reason Canadians reported
for using their credit cards.41 Rewards have been a key driver in turning more Canadians into heavy credit card users, or
those that use their credit cards for more than 50 per cent of their monthly payments.
While more Canadians transact online to engage in e-commerce their payment options are often more limited than in the
physical POS. Credit cards are the most widely used payment method in e-commerce, and the reasons and implications
of this are explored in detail in the e-commerce section below.
39 Available at Bank for International Settlements (BIS) website: https://stats.bis.org/statx/toc/CPMI.html
40 The most popular type of rewards card included cashback rewards, followed by travel rewards. Leger/Payments Canada. 2018/2019 Canadian Consumer Payments and Transactions Survey.
41 2016 Canadian Methods and Trends Report, Payments Canada (2016); p. 11.
2 019 C A N A D I A N PAY M E N T M E T H O D S A N D T R E N D S 17PREPAID CARDS
Highlights
• Although prepaid cards had the highest • 80 per cent of prepaid POS purchases are
year-over-year POS growth rate in 2018 (nine made using closed-loop/store cards. The
per cent increase in volume; 10 per cent most common retailer cards are Starbucks,
increase in value), they represent a very Tim Hortons, iTunes and GooglePlay.42
small percentage of total POS transactions • Prepaid is also being lifted by e-commerce,
(two per cent of both POS volume and value). where Canadians are three times more
likely to use a prepaid payment than at the
physical POS.
In 2018, prepaid cards, either plastic or virtual, drove the growth of payment methods at the POS, growing by over nine
per cent and 10 per cent in volume and value terms, respectively. When comparing open- and closed- loop cards, closed-
loop/store cards are leading the way and make up almost 80 per cent of both the total volume and value of prepaid cards.
Nearly one in five Canadians either purchased or received at least one prepaid card per month. Young and unbanked
Canadians are the most common users of prepaid payment products.43 Interestingly, the self-employed were significantly
more likely to have purchased or received a prepaid card than those who are employed or retired.44
Prepaid payments have been buoyed by emerging e-commerce and mobile payment trends. Prepaid cards accounted for
three per cent of e-commerce payments in 2018. Canadians were three times more likely to use a prepaid payment for
e-commerce, than they were at physical POS merchant locations.45
Prepaid card use is also expanding due to mobile payments. In 2018, 80 per cent of prepaid POS purchases were made
using closed-loop/store cards, with a growing proportion being linked to the use of mobile devices and virtual prepaid
cards. About a quarter of Canadians routinely purchased virtual prepaid cards in 2018, with the most common brands
being Starbucks and Tim Hortons. These brands are associated with store branded mobile payment apps that work with
store branded prepaid payment products to provide mobile contactless payments.46
42 Leger/Payments Canada. 2018/2019 Canadian Consumer Payments and Transactions Survey.
43 Ibid.
44 Ibid.
45 The increasing use of prepaid cards online may also be linked to fraud concerns, as people do not want to use their personal cards online. A recent study finds that 70 per cent of Canadians
are more concerned about fraud today than they were five years ago. Available at:
https://www.cpacanada.ca/en/the-cpa-profession/about-cpa-canada/media-centre/2019/february/canadians-express-strong-concerns-about-fraud-cpa-canada-survey
46 Leger/Payments Canada. 2018/2019 Canadian Consumer Payments and Transactions Survey.
2 019 C A N A D I A N PAY M E N T M E T H O D S A N D T R E N D S 18CONTACTLESS PAYMENTS (VIA CARD AND MOBILE DEVICES)
Highlights
• The average weekly credit card contactless • Credit contactless users tend to be younger,
transaction spend was $320. have higher earnings, and live in British
• The average weekly debit card based Columbia and Ontario.
contactless transaction spend was $187. • Nearly 35 per cent of Canadians have used
their mobile device for contactless payments
on a regular basis in 2018.
The growth of contactless payments (card and mobile) Figure 7: Contactless Volume and Value (in millions)
at the POS continued its strong trajectory in 2018.47
A total of 4.1 billion contactless transactions worth
$129.9 billion were made, an increase of almost $140,000 4,500
4,121
30 per cent in 2018, in terms of both volume and value $129,869 4,000
$120,000
(see Figure 7) in 2018.
3,500
In 2017, for the first time, the share of debit contactless $100,000
3,000
transactions was bigger than the share of credit $80,000 2,500
contactless transactions. This trend continued into 2018, 2,089
where debit contactless made up almost 60 per cent of $60,000 $67,109 2,000
the total volume of contactless transactions. In terms of 1,500
value though, credit contactless continued to dominate, $40,000
1,000
and made up 65 per cent of the total value of contactless $20,000
transactions. In general, contactless payments are most 215 500
popularly used at grocery stores, pharmacies and gas 0 $9,660 0
stations.48 2012 2016 2018
$billions millions
Even though mobile contactless usage is growing, it has Value Volume
had a slower uptake than contactless cards.49 Concerns
about security remains the key barrier of usage, with
fewer than a third of consumers expressing their belief
that mobile payments are safe and secure. 50
47 Contactless transactions are defined as using a payment card or mobile device tap to initiate a payment through a POS reader (in physical merchant locations).
48 The average value of a contactless transaction is $47. TSI Canadian Consumer Payments Survey, TSI 2019.
49 However, in the last year, Apple Pay experienced the largest increase in penetration, from nine per cent in 2018 to 16 per cent in 2019. TSI Canadian Consumer Payments Survey, TSI 2019.
50 TSI Canadian Consumer Payments Survey, TSI 2019.
2 019 C A N A D I A N PAY M E N T M E T H O D S A N D T R E N D S 19THE E-COMMERCE ENVIRONMENT
Highlights
• Canadians feel more confident and secure • Prepaid cards are being used by younger
using credit cards for e-commerce. Canadians and those without credit or debit
• The interchange model for the Visa and cards to engage in e-commerce.
Mastercard debit network allows for a different
user experience on their debit products, and
these cards can be used to support card-on-file
transactions. This has created an opportunity
for Visa and Mastercard debit in Canada.
Interac Online acceptance remains low.
E-commerce is defined as the use of web-based store payments, enabling a speedier and more convenient
fronts and applications to procure goods (including digital payment experience. Canadians make, on average,
items) and services from businesses. E-commerce about four in-app purchases per month.54 However,
payments result from completing transactions through the majority of adult Canadians (over 50 per cent)
merchant (payee) provided online store fronts and are concerned about the security of their payment
software applications, via computers, tablets or mobile information being stored on a smartphone or tablet.55
devices. This payment channel has become increasingly
Consumers now also make in-app payments through
popular due to its convenience and ease of use. The
applications and technologies provided by Google Home,
2018 data suggest that e-commerce accounted for over
Alexa, Facebook and Instagram. More information on
$199 billion in Canada, and about 20 per cent of the total
these emerging e-commerce channels is available in
value of POS transactions.51 Overall, clothing, footwear
Featured Analysis A.
and accessories remain the most popular category for
online purchases (at over 50 per cent).52
Figure 8: Consumer e-commerce Transaction Value
Consumer e-commerce transaction value is
dominated by credit cards with two thirds of the total
value being generated on this payment method. Visa e-Commerce
or Mastercard debit cards follow with 15 per cent
Credit Card 67%
(Figure 8).53 When the proportion of prepaid and
PayPal that is linked to Visa and Mastercard credit Visa or MC Debit 15%
and debit is factored in, Visa and Mastercard payment
Interac Online 8%
products combined to account for about 90 per cent of
all of the e-commerce transaction value. PayPal 7%
Consumers are increasingly conducting e-commerce Prepaid Card 3%
transactions ‘in-app’ using their mobile devices. In
these cases, “card on file” information is leveraged for
51 Payments Canada’s e-commerce estimates differ from other published sources (e.g., StatsCan) in several notable ways. Figures for travel, accommodation, entertainment, and online transactions
originating from businesses are included.
52 TSI Canadian Consumer Payments Survey, TSI 2019.
53 Debit cards used for e-commerce use credit card rails as the cards are co-badged such that Visa and Mastercard networks are used for online and international transactions.
54 Leger/Payments Canada. 2018/2019 Canadian Consumer Payments and Transactions Survey.
55 TSI Canadian Consumer Payments Survey, TSI 2019.
2 019 C A N A D I A N PAY M E N T M E T H O D S A N D T R E N D S 20Featured Analysis A
A CLOSER LOOK AT CANADA’S
EVOLVING USE OF E-COMMERCE
Authors: Michael Tompkins and Viktoria Galociova, Payments Canada
The views expressed in this article are the personal views of the authors and do not represent the views of Payments Canada.
GLOBAL E-COMMERCE
Today, e-commerce offers exceptional convenience to consumers and businesses, enabling goods to be purchased from
all around the world. Retail e-commerce sales worldwide amounted to $2.8 trillion USD in 2018.56 The global leader in
annual online sales per capita is the UK, followed by the US. Canada ranks fourth, with $30 billion in annual online sales,
placing it among the global leaders in consumer e-commerce.57 Figure 1 illustrates five of the largest e-commerce
markets in the world.
Figure 1: Top Five Largest e-commerce Markets: Annual Online Sales Per Capita58
Annual Online Sales Per Capita
UK 1,499
US 1,044
Germany 882
Canada 821
South Korea 719
0 200 400 600 800 1,000 1,200 1,400 1,600
Featured Analysis A continues…
56 Available at: https://www.shopify.com/enterprise/global-ecommerce-statistics
57 This report is based on 2016 statistics. Available at: https://www.business.com/articles/10-of-the-largest-ecommerce-markets-in-the-world-b/
58 Available at: https://www.business.com/articles/10-of-the-largest-ecommerce-markets-in-the-world-b/
2 019 C A N A D I A N PAY M E N T M E T H O D S A N D T R E N D S 21CANADA’S E-COMMERCE
Following the global trend, an increasing share of overall Canadian purchasing is taking place through e-commerce,
as opposed to physical merchant stores or locations. More than half of Canadians (53 per cent) made at least one online
transaction per month. Canadians that use e-commerce, made an average of five e-commerce transactions worth
$340 per month in 2018.59 If business purchases are included, the total value of Canadian e-commerce was about
$199 billion in 2018.
Over the past ten years, Canadian e-commerce has changed in significant ways. However, global payment networks
(such as American Express, Mastercard and Visa) continue to be the preferred ways to pay online. Although more and
more businesses leverage the e-commerce platform, the number of payment options remains limited.
CANADA’S E-COMMERCE EVOLUTION BETWEEN 2008 AND 2018
Rewinding back to 2008, PayPal was the payment choice for Canadians for over 40 per cent of e-commerce transactions
(the vast majority of PayPal transactions were linked to credit cards). PayPal set a high standard for the online payment
experience, acting as a trusted third-party that offered consumers security when dealing with unknown online merchants,
and the convenience of storing payment and shipping information. On the acceptance side, PayPal was widely deployed
by online merchants.
In 2018, the e-commerce landscape in Canada has evolved. Consumers are increasingly purchasing goods and services
using a mobile device, in-app payments have removed payment friction by storing payment information, and merchants
have acquired more options than in the past.
E-COMMERCE SHIFTING FROM COMPUTERS TO MOBILE AND OTHER HOUSEHOLD DEVICES
Around 2010, Canadians began embracing mobile devices for e-commerce payments. By 2018, 36 per cent of e-commerce
transactions were initiated using a mobile device or a tablet.60 Canadians’ early comfort with mobile devices made
in-app purchases and the use of other home devices, such as video game platforms, almost natural. As these new
channels emerged, new processes for payments were established. Canada followed the US in using technology giants,
such as Apple and Google, to store payment card and shipping information to enable payments and commerce, much
like PayPal did for a number of years previously. This trend gave way to a more liberal use of “card-on-file” payments and
payment tokenization based on international card networks card numbers.
Finally, in the past five years or so, online providers of goods and services moved away from web pages to the development
of device applications that allowed users to download an entire shopping service, or entertainment experience, accessible
by a single tap of their finger.61 These applications have invited Canadians to store their payment information to enable
highly convenient transactions directly between users and the online service application (e.g., Uber, SkipTheDishes,
Amazon, Walmart apps). As these applications quickly came to the market, international card networks were ready to
facilitate the payment volume. International networks were well positioned to translate their previous existing processes
for e-commerce and PayPal to the myriad of new application services that required payments.
Other areas that continue to emerge in the online space include in-app, game console and smart payments. In 2018,
18 per cent of Canadians made an in-app purchase and about nine per cent of Canadians used a game console to make
a payment.62 Smart payments (payments via Google Home, Facebook etc.) are also emerging as new forms of in-app
payments in Canada. In-app payments are becoming more and more popular, revolutionizing the traditional retail and gig
economy through applications such as Uber and Airbnb.
Featured Analysis A continues…
59 Leger/Payments Canada. 2018/2019 Canadian Consumer Payments and Transactions Survey.
60 Leger/Payments Canada. 2018/2019 Canadian Consumer Payments and Transactions Survey.
61 Atlantic Canadians are significantly less likely than any other province to have made a purchase from a web page in the last month. Leger/Payments Canada. 2018/2019 Canadian Consumer
Payments and Transactions Survey.
62 Ibid.
2 019 C A N A D I A N PAY M E N T M E T H O D S A N D T R E N D S 22Vous pouvez aussi lire