ETAT DES ENERGIES EN EUROPE - 7e bilan EurObser'ER Edition 2007

La page est créée Amandine Guillot
 
CONTINUER À LIRE
ETAT DES ENERGIES EN EUROPE - 7e bilan EurObser'ER Edition 2007
7ee bilan EurObserv’ER
7 bilan EurObser’ER
ETAT
DES ENERGIES
RENOUVELABLES
EN EUROPE
       Edition           2007
         7e report EurObserv’ER
         State of Renewable
         Energies in Europe
ETAT DES ENERGIES EN EUROPE - 7e bilan EurObser'ER Edition 2007
Baromètre réalisé par Observ’ER dans le cadre du projet “EurObserv’ER”
               regroupant Observ’ER, Eurec Agency, Erec, Eufores, Institut Jozef Stefan, avec
               la participation d’IEO/EC BREC.
               Barometer prepared by Observ’ER in the scope of “EurObserv’ER” Project which
               groups together Observ’ER, Eurec Agency, Erec, Eufores, Institut Jozef Stefan,
               with the participation of IEO/EC BREC.
EurObserv’ER

                                                                   Le contenu de cette publication
                                                                   n’engage que la responsabilité
                                                                   de son auteur et ne représente
                                                                   pas l’opinion de la
                                                                   Communauté européenne. La
                                                                   Commission européenne n’est
                                                                   pas responsable de l’usage qui
                                                                   pourrait être fait des
                                                                   informations qui y figurent.
               Cette action bénéficie du soutien financier         The sole responsibility for the
               de l’Ademe et de la DG Tren (programme              content of this publication lies
               Énergie Intelligente – Europe).
               This action benefits from the Ademe                 with the authors. It does not
               and DG Tren (Intelligent Energy – Europe            represent the opinion of the
               Programme) financial support.                       European Communities. The
                                                                   European Commission is not
                                                                   responsible for any use that
                                                                   may be made of the
                                                                   information contained therein.
ETAT DES ENERGIES EN EUROPE - 7e bilan EurObser'ER Edition 2007
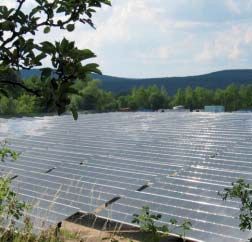
02   Avant-propos, par Jean-Louis Bal et William Gillett
     Forewords, by Jean-Louis Bal and William Gillett

04   Soyons prêts !
     par Alain Liébard, Président d’Observ’ER
     Be prepared !
     By Alain Liébard, President of Observ’ER

06   Le 7e baromètre bilan
     7th annual assessment barometer

08   Exploiter le souffle du vent
     Using the blowing wind

14   Convertir la lumière en électricité
     Changing light into electricity

                                                                                                                                EurObserv’ER
22   Capter la chaleur du soleil
     Harnessing the sun’s heat

28   Valoriser la force motrice des cours d’eau
     Valorising the motive force of rivers

34   Puiser la chaleur du sous-sol
     Drawing heat frome underground

44   Méthaniser la biomasse
     Mehanisation of biomass

50   Transformer la biomasse en carburant
     Transforming biomass in fuel

56   Valoriser la biomasse solide et les déchets renouvelables
     Valorising solid biomass and renewable waste

62   La renaissance de l’héliothermodynamique
     Revival of concentrating solar power

66   L’émergence des thalasso-énergies
     Emerging marine energies

70   Des objectifs 2010 difficiles à atteindre
     2010 objectives hard to reach

77   Les baromètres d’EurObserv’ER en ligne et renseignements
     EurObserv’ER barometers on line and Informations

                                           S t a t e o f R e n e w a b l e E n e rg i e s i n E u r o p e - 2 0 0 7 E d i t i o n   1
ETAT DES ENERGIES EN EUROPE - 7e bilan EurObser'ER Edition 2007
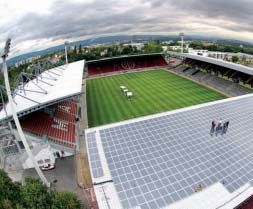
JEAN-LOUIS BAL, Directeur des énergies renouvelables,
                                                          des réseaux et des marchés énergétiques [Ademe]

                                                         «          Le Baromètre européen
                                                                    des énergies renouve-
                                                           lables portant sur l’année 2006
                                                           confirme les tendances déjà
                                                                                                       pays européens et, globale-
                                                                                                       ment, ils ne sont pas accompa-
                                                                                                       gnés d’un réel effort d’écono-
                                                                                                       mie d’énergie. Néanmoins, la
                                                                                                                                        notamment l’éolien et la bio-
                                                                                                                                        masse, ont plus que compensé
                                                                                                                                        le déclin de l’hydraulique, dû
                                                                                                                                        aux effets d’une mauvaise plu-
                                                           perçues les années précéden-                progression de près d’un demi    viométrie. Si la progression avait
                                                           tes : les efforts de développe-             pour cent durant l’année 2006    été de ce niveau dès 1997, date
                                                           ment ne sont suffisants que                 est remarquable. Les nouvelles   de la publication du Livre blanc,
                                                           dans un nombre restreint de                 formes d’énergie renouvelable,   l’objectif de 12 % en 2010 aurait
                                                                                                                                        pu être atteint.
                                                                                                                                        Pour sa part, la France, lors de
                             WILLIAM GILLETT, Responsable de l'Unité de l'énergie                                                       la première phase du Grenelle
                             renouvelable, Agence exécutive pour la compétitivité et                                                    de l’environnement, a adopté
                                                                                                                                        les nouveaux objectifs euro-
                             l'innovation [Commission européenne].
                                                                                                                                        péens à l’horizon 2020. Les ré-

                            «         L’élément important de l'année 2007 en Europe en matière
                                      d’énergies renouvelables a été indubitablement l'engagement pris
                             par le Conseil européen de parvenir à ce que la consommation finale
                             d'énergie dans l'UE soit assurée à 20 % par des sources d'énergies
                                                                                                                                        sultats français encourageants,
                                                                                                                                        que le Baromètre européen
                                                                                                                                        démontre depuis 2005 et qui
                                                                                                                                        seront certainement confirmés
EurObserv’ER

                             renouvelables d'ici 2020. Autres engagements d’ici 2020 : réduire de                                       pour 2007, devront être encore
                             20 % les émissions de CO2, porter à 10 % la part de biocarburants dans                                     amplifiés pour atteindre cet
                             les carburants utilisés dans les transports et améliorer l’efficacité                                      objectif de 20 millions de ton-
                             énergétique de 20 %.                                                                                       nes équivalent pétrole supplé-
                             Sur la base de ces engagements, la Commission européenne soumettra une                                     mentaires d’origine renouvela-
                             proposition de nouvelle législation en janvier 2008. Cette nouvelle législation                            ble en 2020. Les réglementations
                             sera fondée sur la feuille de route des énergies renouvelables (2007) et le plan                           diverses et les instruments inci-
                             d'action pour le rendement énergétique (2006).                                                             tatifs devront être évalués et
                             En 2007, la Commission européenne a lancé son deuxième programme                                           mis à la hauteur de l’ambition
                             Énergie intelligente-Europe (IEE-II) avec un budget de 730 millions d’euros                                des objectifs.
                             sur 7 ans (2006-2013), qui est le double du budget annuel de son                                           La réduction des consommations
                             prédécesseur. IEE-II soutient des actions dans toute l'UE, visant à supprimer                              d’énergie sera, quant à elle, une
                             les obstacles qui inhibent la croissance des marchés des énergies                                          véritable révolution culturelle :
                             renouvelables. Il soutient des projets qui fournissent des informations aux                                pour y parvenir, notre système
                             décideurs dans l'UE, aux administrations nationales et locales, aux                                        énergétique devra faire l’objet
                             investisseurs ainsi qu'aux entreprises.                                                                    d’une approche par la demande
                             Cette publication EurObserv’ER a été réalisée avec le soutien du programme                                 et, non plus, par l’offre. Analy-
                             IEE-II en vue de fournir des informations actualisées sur les marchés des                                  ser la demande à satisfaire et
                             énergies renouvelables plus vite que ne le permettent les statistiques officielles.                        construire l’offre d’énergie en
                             Néanmoins, des comparaisons entre les données des années précédentes                                       fonction de cette analyse et des
                             ont montré que les données d’EurObserv’ER sont bien corrélées avec les                                     contraintes environnementales
                             statistiques officielles. Ce nouveau rapport d’EurObserv’ER est publié à un                                peut apparaître comme une évi-
                             moment où le monde entier recherche des solutions aux défis du changement                                  dence élémentaire, mais c’est
                             climatique, de la sécurité de l'approvisionnement en énergie et de la                                      exactement l’inverse de ce qui
                             compétitivité. La croissance des marchés des énergies renouvelables en                                     s’est toujours fait. Le défi qui
                             Europe contribuera largement à relever ces défis. Les décideurs à tous les                                 nous attend lors de la décen-
                             niveaux, notamment les administrations publiques, les PME et les                                           nie à venir est considérable et
                             particuliers, devraient constater les progrès réalisés, les obstacles restant à                            exaltant.
                             supprimer et les nouvelles opportunités professionnelles qui s'ouvrent dans                                Réussir ce pari sera déterminant
                             le secteur des énergies renouvelables. Ces questions sont clairement                                       dans la perspective de maîtriser
                             exposées dans cette publication. »                                                                         le changement climatique. »

2     É t a t d e s é n e rg i e s r e n o u v e l a b l e s e n E u r o p e - É d i t i o n 2 0 0 7
ETAT DES ENERGIES EN EUROPE - 7e bilan EurObser'ER Edition 2007
JEAN-LOUIS BAL, Director, Renewable Energies
                                             and Energy Networks and Markets [ADEME]

                                            «         The European Renewable Energies Barometer for the year
                                                      2006 confirms the trends that had already been detected
                                             during the previous years: that the efforts being made for
                                             development are only sufficient in a limited number of European
                                             countries and that, overall, they are not accompanied by any real
                                             effort to conserve energy. Nevertheless, the nearly one-half percent
                                             growth rate observed in 2006 is remarkable. New renewable energy
                                             forms, in particular wind power and biomass, have more than
WILLIAM GILLETT,                             compensated for the decline in hydraulic power due to the effects of
Head of Unit for Renewable
                                             insufficient rainfall. If the growth rate had been at this same level since
Energy, Executive Agency                     1997, the year that White Paper was published, we could have been
for Competitiveness and                      able to reach the objective of 12% in 2010.
Innovation [European                         For its part, during the first phase of the "Grenelle de
Commission].                                 l’environnement", France adopted the new European objectives for
                                             the year 2020. The encouraging French results, that have been shown

«        The renewable energy high-
         light of the year for Europe
in 2007 was undoubtedly the com-
mitment by the European Council
                                             in the European Barometer since 2005 and which shall certainly be
                                             confirmed for 2007, should be amplified even more to reach this
                                             objective of an additional 20 million tons oil equivalent (toe) of
                                             renewable origin in 2020. The different regulations and incentive

                                                                                                                                                                                EurObserv’ER
to delivering 20% of EU final ener-          instruments shall have to be evaluated and brought up to a level that
gy consumption from renewable                is equal to the ambitions of the objectives.
energy sources by 2020. This was             The reduction of energy consumptions is going to signify a real cultural
complemented by commitments to               revolution. In order to succeed in this, our energy system shall have to
a 20% reduction in CO2 emissions,            be the object of a "demand" approach and no longer be a question of
10% of transport fuels from biofu-           energy offer and supply. Analysing the demand to be met and
els, and a 20% improvement in ener-          constructing the energy offer as a function of this analysis and of
gy efficiency by 2020.                       environmental constraints can appear to be an obvious fact, but this is
Based on these commitments, the              exactly the opposite of that which has always been done up until now.
European Commission will bring               The challenge awaiting us in the decade to come is a considerable and
forward a proposal for a new leg-            exciting one. Succeeding in this shall be a determining factor in the
islative package in January 2008.            perspective of controlling climate change. »
The new package will build on the
Renewable Energy Roadmap (2007)
and the energy efficiency action
plan (2006).                            This EurObservER publication has            competitiveness. Growth in the
In 2007, the European Commission        been produced with support from             renewable energy markets of Europe
also launched its second Intelligent    the IEE –II programme with the aim          will make important contributions
Energy-Europe (IEE - II) program        of providing up-to-date information         towards meeting these challenges.
with a budget of 730M€ over 7           on RE markets more quickly than is          Decision makers at all levels, includ-
years (2006-2013), which is twice       possible with official statistics.          ing public administrations, small and
the annual budget of its predeces-      Nevertheless, comparisons between           medium enterprises, and individual
sor. IEE-II supports actions across     the data for previous years have            citizens, should take note of the
the EU aiming to remove barriers,       shown the EurObservER data to cor-          progress which is being achieved,
which inhibit the growth of renew-      relate well with the official statistics.   the barriers which remain to be
able energy markets. It supports        This new report from EurObserv’ER           removed and the new business
projects, which provide information     is being published at a time when           opportunities which are opening up
for decision makers in EU, national     the whole world is looking for solu-        in the renewable energy sector. These
and local administrations, investors,   tions to the challenges of climate          issues are clearly illustrated in this
and businesses.                         change, energy supply security and          publication. »

                                                                                           S t a t e o f R e n e w a b l e E n e rg i e s i n E u r o p e - 2 0 0 7 E d i t i o n   3
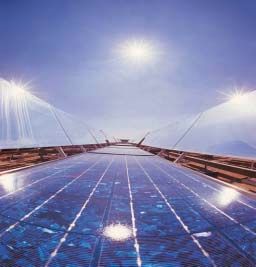
ETAT DES ENERGIES EN EUROPE - 7e bilan EurObser'ER Edition 2007
SOYONS PRÊTS !
                             Alain Liébard, Président d’Observ’ER

                                        augmentation actuelle du prix de l’énergie est

                          L’            particulièrement problématique. Cette hausse,
                                        qui se répercute sur les prix des marchandises,
EurObserv’ER

                                        a relancé les tendances inflationnistes et a
                             affecté le pouvoir d’achat des ménages et la compétiti-
                             vité des entreprises. Cette tendance est pourtant loin
                             d’être anodine et il serait illusoire de penser qu’elle n’est
                             que temporaire. En effet, l’augmentation de la demande
                             mondiale en énergie crée des tensions croissantes sur le
                             marché. La marge de manœuvre entre production et
                             consommation est toujours plus ténue car les pays pro-                    teurs énergies renouvelables les industries capables d’as-
                             ducteurs rechignent de plus en plus à augmenter leur                      surer sereinement cette transition énergétique.
                             niveau de production afin de ménager leurs réserves.                      À cet égard, le projet d’une directive globale (électricité,
                             Dans ce cadre, une rupture imprévue des approvision-                      chaleur et carburant) attendu au début de l’année 2008
                             nements (conflits d’intérêts) ou une augmentation sou-                    rendant contraignant une consommation d’énergie
                             daine de la demande peut entraîner une augmentation                       renouvelable de 20 % à l’horizon 2020 est non seule-
                             rapide et durable des prix. Les conséquences d’une telle                  ment réaliste mais surtout responsable. Les efforts actuels
                             situation, si elle n’est pas anticipée, pourraient déstabi-               sont, dans la grande majorité des pays, encore insuffi-
                             liser nos économies, et ce, bien avant que les réserves                   sants. Trois ans avant la date de clôture des premières
                             soient épuisées.                                                          échéances européennes, il est plus que temps de se met-
                             Le renchérissement du prix de l’énergie va favoriser le                   tre en ordre de bataille.
                             développement des énergies renouvelables qui, par ail-                    Le baromètre EurObserv’ER poursuivra sa mission de
                             leurs, ne cessent d’augmenter leur productivité. Encore                   suivi des progrès des États membres dans chacun des
                             faut-il avoir préalablement mis en place dans les sec-                    secteurs renouvelables. Surveillance des objectifs 2010
                                                                                                       et surveillance des nouveaux objectifs 2020 lorsque ceux-
                                                                                                       ci auront été signés.

               « Lepoursuivra
                     baromètre EurObserv’ER
                              sa mission
                                                                                                       Les téléchargements toujours plus nombreux des baro-
                                                                                                       mètres (56 754 en 2006 et près de 82 000 en 2007)
                                                                                                       montrent l’intérêt croissant d’instruments fiables et
                                                                                                       clairs. Afin de répondre aux besoins de suivi de plus
                             de suivi des progrès des États                                            en plus exhaustifs des secteurs renouvelables, Eur-
                             membres dans chacun des                                                   Observ’ER intégrera fin 2008 des indicateurs socio-
                                                                                                       économiques, qui illustreront les impacts positifs de
                             secteurs renouvelables. »                                                 leur développement.

4     É t a t d e s é n e rg i e s r e n o u v e l a b l e s e n E u r o p e - É d i t i o n 2 0 0 7
Be prepared !
                    Alain Liébard, President of Observ’ER

                               he current increase in the price of energy is particularly problematic. This

                   T           rise, which is passed on to the prices of goods, has launched inflationary
                               trends once again and has affected household purchasing power and busi-
                               ness competitiveness. This trend is, however, far from being insignificant
                    and it would be unrealistic to think that it is only a temporary one. The increase in

                                                                                                                                                                    EurObserv’ER
                    worldwide demand for energy has created ever greater market tensions. The room
                    for manoeuvre between production and consumption is becoming smaller and small-
                    er because producer countries are more and more reluctant to increase produc-
                    tion levels to carefully use their deposits. In this framework, an unexpected rupture
                    in supplies (conflicts of interest) or a sudden increase in demand could lead to a rap-
                    id and durable increase in prices. The consequences of a situation like this, if it
                    has not been anticipated beforehand, could destabilise our economises, and this,
                                                      well before deposits have run out.

« The EurObserv’ER Barometer
  is going to continue its mission
                                                      The increase in the price of energy is going to favour
                                                      development of renewable energies, which, more-
                                                      over, have been constantly increasing their produc-
                                                      tivity. While keeping in mind that before this can
   of following the progress made                     succeed, industries shall have to be established in
   by the member States in each                       the renewable energy sectors that will be capable
                                                      of calmly ensuring this energy transition.
   of the renewable sectors. »                        In this respect, the project of a global directive (elec-
                                                      tricity, heat and fuel) expected at the beginning of
                    2008 making a 20% renewable energy consumption by the year 2020 a restric-
                    tive measure is not only realistic but above all an act of responsibility. Current efforts
                    still continue to be insufficient in the great majority of countries. Three years before
                    the closing date of the first European deadlines, it's more than time to draw up the
                    battle lines.
                    The EurObserv’ER Barometer is going to continue its mission of following the progress
                    made by the member States in each of the renewable sectors. Monitoring the 2010
                    objectives and monitoring the new 2020 objectives once these have been signed.
                    The ever greater number of barometer internet downloads (56 754 in 2006 and
                    nearly 82 000 in 2007) shows the growing interest of reliable and clear instruments.
                    In order to meet the needs of more and more exhaustive renewable sector moni-
                    toring, EurObserv’ER is going to integrate socio-economic indicators illustrating the
                    positive impacts of their development at the end of 2008.

                                                                               S t a t e o f R e n e w a b l e E n e rg i e s i n E u r o p e - 2 0 0 7 E d i t i o n   5
7E BAROMÈTRE BILAN
EurObserv’ER

                                       epuis plus de neuf ans, EurObserv’ER collecte des données sur les sources d’énergies

                          D            renouvelables de l’Union européenne afin de décrire, dans des baromètres théma-
                                       tiques, l’état et la dynamique des filières. Le présent bilan constitue une synthèse des
                                       travaux publiés en 2007 (Systèmes Solaires, le Journal des Énergies Renouvelables
                             n° 177 au n° 182), actualisée et complétée. Il offre un tour d’horizon complet des huit filiè-
                             res renouvelables. Leurs performances sont comparées aux objectifs du Livre blanc de la Com-
                             mission européenne et de son Plan d’action biomasse. Enfin, deux notes de synthèse sur deux
                             filières en devenir, l’héliothermodynamique et l’énergie marine, viennent compléter cette étude.

                                                                                                                 o             dologique                                               nnent,
                                                                                                       Note méth                                        ba  ro m è tr e bilan repre
                                                                                                                                       posent ce                           s actuels
                                                                                                                      ux qui com s, les chiffres les plu ecteurs
                                                                                                       Les tablea                     liè re                         ant les s
                                                                                                                      une des fi                     es concern                  ont-elles é
                                                                                                                                                                                                 té
                                                                                                       pour chac                          d o n  n é
                                                                                                            p on ib le  s . Ainsi, le   s
                                                                                                                                                    a z e t  bio carburants           s
                                                                                                        dis                              e, bio   g                          ans   le
                                                                                                                          tovoltaïqu                           publiées d
                                                                                                        éolien, pho par rapport à celles                             re  m oitié de l’ann
                                                                                                                                                                                             ée
                                                                                                                        s é es                               re m iè
                                                                                                         réactu    a li                      es de la     p                     que, qu ’ai n
                                                                                                                   è  tr e s  thématiqu lière petite hydrauli                                t été
                                                                                                          baro  m                          e la fi                            n 2007, on
                                                                                                            0 0 7. L  e s  données d mètre thématique e                              tr es  fi lières,
                                                                                                          2
                                                                                                                        l’o b je t d ’un baro               d ition . P our les au
                                                                                                           pas fait                          résente é                            mètres
                                                                                                                             s pour la p                          es des baro t les
                                                                                                           actualisée ont identiques à cell                                         n
                                                                                                                             es s                                      nce in eclu
                                                                                                            les donné                     ch if fr es  pour la Fra
                                                                                                                              es. Les
                                                                                                             thématiqu                           -mer.
                                                                                                                         e m  e nts d’outre
                                                                                                              départ

6     É t a t d e s é n e rg i e s r e n o u v e l a b l e s e n E u r o p e - É d i t i o n 2 0 0 7
g              y Note
                                       Methodolo                                                                arometer

                                                                                                                                                                                         EurObserv’ER
                                                                                          l a s  sessment b
                                                                            is an   n u a                      ach of the
                                                b le s m   aking up th ures available for e                               wind
                                       The   ta                        ate fig                               erning the
                                         s e  th e  m  ost up-to-d              w a y, th  e  data conc            h a s be en
                                       u                        rs. In this                           ls sectors
                                                   nt  se  c to                         d   bio  fu e
                                        differe                            iogas an                    blished in
                                                                                                                    the
                                                          tovoltaic, b                figures pu                       Data for
                                        power, pho                     c t  to  th e                         f 20 0 7.
                                                 te d  w  ith respe                    th  e  fi rs t half o              bject of
                                         up  d  a
                                                         b  a ro m e ters duri     ng
                                                                                                 h a d n o t been th o e
                                          thematic                                         ich                         for the
                                                                         sector, wh                      n updated
                                                           hydraulic                    7, has bee                      identical to
                                           the small                         r in  2 0 0                         ta is
                                                       a tic  b aromete                      e c  to rs, the da
                                            a th  e m                           e oth  e r  s                     for France
                                               re se n t  e d ition. For th meters. The figures
                                            p                                   aro
                                                               thematic b                         artments.
                                             that of the             n ch   o  ve rseas dep
                                                              e Fre
                                              include th

7th annual
assessment barometer
       or over nine years now, EurObserv’ER has been collecting data on European Union

F      renewable energy sources in order to describe, in thematic barometers, the state and
       dynamism of the different renewable sectors. The present annual assessment is a syn-
       thesis of the work published in 2007 (Systèmes Solaires, le Journal des Énergies Renou-
velables N° 177 to N° 182), after having been first updated and completed. It provides a
complete survey of the eight renewable sectors. Their performances are compared with the
objectives of the European Commission White Paper and its Biomass Action Plan. Finally, two
synthesis notes on two constantly evolving sectors, heliothermodynamic energy and marine
energy, complete this study.

                                                                                                    S t a t e o f R e n e w a b l e E n e rg i e s i n E u r o p e - 2 0 0 7 E d i t i o n   7
EXPLOITER LE SOUFFLE DU VENT
EurObserv’ER - Baromètre éolien

                                               année 2006 aura été                                               production d’électricité éolienne   2,9 milliards d’euros. L’industrie

                                     L’        marquée par quelques
                                               bonnes surprises, com-
                                               me le retour de la crois-
                                       sance du marché allemand, le
                                       décollage attendu du marché
                                                                                                                 a augmenté en conséquence et
                                                                                                                 a atteint 81,5 TWh soit 11,6
                                                                                                                 TWh de plus qu’en 2005.
                                                                                                                 Après trois années de baisse, le
                                                                                                                 marché allemand est de nou-
                                                                                                                                                     compte de plus en plus sur le
                                                                                                                                                     marché du remplacement des
                                                                                                                                                     éoliennes par de plus puissan-
                                                                                                                                                     tes “le repowering“ (+130,7
                                                                                                                                                     MW en 2006) et, surtout, sur
                                       français, la confirmation de la                                           veau en croissance avec, selon      le marché de l’offshore pour
                                       bonne tenue du marché britan-                                             le BWE (Association allemande       continuer à développer son
                                       nique et de son marché off-                                               de l’énergie éolienne), 2 233,1     industrie. Les conditions
                                       shore, ainsi que la confirmation                                          MW installés en 2006, soit          d’achat de l’électricité éolienne
                                       de la spectaculaire progression                                           425 MW de plus qu’en 2005,          n’ont pas été modifiées durant
                                       du marché portugais. La puis-                                             portant la puissance totale du      l’année 2006 ce qui a permis
                                       sance éolienne en Europe a                                                parc allemand à 20 621,9 MW         de maintenir la confiance des
                                       augmenté de 7 287,3 MW (ins-                                              (26,2 MW ayant été mis hors         investisseurs.
                                       tallations mises hors service                                             service en 2006). Cette puis-       L’Espagne est restée en 2006 le
                                       déduites) portant la puissance                                            sance supplémentaire corres-        deuxième marché de l’Union
                                       de son parc à 48 009,8 MW. La                                             pond à un investissement de         européenne avec 1 587,2 MW
                                                                                                                                                     installés portant la puissance
                                                                                                                                                     cumulée du parc à 11 615,1
                                                                                                                                                     MW. L’APPA (Association des
                                                                                                                                                     producteurs d’énergies renou-
                                                                                                                                                     velables) et l’AEE (Association
                                                                                                                                                     espagnole de l’énergie éolienne)
                                                                                                                                                     estiment cependant que le
                                                                                                                                                     rythme de progression est insuf-
                                                                                                                                                     fisant pour atteindre l’objectif
                                                                                                                                                     fixé par le Plan énergies renou-
                                                                                                                                                     velables 2005-2010 qui est de
                                                                                                                                                     20 155 MW au 31 décembre
                                                                                                                                                     2010. Cette situation est d’au-
                                                                                                                                                     tant plus préoccupante selon le
                                                                                                                                                     secteur que le gouvernement a
                                                                                                                                                     décidé de modifier le cadre
                                                                                                                                         Iberdrola

8               É t a t d e s é n e rg i e s r e n o u v e l a b l e s e n E u r o p e - É d i t i o n 2 0 0 7
Repower

                                                                                                                                                                     EurObserv’ER - Wind power barometer
Using the blowing wind
          ear 2006 was marked        than 2005), raising Germany’s       estimate, however, that the rate

Y         by a few nice surprises
          such as the German
          market’s return to
growth, the expected take-off
of the French market, the con-
                                     total installed capacity to
                                     20 621.9 MW (including a 26,2
                                     MW decommissioning). This
                                     new capacity in turn represents
                                     an investment of 2.9 billion. The
                                                                         of progress is not sufficient to
                                                                         reach the objective set by the
                                                                         Renewable Energies Plan, which
                                                                         is 20 155 MW for 31 December
                                                                         2010. This situation is all the
firmation of the good condition      wind energy sector is counting      more worrying according to the
of the British market and of its     more and more on the repower-       sectors seeing that the Spanish
offshore market, as well as the      ing market (the replacement of      government has decided to
confirmation of the spectacular      existing wind turbines by more      modify the legislative frame-
progress made in the Portuguese      powerful ones) (+ 130.7 MW in       work governing renewable
market. Wind power capacity in       2006) and above all on the off-     energies. In the Spanish system
Europe increased by 7 287.3          shore market to continue indus-     established by Royal Decree in
MW (with installations out of        trial development. Wind power       2004, wind power electricity
service having been deducted),       origin electricity purchase con-    producers can choose to opt for
bringing total EU installed capac-   ditions weren’t modified in         either a classical feed-in tariff or
ity up to 48 009.8 MW. Wind          2006, thus conserving investor      sell their electricity at market
power electricity production in-     confidence.                         price increased by a subsidy set
creased accordingly and reached      Spain continued to be the sec-      each year by the government.
81.5 TWh, i.e. 11.6 TWh more         ond biggest European Union          The continuous increase in the
than in 2005.                        market in 2006 with an addi-        price of electricity, recorded
According to the BWE (German         tional 1 587.2 MW installed,        since 2004, makes the market
Wind Power Association), the         bringing total installed capacity   system much more advanta-
German market is once again          up to 11 615.1 MW. The APPA         geous. So much so that the gov-
growing after a three-year peri-     (Renewable Energy Producers         ernment now wants to establish
od of decline, with 2 233.1 MW       Association) and the AEE (Span-
installed in 2006 (425 MW more       ish Wind Power Association)

                                                                                S t a t e o f R e n e w a b l e E n e rg i e s i n E u r o p e - 2 0 0 7 E d i t i o n           9
contre 453 MW installés l’année       Au Royaume-Uni, le BERR
                                                                                                                            précédente, portant la puissance      (Department for Business, Enter-
                                                                                                                            du parc à 2 123,4 MW (11,9            prise & Regulatory Reform)
                                                                                                                            MW ayant été mis hors service         confirme la montée en puissance
                                                                                                                            en 2006). Cette diminution ne         de l’éolien avec 389,5 MW sup-
                                                                                                                            devrait être que temporaire.          plémentaires dont les 90 MW du
                                                                                                                            Selon l’ANEV (Association natio-      parc offshore de Barrow (30
                                                                                                                            nale de l’énergie du vent), la        aérogénérateurs Vestas V90 de
                                                                                                                            puissance du parc italien devrait     3 MW). La puissance cumulée
                                               législatif régissant les énergies                                            atteindre 9 500 MW en 2012 si         éolienne du Royaume-Uni s’éta-
                                               renouvelables. Dans le système                                               le gouvernement veut se donner        blit donc à 1 954,5 MW dont
                                               espagnol mis en place par décret                                             les moyens d’atteindre l’objectif     303,8 MW offshore.
                                               royal en 2004, les producteurs                                               qu’il s’est fixé à partir de cette    Avec 894,4 MW supplémentai-
EurObserv’ER - Baromètre éolien

                                               d’électricité éolienne peuvent                                               date : 25 % de l’électricité d’ori-   res, la France est devenue en
                                               choisir d’opter pour un système                                              gine renouvelable.                    2006 le troisième marché de
                                               classique de tarif d’achat ou ven-                                           Dans le système italien, les pro-     l’Union européenne, devant le
                                               dre leur électricité au prix du                                              ducteurs et les importateurs ont      Royaume-Uni. Selon EDF, la puis-
                                               marché augmentée d’une prime                                                 recours aux certificats verts pour    sance des installations éoliennes
                                               fixée chaque année par l’État.                                               démontrer qu’ils ont bien rem-        en obligation d’achat en France
                                               L’augmentation continue du prix                                              pli leur obligation légale de         métropolitaine et en Corse est de
                                               de l’électricité enregistrée depuis                                          fournir un pourcentage d’élec-        1 388 MW, plus une puissance
                                               2004 rend beaucoup plus avan-                                                tricité d’origine renouvelable        de l’ordre de 65 MW dans les
                                               tageux le système de marché. Si                                              (2,7 % en 2006). Les compa-           départements et territoires d’ou-
                                               bien que le gouvernement veut                                                gnies qui n’atteignent pas leurs      tre-mer, soit un total pour la
                                               désormais cadrer et limiter l’im-                                            objectifs peuvent acheter des         France entière de 1 453 MW. Ce
                                               portance de la prime qui s’ajoute                                            certificats à celles qui en ont       chiffre ne prend pas en compte
                                               au prix du marché. Il veut la pla-                                           produit en excès. Le prix             les parcs livrés aux exploitants qui
                                               fonner à 17,4 €/MWh durant les                                               moyen du certificat vert est en       procèdent encore à des essais et
                                               5 premières années d’exploita-                                               constante         augmentation        ne bénéficient pas encore du tarif
                                               tion de la machine, puis la dimi-                                            depuis 2003. Il est passé de          d’achat. En incluant ces derniers,
                                               nuer à 10,5 €/MWh les 10                                                     9,89 c€/kWh en 2003 à 11,68           le parc français est estimé à
                                               années suivantes, puis à 5,5                                                 c€/kWh en 2004, 13,06                 1 650 MW.
                                               €/MWh jusqu’à la fin de la                                                   c€/kWh en 2005 et 13,91
                                               durée d’exploitation de la                                                   c€/kWh en 2006.
                                               machine. De plus, l’État prévoit
                                               de plafonner le prix du kWh
                                               éolien à 84,7 €/MWh prime
                                               comprise. Cela veut dire que si
                                               le prix de marché atteint ce
                                               montant, la prime sera égale à
                                               zéro et le prix de l’électricité
                                               éolienne sera gelé. Pour infor-
                                               mation, le prix de marché de
                                               l’électricité était en moyenne de
                                               50 €/MWh en 2006.
                                               En Italie, le marché est en dimi-
                                               nution par rapport à 2005 avec                                                 LM Galsfiber
                                               417 MW installés en 2006

10                         É t a t d e s é n e rg i e s r e n o u v e l a b l e s e n E u r o p e - É d i t i o n 2 0 0 7
guidelines for and limit the size         certificates from those that pro-            has confirmed the rise in impor-
of the subsidy added on to the            duce an excess.                              tance of wind power with an
market price. It wants to limit           The mean price of a green cer-               additional 389.5 MW, includ-
this at 17.4€/MWh for the first           tificate has continuously in-                ing 90 MW of the Barrow off-
five years of machine operation,          creased since 2003. It went from             shore wind park (thirty 3-MW
and then decrease it to                   9.89 c€/kWh in 2003 up to                    capacity Vestas V90 wind tur-
10.5€/MWh for the following               11.68 c€/kWh in 2004, to                     bines). Total installed wind
ten years, and then finally down          13.06 c€/kWh in 2005 and to                  power capacity in the UK thus
to 5.5€/MWh up until the end              13.91 c€/kWh in 2006.                        amounts to 1 954.5 MW,
of the machine’s operating life.          In the United Kingdom, the                   including 303.8 MW offshore.
Moreover, the government plans            BERR (Department for Business,               In 2006, France became the

                                                                                                                                                                                       EurObserv’ER - Wind power barometer
on putting a ceiling on the price         Enterprise & Regulatory Reform)
of a wind origin kWh at
84.7€/MWh, with the subsidy                          Puissance éolienne installée dans l’Union européenne fin
included. This means that if the
                                                1    2006 (en MW)*. Wind power installed in European Union
market price reaches this price                at the end of 2006 (in MW)*.
level, the subsidy will be equal                                                      2005                                  2006
to zero and the price of wind ori-               Germany                              18 414,9                           20 621,9
gin electricity will be frozen. For
                                                 Spain                                10 027,9                           11 615,1
information, the average market
price for electricity was                        Denmark                               3 128,8                            3 135,0
50€/MWh in 2006.                                 Italy                                 1 718,3                            2 123,4
In Italy, the market is in decline               United Kingdom                        1 565,0                            1 954,5
with respect to 2005, with an                    Portugal                              1 047,0                            1 681,0
additional 417 MW installed in                   France**                                755,6                            1 650,0
2006 vs. 453 MW installed the
                                                 Netherlands                           1 224,0                            1 560,0
previous year, bringing total
installed capacity to 2 123.4 MW                 Austria                                 818,9                              964,5
(including a 11,9 MW decommis-                   Greece                                  573,3                              746,5
sioning. This decrease should only               Ireland                                 495,0                              746,0
be a temporary one. According                    Sweden                                  493,0                              516,0
to the ANEV (National Wind
                                                 Belgium                                 158,4                              193,1
Power Association), Italy’s total
installed capacity should reach 9                Poland                                   72,0                              152,6
500 MW in 2012 if the govern-                    Finland                                  82,0                               86,0
ment wants to provide the                        Hungary                                  20,5                               60,9
resources necessary to reach the                 Lithuania                                 6,4                               54,0
objective that it has set: a 25%                 Czech Rep.                               22,0                               50,0
renewable origin electricity share
                                                 Luxembourg                               35,3                               35,3
beginning in 2012.
In the Italian system, the produc-               Estonia                                  32,0                               32,0
ers and importers resort to green                Latvia                                   27,0                               27,0
certificates to prove that they have             Slovakia                                  5,1                                5,1
correctly fulfilled their legal obliga-          Total EU 25                        40 722,4                          48 009,8
tions to supply a percentage of                 *Ces chiffres tiennent compte des mises hors service./This figure includ
renewable origin electricity (2.7%              decommissioning. ** Départements et territoires d’outre-mer inclus/Overseas
in 2006). The companies that do                 departments and territories included.
                                                Source EurObserv’ER 2007.
not reach their objectives can buy

                                                                                              S t a t e o f R e n e w a b l e E n e rg i e s i n E u r o p e - 2 0 0 7 E d i t i o n   11
2     Production d’électricité d’origine éolienne dans les pays de
                                                                                                                                   l’Union européenne en 2005 et 2006 (en TWh).
                                                                                                                            Electricity production from wind power in European Union in 2005
                                                                                                                            and 2006 (in TWh).

                                                                                                                                                                 2005           2006
                                                                                                                              Germany                            27,200         30,500
                                                                                                                              Spain                              20,706         22,924
                                                                                                                              Denmark                             6,614          6,108
                                               DES PERSPECTIVES TOUJOURS                                                      United Kingdom                      2,904          4,225
                                               AUSSI INTÉRESSANTES                                                            Italy                               2,343          2,971
                                               La situation de l’énergie éolienne
                                                                                                                              Portugal                            1,741          2,892
                                               dans l’Union européenne est
EurObserv’ER - Baromètre éolien

                                               actuellement très favorable. L’Al-                                             Netherlands                         2,067          2,734
                                               lemagne et l’Espagne ne sont                                                   France                              0,990          2,191
                                               plus les seuls pays à maintenir la                                             Austria                             1,325          1,738
                                               croissance des pays de l’Union.                                                Ireland                             1,112          1,622
                                               La France, le Royaume-Uni, le                                                  Greece                              1,337          1,541
                                               Portugal, l’Irlande et quelques
                                                                                                                              Sweden                              0,936          0,987
                                               autres semblent bien décider à
                                               favoriser le développement de                                                  Begium                              0,180          0,378
                                               leur filière.                                                                  Finland                             0,200          0,200
                                               En Espagne, le Plan énergies                                                   Poland                              0,135          0,196
                                               renouvelables 2005-2010 est sans                                               Hungary                             0,013          0,085
                                               ambiguïté sur la volonté politique
                                                                                                                              Estonie                             0,023          0,080
                                               de développer l’éolien, avec un
                                               objectif de plus de 20 000 MW à                                                Luxembourg                          0,052          0,058
                                               l’horizon 2011.                                                                Czech Republic                      0,021          0,052
                                               En Allemagne, la diminution                                                    Latvia                              0,046          0,051
                                               attendue du marché n’a pas eu                                                  Slovakia                            0,010          0,009
                                               lieu avec au contraire une aug-                                                Lithuania                           0,002          0,006
                                               mentation sensible du marché en
                                               2006. Ce dernier devrait continuer
                                                                                                                              Total EU 25                        69,957         81,548
                                                                                                                              Source EurObserv’ER 2007.
                                               à rester élevé dans les prochaines
                                               années, soutenu à partir de 2008
                                               par la construction des premières                                            construction et 3 542,7 MW            2010 avec une puissance de
                                               fermes offshore allemandes.                                                  (pour 89 projets) déjà acceptés au    89 000 MW.
                                               En France, la publication de l’ob-                                           1er janvier 2007.                     La principale inconnue concer-
                                               jectif éolien de la loi de program-                                          Les perspectives sont également       nera la capacité de l’industrie
                                               mation pluriannuelle des investis-                                           très positives au Portugal où un      à répondre à la demande eu-
                                               sements qui a été portée à 13 500                                            appel d’offres garantit déjà la       ropéenne. En effet, la pénurie
                                               MW en 2010 va également dans                                                 construction de 1 700 MW sup-         de composants clés entraîne
                                               le bon sens, même s’il est proba-                                            plémentaires dans les prochai-        déjà des retards de livraison
                                               ble que cet objectif soit atteint avec                                       nes années en plus des parcs qui      d’aérogénérateurs. Les inves-
                                               au moins deux ans de retard.                                                 bénéficieront du tarif d’achat.       tissements nécessaires devront
                                               Au Royaume-Uni, les perspecti-                                               Ces perspectives favorables           être réalisés afin d’assurer une
                                               ves sont également très favora-                                              nous ont conduits à nettement         croissance européenne la plus
                                               bles avec 738,7 MW déjà en                                                   réévaluer nos projections pour        élevée possible. ◆

12                         É t a t d e s é n e rg i e s r e n o u v e l a b l e s e n E u r o p e - É d i t i o n 2 0 0 7
tive of 20 000 MW by the year               MW (for 89 projects) already
                                       2011. In Germany, the expec-                accepted as of 1st January 2007.
                                       ted market decrease did not                 Prospects are also very positive
                                       take place with, on the contrary,           in Portugal where a call for ten-
                                       a marked market increase in                 ders      already       guarantees
                                       2006. The German market                     construction of a supplementary
                                       should continue to remain high              1 700 MW in the next few years
                                       in the next few years, sustained            in addition to the parks that shall
                                       beginning in 2008 by the                    benefit from the wind origin elec-
third largest market in the Euro-      construction of the first German            tricity feed-in tariff.
pean Union, ahead of the Unit-         offshore wind farms.                        These favourable prospects have

                                                                                                                                                                                   EurObserv’ER - Wind power barometer
ed Kingdom, with an addition-          In France, publication of the wind          led us to markedly re-evaluate
al 894.4 MW. According to EDF,         power objective of the “Long-               our forecasts for the year 2010
the capacity of purchase obliga-       Term Programming of Invest-                 with a capacity of 89 000 MW.
tion wind power installations in       ments”, which was raised to 13              The major unknown factor is the
metropolitan France and in Cor-        500 MW for 2010 is also going               industry’s ability to meet Euro-
sica is 1 388 MW, with an addi-        in the right direction, even if it is       pean demand. The shortage of
tional capacity in the region of       probable that this objective shall          key components is already lea-
65 MW in the French overseas           only be reached at least two                ding to delays in the delivery of
departments and territories, i.e.      years later than hoped. Prospects           wind turbines. Necessary invest-
a total of 1 453 MW for the            are also very favourable in the             ments must be made so as to
whole of France. This figure           UK, with 738.7 MW already                   ensure European growth that is
does not take into consideration       under construction and 3 542.7              as high as possible.◆
the wind parks delivered to their
operators that are still undergo-
ing testing and which do not yet            Comparaison de la tendance actuelle avec les objectifs du
                                        3   Livre blanc (en MW). Comparison between current trend and
benefit from the feed-in tariff. If    White Paper objectives (in MW).
these installations are included,      Source : EurObserv’ER 2007.
French installed capacity is esti-
mated at 1 650 MW.
                                                                                 89 000
PROSPECTS THAT ARE STILL JUST AS
ATTRACTIVE
The situation of wind energy in
the European Union is currently
a very favourable one. Germany
and Spain are no longer the
only countries keeping up
                                                                 48 010
growth for all the EU countries.
France, the United Kingdom,                   40 722                                                     40 000
Portugal, Ireland and a few
others seem to be well decided
                                                                                                                       White Paper
                                                                                                                       Livre blanc

to favour development of their
wind power sectors. In Spain,
the Renewable Energies Plan,
                                                                          2006
                                                       2005

                                                                                          2010

adopted in 2005, is unequivo-
cal in its political desire to deve-
lop wind power, with an objec-

                                                                                          S t a t e o f R e n e w a b l e E n e rg i e s i n E u r o p e - 2 0 0 7 E d i t i o n   13
CONVERTIR LA LUMIÈRE EN ÉLECTRICITÉ
EurObserv’ER - Baromètre photovoltaïque

                                                   e marché européen du

                                          L        photovoltaïque        a
                                                   encore atteint des som-
                                                   mets en 2006, grâce au
                                          dynamisme du marché alle-
                                          mand. La puissance européenne
                                          photovoltaïque s’établit en                                                                                          Photowatt
                                          2006 à 3 216,9 MWc, permet-
                                          tant de dépasser largement la
                                          barre des 3 000 MWc. Les                                  miques, l’Allemagne est en train      les États-Unis (145 MWc en
                                          objectifs du Livre blanc ont                              de prouver que c’est possible.        2006). La solidité du marché
                                          donc été remplis avec quatre                              Les estimations officielles du        allemand s’explique par la sta-
                                          ans d’avance. Le secteur du                               BMU (ministère de l’environne-        bilité du système d’incitation,
                                          photovoltaïque européen reste                             ment) sont de 950 MWc pour            basé essentiellement sur la loi
                                          cependant très hétérogène,                                les installations reliées au réseau   “Énergies renouvelables“ (EEG)
                                          avec un marché allemand ultra-                            portant la puissance du parc          qui, depuis août 2004, oblige
                                          dominant de 953 MWc sur un                                germanique à 2 863 MWc. Ces           les fournisseurs d’électricité à
                                          marché total de 1 043,6 MWc,                              statistiques font figure de com-      racheter l’électricité photovol-
                                          tandis que les autres marchés de                          promis entre les estimations du       taïque à un tarif prédéfini. En
                                          l’Union varient de quelques                               magazine Photon (1 150 MW)            2006, les systèmes reliés au
                                          kWc à quelques dizaines de                                et celles de l’association des        réseau bénéficiaient d’un tarif
                                          MWc.                                                      industriels du solaire (753 MW).      variant entre 51,8 c€/kWh et
                                          Si certains décideurs politiques                          Quoi qu’il en soit, le marché         48,74 c€/kWh sur une durée de
                                          doutent encore de la capacité                             allemand occupe toujours la           vingt ans, mais avec une
                                          de la filière photovoltaïque à                            première place mondiale pour          dégressivité de 5 % par an. Un
                                          devenir un secteur de poids, en                           les photopiles, loin devant le
                                          termes énergétiques et écono-                             Japon (286,6 MWc en 2006) et

14 É t a t d e s é n e rg i e s r e n o u v e l a b l e s e n E u r o p e - É d i t i o n 2 0 0 7
EurObserv’ER -Photovoltaic barometer
                                                                                                                           Acciona

Changing light into electricity
         he European photo-         953 MWp out of a total market        capacity to 2 863 MWp. These

T        voltaic market once
         again reached the
         heights in 2006, thanks
to German market dynamism.
European installed photovoltaic
                                    of 1 043.6 MWp, while the oth-
                                    er EU markets vary from a few
                                    kWp to a few dozen MWp.
                                    If certain political decision mak-
                                    ers may still doubt the capacity
                                                                         statistics are considered as a
                                                                         compromise between the esti-
                                                                         mates of Photon magazine (1
                                                                         150 MW) and those of the
                                                                         Association of German Solar
capacity reached 3 216.9 MWp        of the photovoltaic sector to        Industrialists (753 MW). Be this
in 2006 making it possible to       become a weighty sector in           as it may, the German market is
widely pass over the 3 000          both energy and economic             still world leader for solar cells,
MWp benchmark. White Paper          terms, Germany is in the process     far ahead of Japan (286.6 MWp
objectives have thus been ful-      of proving that this is indeed       in 2006) and the USA (145
filled four years ahead of sched-   possible. Official estimates of      MWp in 2006). The solidness of
ule. The European photovoltaic      the BMU (Ministry of the Envi-       the German market can be
sector remains, however, very       ronment) are of 950 MWp for          explained by the stability of the
heterogeneous, with an ultra-       grid-connected installations,
dominant German market of           bringing total German installed

                                                                               S t a t e o f R e n e w a b l e E n e rg i e s i n E u r o p e - 2 0 0 7 E d i t i o n      15
sance nouvellement installée en            moyen de l’électricité pour le
                                                                                                    Espagne a été de 60,5 MWc,                 reste de la durée de vie de l’ins-
                                                                                                    portant la puissance totale de             tallation. Pour les installations
                                                                                                    son parc à 118,1 MWC (dont                 supérieures à 100 kWc, le tarif
                                                                                                    15,2 MWc hors réseau). Le                  passe à 3 fois le prix moyen de
                                                                                                    marché espagnol a donc très                référence de l’électricité pour les
                                                                                                    bien accueilli le décret royal             vingt-cinq premières années
                                                                                                    436/2004, qui est le principal             (équivalent à 22,98 c€/kWh) et
                                                                                                    instrument de promotion de                 à 2,4 fois le prix moyen de réfé-
                                          bonus de 5 c€/kWh est ajouté                              l’électricité renouvelable. Le             rence de l’électricité pour le
EurObserv’ER - Baromètre photovoltaïque

                                          pour les systèmes intégrés en                             tarif d’achat photovoltaïque               reste de la durée de vie de l’ins-
                                          façade. La possibilité d’une                              espagnol a la particularité de ne          tallation. Avec un tel système,
                                          modification de la loi EEG pour                           pas être fixé. Il est calculé en           l’Espagne ne devrait avoir
                                          le photovoltaïque est clairement                          fonction d’un pourcentage du               aucune difficulté à atteindre son
                                          évoquée par le gouvernement,                              prix moyen de l’électricité                objectif de 400 MWc connec-
                                          notamment une augmentation                                durant l’année en cours. Pour              tés au réseau d’ici à 2010.
                                          de la dégressivité annuelle.                              les installations inférieures à            En Italie, seulement 11 MWc
                                          La montée en puissance du                                 100 kW, le tarif d’achat corres-           ont été raccordés au réseau en
                                          marché espagnol a été confir-                             pond à 5,75 fois le prix moyen             2006, alors que les demandes
                                          mée en 2006. Selon l’IDAE (Ins-                           de l’électricité pour vingt-cinq           de raccordement se comptaient
                                          titut pour la diversification et                          ans (équivalent à 44,04                    en centaines de mégawatts.
                                          l’économie d’énergie), la puis-                           c€/kWh) et 4,6 fois le prix                Afin de répondre aux attentes
                                                                                                                                               des investisseurs, un nouveau
                                                                                                                                               système moins bureaucratique
                                                                                                                        C a p é n e rg i e s   a été mis en place par décret le
                                                                                                                                               19 février 2007. Ce nouveau
                                                                                                                                               système de tarif d’achat varie
                                                                                                                                               en fonction de la puissance de
                                                                                                                                               l’installation et en fonction de
                                                                                                                                               la typologie de l’installation
                                                                                                                                               photovoltaïque. Le tarif d’achat,
                                                                                                                                               valable pour une durée de vingt
                                                                                                                                               ans, varie désormais de
                                                                                                                                               36 c€/kWh, pour les centrales
                                                                                                                                               non intégrées et terrestres de
                                                                                                                                               plus de 20 kWc, à 49 c€/kWh,
                                                                                                                                               pour les centrales de 1 à 3 kWc.
                                                                                                                                               Il concerne les centrales instal-
                                                                                                                                               lées en 2007 et en 2008. Une
                                                                                                                                               dégressivité annuelle de 2 %
                                                                                                                                               sera ensuite appliquée à partir
                                                                                                                                               de 2009. Ce système d’incita-
                                                                                                                                               tion ne sera valable que pour les
                                                                                                                                               premiers 1 200 MWc, et il est
                                                                                                                                               prévu que la puissance photo-
                                                                                                                                               voltaïque pouvant être installée

16 É t a t d e s é n e rg i e s r e n o u v e l a b l e s e n E u r o p e - É d i t i o n 2 0 0 7
Puissance photovoltaïque installée dans l’Union européenne durant l’année 2005
 1   et 2006* (en MWc).
Photovoltaic power installed in European Union only during the years 2005 and 2006* (in MWp).

                                              2005                                        2006*
                                  Puissance annuelle installée                  Puissance annuelle installée
                                      Annual power installed                       Annual power installed
                               Réseau Hors réseau            Total           Réseau    Hors réseau         Total
                               On-grid        Off-grid                       On-grid      Off-grid
  Germany                      863,000          3,000       866,000          950,000        3,000         953,000
  Spain                         13,700          0,800        14,500           59,500        1,000          60,500

                                                                                                                                                                                   EurObserv’ER - Photovoltaic barometer
  Italy                         15,300          0,300        15,600           11,000        0,600          11,600
  France                         3,553          1,776         5,329            6,114        0,300           6,414
  United Kingdom                 2,567          0,146         2,713            3,007        0,158           3,165
  Belgium                        0,795          0             0,795            2,103        0               2,103
  Austria                        4,633          0,208         4,841            1,290        0,274           1,564
  Netherlands                    1,547          0,150         1,697            1,243        0,278           1,521
  Greece                         0,156          0,745         0,900            0,201        1,049           1,250
  Sweden                         0,060          0,311         0,371            0,301        0,302           0,603
  Cyprus                         n.a.           n.a.          n.a.             0,440        0,080           0,520
  Portugal                       0,073          0,215         0,288            0,227        0,250           0,477
  Denmark                        0,320          0,040         0,360            0,210        0,040           0,250
  Czech Republic                 0,111          0,003         0,114            0,241        0               0,241
  Slovenia                       0,076          0,004         0,080            0,183        0               0,183
  Poland                         0,016          0,067         0,083            0,087        0,027           0,114
  Finland                        0,030          0,270         0,300            0,064        0               0,064
  Luxembourg                     0,044          0             0,044            0,042        0               0,042
  Malta                          0,009          0             0,009            0,033        0               0,033
  Lithuania                      0              0             0                0            0,023           0,023
  Estonia                        0              0,001         0,001            0            0,005           0,005
  Slovakia                       0              0             0                0            0,004           0,004
  Latvia                         0              0,001         0,001            0            0,001           0,001
  Hungary                        0,010          0,007         0,017            0            0               0
  Ireland                        0              0,200         0,200            0            0               0
  Total EU 25                 905,999              8,243     914,242       1036,286            7,391                    1043,677
  *Estimation/Estimation - Source : EurObserv’ER 2007.

                                               voltaic electricity at a predefined   with a 5% per year price
incentive system, essentially                  tariff. In 2006, grid-connected       degression. A 5 c€/kWh bonus
based on the Renewable Ener-                   systems benefited from a feed-        is added for building facade
gies Law (EEG), which, since                   in tariff varying between 51.8        integrated systems. The possi-
August 2004, obliges electricity               c€/kWh and 48.74 c€/kWh for
suppliers to purchase photo-                   a period of twenty years, but

                                                                                          S t a t e o f R e n e w a b l e E n e rg i e s i n E u r o p e - 2 0 0 7 E d i t i o n      17
sera limitée à 3 000 MWc d’ici                              a ainsi porté en 2006 le crédit   principale, main-d’œuvre non
                                          à 2016.                                                     d’impôt pour les particuliers à   comprise. Le tarif d’achat a éga-
                                          Comme en Italie, la France a                                50 % (40 % en 2005). Ce sys-      lement été réévalué en juillet
                                          modifié l’an dernier une nou-                               tème permet aux particuliers de   2006. Il s’établit désormais pour
                                          velle fois son système d’incita-                            percevoir une somme représen-     la métropole à 30 c€/kWh plus
                                          tion, du fait de résultats trop                             tant la moitié du coût total de
                                          insuffisants. Le gouvernement                               l’équipement de leur habitation

                                                 Les parcs photovoltaïques de l’Union européenne en 2005 et en 2006* (en MWc).
                                           2     Photovoltaic capacities installed in European Union in 2005 and in 2006* (in MWp).
EurObserv’ER - Baromètre photovoltaïque

                                                                                                       2005                                       2006*
                                                                                 Puissances cumulées fin 2005                           Puissances cumulées fin 2006
                                                                                  Cumulated power end 2005                               Cumulated power end 2006
                                                                         Réseau       Hors réseau       Total                  Réseau       Hors réseau         Total
                                                                          On-grid       Off-grid                                On-grid       Off-grid
                                           Germany                      1 881,000        29,000     1 910,000                 2 831,000        32,000      2 863,000
                                           Spain                           43,400        14,200          57,600                 102,900        15,200         118,100
                                           Italy                           34,000        12,300         46,300                   45,000        12,900           57,900
                                           Netherlands                     45,749         5,435          51,184                  46,992          5,713         52,705
                                           France                            6,197       20,076         26,273                   12,311        20,376          32,687
                                           Austria                          21,126        2,895          24,021                  22,416         3,169          25,585
                                           Luxembourg                      23,561         0,000          23,561                  23,603         0,000          23,603
                                           United Kingdom                    9,953        0,924          10,877                  12,960         1,082          14,042
                                           Greece                            1,412        4,032           5,444                    1,613        5,081            6,694
                                           Sweden                            0,254        3,983           4,237                   0,555         4,285            4,840
                                           Belgium                          2,005         0,053           2,058                   4,108         0,053             4,161
                                           Finland                           0,223        3,779           4,002                   0,287         3,779            4,066
                                           Portugal                          0,548        2,441           2,989                    0,775        2,691            3,466
                                           Denmark                           2,355        0,295           2,650                   2,565         0,335            2,900
                                           Cyprus                            0,086        0,370           0,456                   0,526         0,450            0,976
                                           Czech Republic                    0,380        0,150           0,530                    0,621        0,150            0,771
                                           Poland                            0,085        0,232           0,317                    0,172        0,259            0,431
                                           Slovenia                          0,082        0,098           0,180                   0,265         0,098            0,363
                                           Ireland                          0,000         0,300           0,300                   0,000         0,300            0,300
                                           Hungary                           0,065        0,090           0,155                   0,065         0,090            0,155
                                           Slovakia                         0,000         0,060           0,060                   0,000         0,064            0,064
                                           Malta                             0,015        0,000           0,015                   0,048         0,000            0,048
                                           Lithuania                        0,000         0,017           0,017                   0,000         0,040            0,040
                                           Estonia                          0,000         0,003           0,003                   0,000         0,008            0,008
                                           Latvia                           0,000         0,005           0,005                   0,000         0,006            0,006
                                           Total EU 25               2 072,496                      100,738    2 173,234      3 108,782     108,129         3 216,911
                                           *Estimation/Estimation - Source : EurObserv’ER 2007.

18 É t a t d e s é n e rg i e s r e n o u v e l a b l e s e n E u r o p e - É d i t i o n 2 0 0 7
bility of a modification of the
EEG law for the photovoltaic
sector has been clearly evoked
by the government, notably in
terms of an increase in the
annual degression rate.
The rise in importance of the
Spanish market was confirmed
in 2006. According to the IDAE
(Institute for Energy Diversifica-
tion and Conservation), newly

                                                                                                                                                                              EurObserv’ER - Photovoltaic barometer
installed capacity in Spain
amounted to 60.5 MWp, bring-
ing total installed capacity to
118.1 MWp (including 15.2
MWp off grid). The Spanish
market has thus given a very
favourably reception to Royal              Juwi
Decree 436/2004, which is the
principal renewable electricity
promotion instrument in Spain.           to the power grid in Italy in          shall be limited at 3 000 MWp
The Spanish photovoltaic feed-           2006, while requests for con-          between now and 2016.
in tariff has the particularity of       nection could be counted in            In the same way as in Italy,
not having a fixed price. It is cal-     hundreds of megawatts. In order        France once again modified its
culated as a function of a per-          to meet investor expectations, a       incentive system last year
centage of the mean price of             new, less bureaucratic, system         because results were too insuf-
electricity during the year in           has been established by the            ficient. In this way, the French
progress. For installations lower        Decree of 19 February 2007.            government raised the income
than 100 kW, the feed-in tariff          This new feed-in tariff system         tax credit for private individuals
corresponds to 5.75 times the            varies as a function of installation   to 50% in 2006 (40% in 2005).
mean price of electricity for            capacity and as a function of the      This system allows private indi-
twenty-five years (equivalent to         typology of the photovoltaic           viduals to receive a sum repre-
44.04 c€/kWh) and 4.6 times the          installation. The feed-in tariff,      senting half of the total cost of
mean price of electricity for the rest   valid for a period of twenty           the equipment of their principal
of installation lifetime. For instal-    years, now varies from 0.36            residence, exclusive of labour
lations greater than 100 kWp, the        c€/kWh for non-integrated and          costs. The feed-in tariff was also
tariff changes to 3 times the mean       terrestrial power plants of more       re-evaluated in July 2006. It is
reference price of electricity for the   than 20 kWp to 49 c€/kWh for           now set at 30c€/kWh for met-
first twenty-five years (equivalent      power plants of from 1 kWp to          ropolitan France, with an addi-
to 22.98 c€/kWh) and to 2.4              3 kWp. It shall concern power          tional bonus of 25 c€/kWh
times the mean reference price of        plants installed in 2007 and in        when it is integrated in a build-
electricity for the rest of installa-    2008. An annual 2% price               ing. In the French overseas
tion life. With a system like this,      degression shall then be applied       departments (DOM) and on
Spain shouldn’t have any difficul-       beginning in 2009. This incen-         Corsica, the feed-in tariff has
ty in reaching its objective of hav-     tive system shall only be valid for    been re-evaluated at 40
ing 400 MWp connected to the             the first 1 200 MWp, and it is         c€/kWh, with an additional
power grid by the year 2010.             foreseen that the photovoltaic
Only 11 MWp was connected                capacity that can be installed

                                                                                     S t a t e o f R e n e w a b l e E n e rg i e s i n E u r o p e - 2 0 0 7 E d i t i o n   19
Vous pouvez aussi lire