Expected impact of a lockdown with schools in session - France, Nov 2020 - EPIcx lab
←
→
Transcription du contenu de la page
Si votre navigateur ne rend pas la page correctement, lisez s'il vous plaît le contenu de la page ci-dessous
Expected impact of a lockdown with schools in
session - France, Nov 2020
Report #21 [previous reports at: www.epicx-lab.com/covid-19.html]

Giulia Pullano1,2, Laura Di Domenico1, Chiara E Sabbatini1, Vittoria Colizza1,*

1 INSERM, Sorbonne Université, Pierre Louis Institute of Epidemiology and Public Health, Paris, France
2 Sociology and Economics of Networks and Services lab at Orange Experience Design Lab (SENSE/XDLab) Chatillion, Paris, France

*vittoria.colizza@inserm.fr

08/11/2020 (DATA UP TO WEEKS 43,44)

RESUME
Ce rapport est une mise à jour du Rapport #19 sur l'impact attendu du deuxième confinement, mis en
place en France le vendredi 30 octobre pour endiguer la deuxième vague de l'épidémie de COVID-19.
Nous fournissons des projections mises à jour simulant un confinement souple informé des estimations
préliminaires sur la réduction de la mobilité enregistrée au cours du premier jour de confinement à partir
des données de téléphonie mobile, et explorons des durées de confinement plus longues. Les projections
sont issues des modèles mathématiques stratifiés par âge calibrés sur la trajectoire épidémique observée
dans chaque région. Ce rapport se concentre sur l'Auvergne-Rhône-Alpes, la Provence-Alpes-Côte d'Azur,
la Bourgogne-Franche-Comté, les Hauts de France, l'Île-de-France, les 5 régions avec le nombre le plus
élevé d’ admission à l’hôpital par habitant dans la semaine 44. Les analyses pour les autres régions
suivront. Les résultats numériques montrent que les réductions attendues sur le nombre d’hospitalisations
au pic varient entre 41% et 76%, selon les régions, par rapport à un scénario sans mesures restrictives.
Un confinement souple de 4 semaines avec les écoles ouvertes serait environ 20 à 30% moins efficace
dans la réduction des admissions à l'hôpital qu'un confinement stricte (comme le premier) de la même
durée. La descente des trajectoires épidémiques sous l'effet du confinement serait légèrement affectée
par l'ouverture ou la fermeture des collèges et lycées. Cependant, garder les collèges et lycées ouverts
entraînerait un rebond plus rapide une fois le confinement levé. Cela est dû à la circulation attendue du
virus dans cette classe d'âge au moment de deconfinement, puis aux nouvelles opportunités de
propagation dans la communauté une fois les restrictions levées. Une attention particulière doit être
portée aux collèges/lycées pour réduire les risques associés (par exemple, par une fréquentation réduite,
des stratégies spécifiques de dépistage, éventuellement la fermeture). Un confinement de 8 semaines
entraînerait une réduction supplémentaire de 20 à 30% des hospitalisations par rapport à un
confinement de 4 semaines. 3,5 à 8 semaines supplémentaires seraient nécessaires après 1 mois de
confinement souple avec les écoles ouvertes pour atteindre le niveau d'hospitalisation quotidien d'un

1                                                                                                                     epicx-lab.com
confinement rigide d'un mois avec les écoles fermées. Les effets de confinement devraient fortement
dépendre de la région, en raison du contexte épidémique au début du confinement (Reff et hospitalisations
quotidiennes), du pourcentage de population infectée lors de la première vague, et du respect des
mesures et recommandations (ex: réduction de mobilité et adoption de mesures préventives, hétérogènes
par région). Ce rapport ne se concentre pas sur les stratégies optimales de sortie à mettre en œuvre
après le deuxième confinement. Le délai entre mise en place du confinement et pic n'est pas prédit par le
modèle et il est supposée sur la base des estimations du premier confinement.

SUMMARY
This report is an update of Report #19 on the expected impact of the second lockdown implemented in
France on Friday, October 30 to suppress the second wave of COVID-19 epidemic. We provide updated
projections simulating a mild lockdown informed on the preliminary estimates on the mobility reduction
recorded during the first day of lockdown from mobile phone data, and explore longer durations of the
lockdown. We use age-stratified mathematical models calibrated to the observed epidemic trajectory in
each region. The current report focuses on Auvergne-Rhône-Alpes, Provence-Alpes-Côte d'Azur,
Bourgogne-Franche-Comté, Hauts de France, Île-de-France, the 5 regions with higher hospital admissions
per inhabitant in week 44. Analyses for other regions will follow. Numerical results show that the
expected reductions in healthcare demands at peak vary between 41% to 76%, depending on the region,
in comparison with a no-change scenario. A mild lockdown of 4 weeks with schools open would be about
20-30% less efficient in reducing hospital admissions than a rigid lockdown (as the first one) of the same
duration. The decrease of the epidemic trajectories under the effect of lockdown would be mildly affected
by the opening or closure of middle and high schools. However, keeping middle and high schools open
would lead to a faster rebound once the lockdown is lifted. This is due to the predicted circulation of the
virus in that age class, then finding novel opportunities to spread in the community once restrictions are
lifted. A specific attention to middle/high schools should be taken to reduce the associated risks (e.g.
through reduced attendance, specific testing strategies, eventually closure). A lockdown of 8 weeks
would lead to an additional reduction of 20%-30% hospitalizations compared to a 4-week lockdown.
Additional 3.5 to 8 weeks would be needed after 1 month of mild lockdown with schools open to reach the
daily hospitalization level of a 1-month rigid lockdown with schools closed. Lockdown effects are
expected to strongly depend on the region, due to the epidemic context at the start of the lockdown (Reff
and daily hospitalizations), the percentage of population infected in the first wave, and the adherence to
measures and recommendations (e.g. heterogeneous mobility reduction and adoption of preventive
measures, by region). This report does not focus on the optimal exit strategies to be implemented after
the second lockdown. The delay from lockdown implementation and time of the peak is not predicted by
the model and it is assumed based on estimates on the first lockdown.

2                                                                                            epicx-lab.com
INTRODUCTION
France is under a second lockdown since Friday, October 30 to curb the second epidemic wave. This
report presents un update of the scenario analyses on the expected impact that the lockdown will have on
the epidemic situation (see Report #19). This update considers:
     •   the actual date of the start of the lockdown;
     •   the update to hospitalization data of weeks 43, 44;
     •   the milder nature of this second lockdown, quantified by the mobility reduction per region
         estimated from mobile phone data;
     •   longer durations of the lockdown beyond 4 weeks (6, 8, 10 weeks).
The report focuses on Auvergne-Rhône-Alpes, Provence-Alpes-Côte d'Azur, Bourgogne-Franche-Comté,
Hauts de France, Île-de-France, the 5 regions with higher hospital admissions per inhabitant in week 44
(Table 1). Analyses on other regions will follow.

METHODS
Model. We used the model developed by INSERM to respond to the COVID-19 pandemic1–3. The model
was shown to capture the transmission dynamics of the epidemic in the first wave1, was used to assess
the impact of lockdown, exit strategies and reopening of schools in mid-April1,2, and to evaluate the rate
of underdetection of the test-trace-isolate strategy in the months of May-June3. It is based on a
stochastic discrete age-stratified approach using demographic, age profile, and social contact data of the
regions of mainland France, to account for age-specific contact activity and role in COVID-19
transmission. The model accounts for contacts in the population in different settings and activities.
Disease progression is specific to COVID-19 and parameterized with current knowledge to include
presymptomatic transmission, asymptomatic and symptomatic infections with different degrees of
severity (paucisymptomatic, with mild symptoms, with severe symptoms requiring hospitalization). Four
age classes are considered: [0-11), [11-19), [19-65), and 65+ years old (children, adolescents, adults,
seniors). A reduced susceptibility was considered for children and adolescents, along with a reduced
relative transmissibility of children, following available evidence from household studies, contact tracing
investigations, and modeling works. More details are provided in Ref.3.
The model was validated region by region against the estimates of three independent serological studies
conducted in France after the first wave3.
Table 1. Weekly hospitalizations per 100,000 inhabitants registered in w44 and estimated Reff. Values with ‘*’ are estimated to
hospitalization data up to w43.

    Region                                          Weekly hospitalizations per 100,000 in w44                        Reff
    Auvergne-Rhône-Alpes (ARA)                                         43.36                                         1.46*
    Provence-Alpes-Côte d'Azur (PACA)                                  33.61                                         1.31
    Bourgogne-Franche-Comté (BFC)                                      29.02                                         1.48
    Hauts de France (HDF)                                              26.23                                         1.43*
    Île-de-France (IDF)                                                24.85                                         1.18*

3                                                                                                                         epicx-lab.com
Parameterization and calibration. For each region, the model integrates estimates on the number of
individuals at workplaces over time, based on Google mobility data4 and Orange cellphone mobility data5
(Figure 1), accounts for students going back to school at the start of the school calendar on Sept 1, and
integrates data on the adoption of preventive measures over time3,6.
The model is fit to the different epidemic phases (pre-lockdown, lockdown, exit, summer, rentrée) using
hospital admission data by region. More details on the model and calibration are provided in Refs.1,3.
Results in this report account for the epidemic situation up to weeks 43, 44, estimating Reff between
1.18 and 1.48 in the regions under study (Table 1).
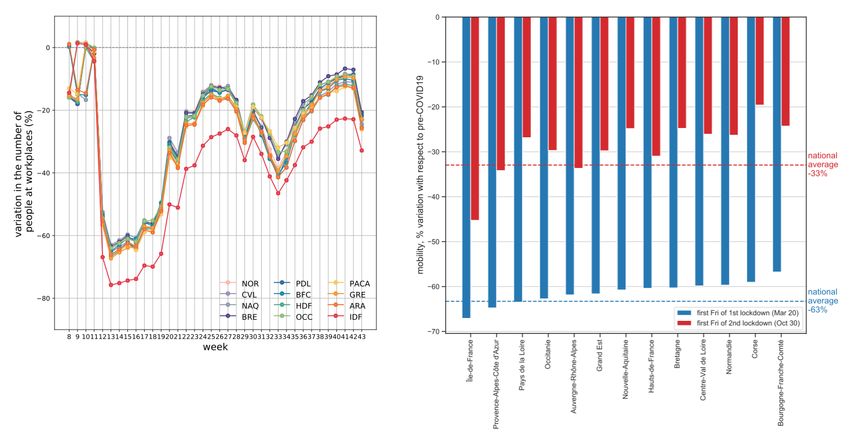
Figure 1. Estimated presence at workplaces by region and over time and observed mobility reduction on first day of lockdown. Left: Weekly
estimates by region of presence at workplaces are based on Google mobility data4 and confirmed independently with mobility data obtained
from Orange cellphone data5. The variation is computed with respect to pre-epidemic conditions, in the months of January-February (level
corresponding to zero on the vertical axis). Variations reported in weeks 8-10 refer to school holidays, similarly to variations recorded in
week 43 for the start of the 2-week All Saints’ holiday. Right: Variation of mobility inside each region recorded during the first Friday of the
first lockdown (in blue, March 20) and the first Friday of the second lockdown (in red, October 30)7. Estimates are based on mobility fluxes
extracted from mobile phone data (collaboration with Orange Research Dept). The average variation at the national level on October 30 was
-33% wrt pre-pandemic conditions, vs. -66% recorded in the first lockdown.
Lockdown scenarios. Lockdown is implemented on October 30, at the end of w44. Projections for the
weeks following w44 are obtained under a set of scenarios:
• No-change scenario, i.e. the epidemic continues to evolve as estimated in weeks 43, 44 and no
interventions are implemented.
• LD1 (LD1=strict lockdown, as effective as the 1st lockdown), assuming a lockdown as effective
as the one implemented on March 17 to curb the first wave, resulting in about 80% reduction of
contacts and 60-75% reduction of presence at work compared to pre-pandemic conditions1,
depending on the regions (Figure 1). LD1 has all schools closed.
4 epicx-lab.com• LD1 with all schools open, as above assuming that all schools are open (pre-schools and primary
schools, middle and high schools).
• LD1 with only pre-schools and primary schools open, as above but assuming that middle and
high schools are closed.
• LD2 (LD2=mild lockdown, informed by mobility in 2nd lockdown), assuming a milder lockdown to
simulate the restrictions currently in place in France, where a larger number of production
sectors remain open. To inform this scenario, we used the mobility reduction estimated on the
first day of lockdown (October 30) thanks to a collaboration with Orange Research Dept5,
analogously to what we did during the first lockdown1. The efficacy of the lockdown varied by
region, following the efficacy estimated in the first lockdown and accounting for the recorded
mobility reduction.
• LD2 with all schools open, as above assuming that all schools are open, as currently in place.
• LD2 with only pre-schools and primary schools open, as above but assuming that middle and
high schools are closed.
Universities are assumed to remain closed during all lockdown scenarios and adopt remote learning, as
currently done.
We explored scenarios with lockdown lasting 4 weeks, or 6, 8, 10 weeks. In each region, we assumed the
average delay between lockdown implementation and peak in the hospitalizations that was estimated
during the first wave for the region3. This delay ranged between 7 and 14 days depending on the region3.
At the end of the lockdown, in each region we consider that the epidemic situation is characterized by the
Reff estimated for the region in weeks 43, 44, before lockdown was implemented (Table 1). This report is
not aimed at the presentation nor optimization of exit strategies following the second lockdown.
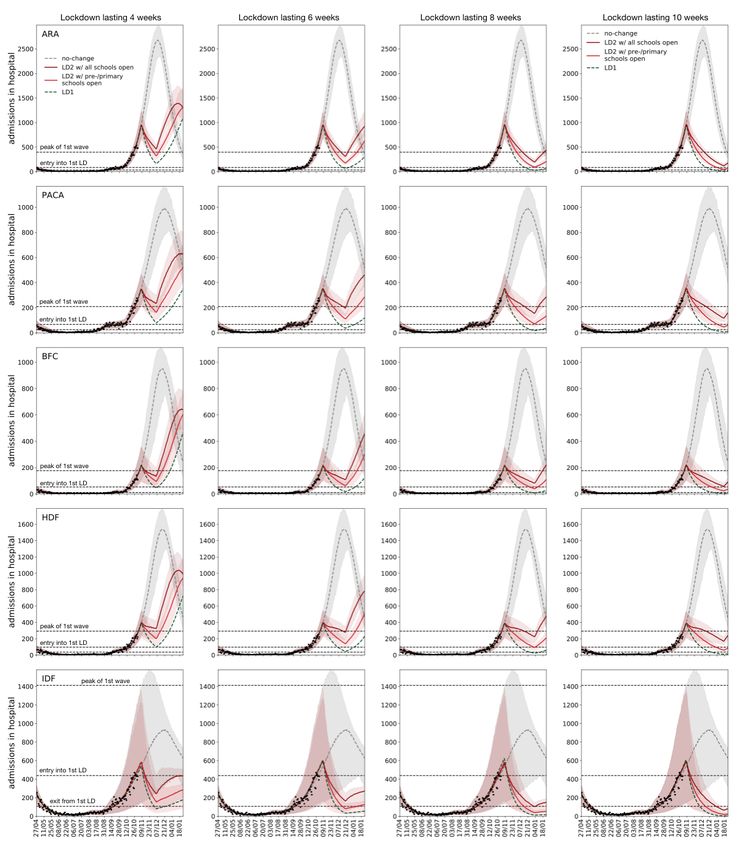
5 epicx-lab.comRESULTS Strict vs. mild lockdown scenarios with all schools open Figure 2. Epidemic trajectories for daily hospitalizations in strict and mild lockdown scenarios with all schools open. Each column refers to a different duration of the lockdown: from left to right: 4, 6, 8, 10 weeks duration. Each row refers to a region: from top to bottom: Auvergne- Rhône-Alpes (ARA), Provence-Alpes-Côte d'Azur (PACA), Bourgogne-Franche-Comté (BFC), Hauts de France (HDF), Île-de-France (IDF). In each plot, each curve corresponds to a different scenario: grey for the no-change scenario, i.e. if the situation is unchanged and the epidemic continues along the tendency estimated for w44; green (continuous line) for LD1 w/ all schools open, i.e. applying a lockdown as strict as in the first wave but opening all school levels; dark red for LD2 w/ all schools open, i.e. applying a mild lockdown informed by the mobility data in this second lockdown, with all school levels open; dark green (dashed line) for LD1, i.e. applying a lockdown as strict as in the first wave and keeping schools closed as in the first lockdown. This last scenario (LD1) is provided as a reference for the effect that could be obtained by applying a lockdown as strict as in the first wave. Lines correspond to median values obtained from 500 stochastic numerical simulations of the model. The shaded areas correspond to the 95% probability range, and they are shown only for the no-change scenario and for LD2 w/ 6 epicx-lab.com
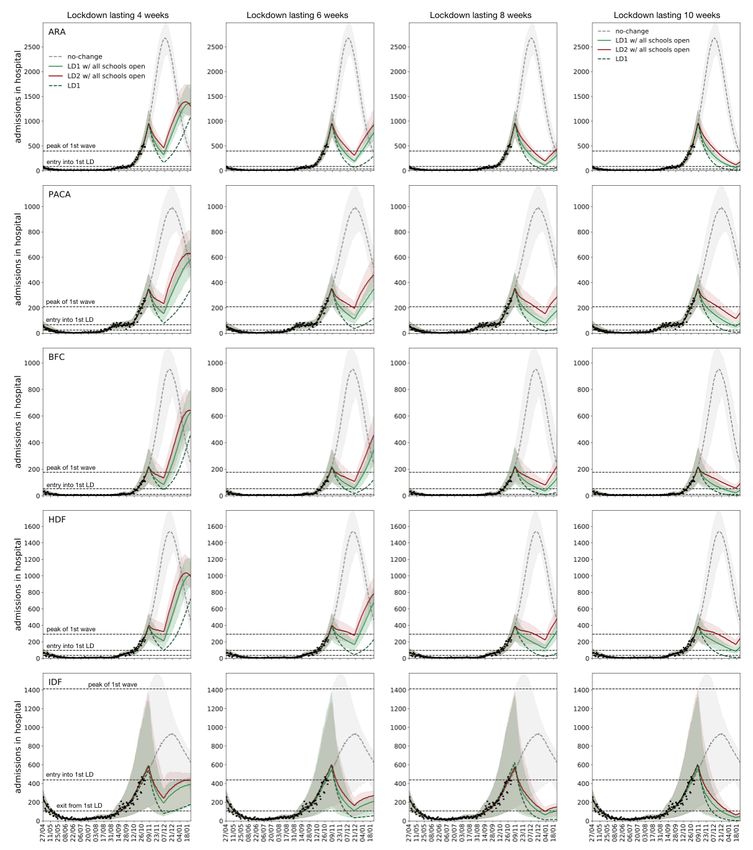
all schools open, for the sake of visualization. Dots correspond to daily hospitalizations data. The three dashed horizontal lines correspond to
the levels of hospital admissions registered at (from top to bottom) the peak of the first wave, the entry into the first lockdown on March 17,
the exit from the first lockdown on May 11. The time of the peak is not projected by the model but it is assumed based on the delay from
start of lockdown to peak estimated on the first lockdown3.

Mild lockdown scenarios with all schools open or with middle and high schools closed

Figure 3. Epidemic trajectories for daily hospitalizations in mild lockdown scenarios with all schools open or with middle and high schools
closed. Each column refers to a different duration of the lockdown: from left to right: 4, 6, 8, 10 weeks duration. Each row refers to a region:
from top to bottom: Auvergne-Rhône-Alpes (ARA), Provence-Alpes-Côte d'Azur (PACA), Bourgogne-Franche-Comté (BFC), Hauts de France
(HDF), Île-de-France (IDF). In each plot, each curve corresponds to a different scenario: grey for the no-change scenario, i.e. if the situation is
unchanged and the epidemic continues along the tendency estimated for w44; dark red for LD2 w/ all schools open, i.e. applying a mild

7                                                                                                                               epicx-lab.com
lockdown informed by the mobility data in this second lockdown, with all school levels open; red for LD2 w/ pre-/primary schools open, i.e.
applying a mild lockdown informed by the mobility data in this second lockdown, with only pre-primary and primary schools open; dark green
(dashed line) for LD1, i.e. applying a lockdown as strict as in the first wave and keeping schools closed as in the first lockdown. This last
scenario (LD1) is provided as a reference for the effect that could be obtained by applying a lockdown as strict as in the first wave. Lines
correspond to median values obtained from 500 stochastic numerical simulations of the model. The shaded areas correspond to the 95%
probability range, and they are shown only for the no-change scenario and for LD2 w/ pre-/primary schools open, for the sake of
visualization. Dots correspond to daily hospitalizations data. The three dashed horizontal lines correspond to the levels of hospital admissions
registered at (from top to bottom) the peak of the first wave, the entry into the first lockdown on March 17, the exit from the first lockdown
on May 11. The time of the peak is not projected by the model but it is assumed based on the delay from start of lockdown to peak estimated
on the first lockdown3.

Table 2. Expected reduction in healthcare demand at peak per region. The reduction is computed with respect to the no-change scenario.
Healthcare demand at peak is measured as hospitalizations at peak. The time of the peak is not projected by the model but it is assumed
based on the delay from start of lockdown to peak estimated on the first lockdown3.

    Region                                      Expected reduction in healthcare demand at peak
    Auvergne-Rhône-Alpes (ARA)                                   64% [54,74]%
    Provence-Alpes-Côte d'Azur (PACA)                            64% [52,76]%
    Bourgogne-Franche-Comté (BFC)                                76% [62, 88]%
    Hauts de France (HDF)                                        74% [65,85]%
    Île-de-France (IDF)                                           41% [0, 84]%

Table 3. Expected reduction in number of hospitalizations from w45 till the end of the year, depending on the lockdown and its duration. The
reduction is computed with respect to the no-change scenario. Only durations of 4 weeks and 8 weeks are shown.

Region           LD2 w/ all schools open    LD2 w/ pre-/primary schools open      LD1 w/ all schools open                    LD1

                  4w                8w           4w                8w              4w                8w              4w               8w
ARA          60% [54, 68]% 72% [67, 79]% 69% [63, 76]% 77% [73, 83]% 67% [62, 74]% 78% [73, 83] % 78% [73, 83]% 83% [79, 88]%
PACA         53% [43, 68]% 66% [57, 75]% 64% [55, 77]% 73% [66, 82]% 63% [55, 75]% 74% [66, 83]% 76% [70, 84]% 81% [76, 88]%
BFC          64% [51, 81]% 77% [67, 88]% 73% [62, 87]% 82% [73, 91]% 73% [61, 85]% 83% [74, 92]% 82% [74, 91]% 88% [80, 94]%
HDF          55% [46, 71]% 70% [61, 83]% 69% [60, 82]% 78% [71, 88]% 65% [56, 79]% 77% [70, 87]% 79% [73, 88]% 85% [80, 91]%
IDF          52% [7, 86]%     62% [20, 90]% 62% [28, 91]% 69% [35, 90]% 56% [21, 88]% 66% [31, 92]% 73% [39, 93]% 74% [46, 94]%

Table 4. Expected delay (median value) needed by each lockdown scenario to suppress the epidemic to the daily hospitalization level reached
by LD1 after 4 weeks.

Region          LD2 w/ all schools open    LD2 w/ pre-/primary schools open       LD1 w/ all schools open      LD1 w/ pre-/primary schools open
ARA                       25 days                      11 days                            12 days                           3 days
PACA                      43 days                      18 days                            16 days                           3 days
BFC                       37 days                      17 days                            12 days                           2 days
HDF                       56 days                      20 days                            27 days                           5 days
IDF                       26 days                      11 days                            14 days                           5 days

8                                                                                                                            epicx-lab.com
KEY FINDINGS
• Reduction of hospitalizations at peak. Expected reductions in healthcare demands at peak vary
between 41% to 76%, depending on the region, in comparison with a no-change scenario (Table
2). These reductions are based on the assumption that the time from lockdown implementation
to peak is equal to the delay estimated in the first wave3. If these delays are longer, then
expected reductions will be smaller.
• Mild vs. strict lockdown. A mild lockdown (LD2 w/ all schools open, Figure 2) parameterized on
the partial reduction of mobility observed at the start of the second lockdown and with all
schools open is predicted to be less efficient than a lockdown as implemented in the first wave
(LD1, Figure 2). The expected reductions in hospitalizations from lockdown till the end of the
year in the two scenarios (mild vs. strict, 4 weeks duration) are: 60% vs. 78% in ARA; 53% vs
76% in PACA; 64% vs. 82% in BFC; 55% vs 79% in HDF; 52% vs. 73% in IDF (Table 3). That
is, a mild lockdown of 4 weeks with schools open would be about 20-30% less efficient in
reducing hospital admissions than a rigid lockdown of the same duration.
• Closure of middle and high schools. A scenario with middle and high schools closed would allow
a faster decrease of the epidemic and avoid further hospitalizations (LD2 w/ all schools open vs.
LD2 w/ pre-/primary schools open, Figure 3). The expected reductions in hospitalizations from
lockdown till the end of the year in the two scenarios (mild w/ all schools open vs. mild w/
middle/high schools closed, 4 weeks duration) are: 60% vs. 69% in ARA; 53% vs 64% in PACA;
64% vs. 73% in BFC; 55% vs 69% in HDF; 52% vs. 62% in IDF (Table 3). That is, keeping all
school levels open in a mild lockdown of 4 weeks is about 12-20% less efficient in reducing
hospital admissions than closing middle and high schools. However, keeping middle and high
schools open would lead to a faster rebound once the lockdown is lifted. This is due to the
circulation of the virus in this community once phasing out the lockdown. A specific attention to
middle/high schools should be taken to reduce the associated risks. A faster suppression of the
epidemic and a more manageable exit from lockdown can be achieved by reducing the
attendance of students (e.g. envisioning rotations) up to full closure. This was already studied for
the reopening of schools while phasing out the first lockdown2. Also, testing strategies specific
for this community can be envisioned. In case of need, priority should be given to students of
pre-primary and primary schools to maintain learning and development for all students in the
age classes mostly in need.
• Lockdown duration. Milder lockdowns are less efficient in reducing hospitalizations (Table 3), so
that longer durations are needed to achieve the foreseen objectives. The expected reductions in
hospitalizations from lockdown till the end of the year in a lockdown lasting 4 weeks vs. 8 weeks
(LD2 w/ all schools open) are: 60% vs. 72% in ARA; 53% vs. 66% in PACA; 64% vs. 77% in
BFC; 55% vs. 70% in HDF; 52% vs. 62% in IDF (Table 3). That is, a lockdown of 8 weeks would
lead to an additional reduction of 20%-30% hospitalizations compared to a 4-week lockdown.
9 epicx-lab.comAdditional 3.5 to 8 weeks would be needed after 1 month of mild lockdown with schools open to
reach the daily hospitalization level of a 1-month rigid lockdown with schools closed (Table 4).
• Regional diversity. The impact of the same measures applied nationally will be heterogeneous
across regions, due to several aspects, including:
o first and most importantly, the epidemic situation at the start of lockdown, where e.g.
Reff is estimated to vary from 1.18 to 1.48 in the regions under study, indicating that
the epidemic will be more easily controllable in certain regions than in others;
o the percentage of the population infected during the first wave;
o the adoption of preventive measures that may vary across regions6;
o the reduction of mobility that is region-dependent, as already observed during the first
lockdown, due to demographic and socio-economic constraints that are region-
specific5;
o the region-specific impact of the first lockdown in suppressing the first wave that is
considered here as a proxy to inform the efficacy of the second lockdown in the models,
prior to analyses on observational data.
• Our simulations do not consider that the test-trace-isolate (TTI) strategy during the second
lockdown will be more efficient than during the first wave. The additional slowing down effect of
TTI may be useful in compensating for a partial compliance that could be expected in the second
lockdown due to ‘coronavirus fatigue’.
• This report does not focus on the optimal exit strategies1 to be implemented after the second
lockdown. This is a crucial aspect for the management of the epidemic in the upcoming months
that requires a different investigation. Results assume that after the lockdown the epidemic in
each region would be characterized by its Reff estimated before the lockdown was implemented
(Table 1).
MAIN LIMITATIONS
• Model calibration is done on mobility and hospitalization data up to weeks 43, 44, leading to the
values of Reff reported in Table 1, and does not consider further accelerations e.g. due to weather
conditions, or possible slowing down effects induced by the curfew implemented in certain areas
in w43 and w44.
• The estimated time at which the peak is expected to occur in the lockdown scenarios is not
predicted by the model but it is an assumption based on the delay estimated during the first
lockdown3. These delays may vary in the second wave due to different conditions (milder
lockdown, overlap with the end of school holidays, epidemic context, weather conditions). As
such, time of the peak is only indicative based on prior experience.
10 epicx-lab.com• These findings apply to the regions considered here and cannot be transposed to other regions,
because of the elements discussed in the key findings. Analyses for other regions will follow.
• LD2 is a milder version of the stringent lockdown implemented during the first wave (LD1, in the
scenarios). This scenario is calibrated from the mobility estimates measured from mobile phone
data on the first day of the lockdown, Friday October 30. Projections will need to be further
updated with more consolidated estimates measuring variations of mobility in the week of
November 2-8 for two main reasons: (i) we expect a possible period of adaptation to the new
restrictions before reaching a new stability, as seen during the first lockdown5; (ii) the first day
of the second lockdown was close to a vacation weekend and schools were closed, so it is not
necessarily representative of a routine day under the new lockdown. In addition, a longer time
frame of observation to measure changes in mobility is needed to reduce fluctuations effects.
• Being LD2 informed directly by mobility data, it may also account for limited compliance to
lockdown due to increased ‘coronavirus fatigue’, as these effects will be captured by the mobility
traces (e.g. individuals not respecting the mandate to telework).
• As the effectiveness of the second lockdown is based on the estimated effectiveness of the first
lockdown, these scenarios do not consider explicitly the widespread use of masks and its
mandatory use in certain conditions (closed environments, outdoor in certain cities). This use will
have a supplementary mitigating impact on the epidemic compared to the first wave when
masks were not widely used in the first lockdown. On the other hand, we assume that during the
second lockdown physical contacts outside the household are fully avoided, as in the first
lockdown1. This likely overestimates the current adoption of physical distancing that is affected
by accumulated fatigue (see Report #19). The two effects will contribute in opposite directions
and their contribution cannot be estimated at this stage. The impact of the second lockdown will
then be estimated on hospitalization data.
• Transmission in children (ACKNOWLEDGMENTS This study is partially funded by: ANR projects DATAREDUX (ANR-19-CE46-0008-03) and EVALCOVID- 19 (ANR-20-COVI-0007); EU H2020 grants MOOD (H2020-874850) and RECOVER (H2020- 101003589); REACTing COVID-19 modeling grant. We thank Sante publique France and the APHP for useful discussions. REFERENCES 1. Di Domenico, L., Pullano, G., Sabbatini, C. E., Boëlle, P.-Y. & Colizza, V. Impact of lockdown on COVID-19 epidemic in Île-de-France and possible exit strategies. BMC Med. 18, 240 (2020). 2. Di Domenico, L., Pullano, G., Sabbatini, C. E., Boëlle, P.-Y. & Colizza, V. Can we safely reopen schools during COVID-19 epidemic? medRxiv 2020.05.08.20095521 (2020) doi:10.1101/2020.05.08.20095521. 3. Pullano, G. et al. Underdetection of COVID-19 cases in France in the exit phase following lockdown. medRxiv 2020.08.10.20171744 (2020) doi:10.1101/2020.08.10.20171744. 4. Google. COVID-19 Community Mobility Report. COVID-19 Community Mobility Report https://www.google.com/covid19/mobility?hl=en. 5. Pullano, G., Valdano, E., Scarpa, N., Rubrichi, S. & Colizza, V. Population mobility reductions during COVID-19 epidemic in France under lockdown. Lancet Digit. Health 2020.05.29.20097097 (2020) doi:10.1101/2020.05.29.20097097. 6. Covid-19 : une enquête pour suivre l’évolution des comportements et de la santé mentale pendant l’épidémie. https://www.santepubliquefrance.fr/etudes-et-enquetes/covid-19-une-enquete- pour-suivre-l-evolution-des-comportements-et-de-la-sante-mentale-pendant-l-epidemie#block-249162. 7. Inserm. Voici les premières analyses de l’Inserm issues des datas Orange sur la diminution de la mobilité liée au confinement : -33% (en rouge) vs -63% en mars (en bleu). ‘Un reconfinement plus souple en France par rapport au 1er avec une moindre réduction de la mobilité selon @vcolizza’. @Inserm https://twitter.com/Inserm/status/1323557558800580611 (2020). 12 epicx-lab.com
Vous pouvez aussi lire