User manual Manuel d'utilisation
←
→
Transcription du contenu de la page
Si votre navigateur ne rend pas la page correctement, lisez s'il vous plaît le contenu de la page ci-dessous
User manual
                       Manuel d’utilisation

National Aquaculture Sector Overview maps
Cartes des Vues générales du secteur aquacole national
                                                         version 1.0

                                                                    Image ©
                                                                             2013 Te
                                                                    US Dept          rraMetric
                                                                            of State           s
                                                                   Image ©           Geograph
                                                                            2013 Di
                                                                   © 2013           gitalGlob er
                                                                          Google             e

  www.fao.org/fishery/naso-maps                              IA
                                                                         IS

                                                                     PA N
                                                             F

                                                               T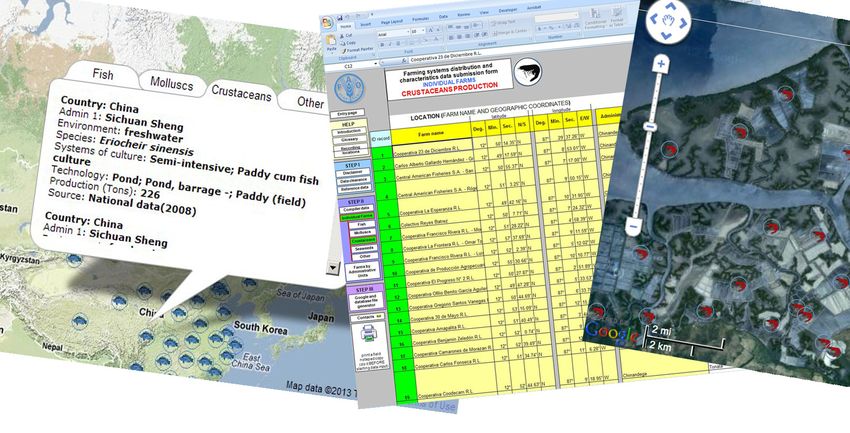
Acknowledgements
Numerous individuals contributed with inputs to the successful creation of the NASO maps collection,
including, the Microsoft Excel form, this user manual, and the NASO maps Web site. All of them are
gratefully acknowledged for their contributions during the development and testing phase. Special
thanks are due to F.Cardia (FAO consultant, Rome, Italy); X. Zhou and S. Tsuji (FAO Statistics and
Information Branch, Rome, Italy); K. Morteo (FAO Knowledge Information Systems Branch, Rome,
Italy); K. Sukwong and M. Abbas (FAO Knowledge Information Systems Branch, Bangkok, Thailand).
This user manual was prepared by J. Aguilar-Manjarrez and V. Crespi (FAO Aquaculture Branch,
Rome, Italy) with valuable contributions from J. Jenness, (FAO consultant, Flagstaff, Arizona, United
States of America). The graphic layout of this manual was prepared by S. Borghesi (FAO Aquaculture
Branch, Rome, Italy) and J.L.Castilla (FAO consultant, Rome, Italy), prepared the cover.

Cover photo: Left: NASO map for the the People’s Republic of China at an administrative level (left). Centre: Part of a
completed NASO map Excel form. Right: NASO map for the Republic of Nicaragua at an individual farm level (shrimp
ponds, Penaeus vannamei)
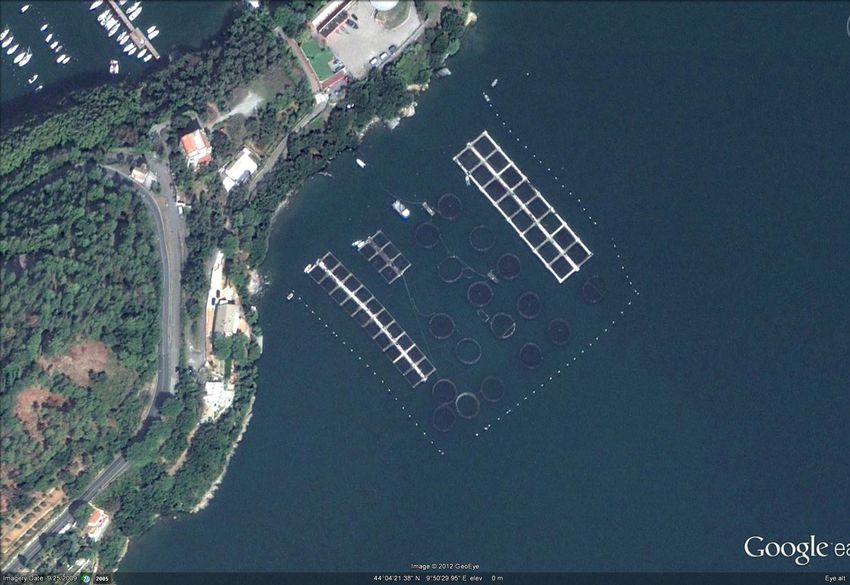
Back-cover: Cages, Italy, Gilthead seabream

The designations employed and the presentation of material in this information product do not imply the expression of any opinion whatsoever
on the part of the Food and Agriculture Organization of the United Nations (FAO) concerning the legal or development status of any country,
territory, city or area or of its authorities, or concerning the delimitation of its frontiers or boundaries. The mention of specific companies or
products of manufacturers, whether or not these have been patented, does not imply that these have been endorsed or recommended by
FAO in preference to others of a similar nature that are not mentioned.

The views expressed in this information product are those of the author(s) and do not necessarily reflect the views or policies of FAO.

Les appellations employées dans ce produit d’information et la présentation des données qui y figurent n’impliquent de la part de
l’Organisation des Nations Unies pour l’alimentation et l’agriculture (FAO) aucune prise de position quant au statut juridique ou au stade de
développement des pays, territoires, villes ou zones ou de leurs autorités, ni quant au tracé de leurs frontières ou limites. La mention de
sociétés déterminées ou de produits de fabricants, qu’ils soient ou non brevetés, n’entraîne, de la part de la FAO, aucune approbation ou
recommandation desdits produits de préférence à d’autres de nature analogue qui ne sont pas cités.

Les opinions exprimées dans ce produit d’information sont celles du/des auteur(s) et ne reflètent pas nécessairement les vues ou les
politiques de la FAO.

ISBN 978-92-5-007392-7 (print/version imprimée) E-ISBN 978-92-5-007522-8 (PDF)
© FAO 2013

FAO encourages the use, reproduction and dissemination of material in this information product. Except where otherwise indicated, material
may be copied, downloaded and printed for private study, research and teaching purposes, or for use in non-commercial products or
services, provided that appropriate acknowledgement of FAO as the source and copyright holder is given and that FAO’s endorsement of
users’ views, products or services is not implied in any way.

All requests for translation and adaptation rights, and for resale and other commercial use rights should be made via
www.fao.org/contact-us/licence-request or addressed to copyright@fao.org.

FAO information products are available on the FAO website (www.fao.org/publications) and can be purchased through publications-sales@
fao.org.

La FAO encourage l’utilisation, la reproduction et la diffusion des informations figurant dans ce produit d’information. Sauf indication
contraire, le contenu peut être copié, téléchargé et imprimé aux fins d’étude privée, de recherches ou d’enseignement, ainsi que pour
utilisation dans des produits ou services non commerciaux, sous réserve que la FAO soit correctement mentionnée comme source et
comme titulaire du droit d’auteur et à condition qu’il ne soit sous-entendu en aucune manière que la FAO approuverait les opinions, produits
ou services des utilisateurs.

Toute demande relative aux droits de traduction ou d’adaptation, à la revente ou à d’autres droits d’utilisation commerciale doit être présentée
au moyen du formulaire en ligne disponible à www.fao.org/contact-us/ licence-request ou adressée par courriel à copyright@fao.org.

Les produits d’information de la FAO sont disponibles sur le site web de la FAO (www.fao.org/publications) et peuvent être achetés par
courriel adressé à publications-sales@fao.org
National Aquaculture Sector Overview (NASO)
                                          maps collection

                       Farming systems distribution and characteristics
                                                 data submission form
                                                           version 1.0

                                                                      User manual

                                     Abstract

The National Aquaculture Sector Overview (NASO) maps collection geographically illustrates
where aquaculture is taking place. Key information features that accompany the geographical
locations are either by administrative units or individual farms and they include: cultured
species, technology used, culture systems, environments, farm characteristics and respective
production quantities, and main issues (credit, diseases, environmental impact, etc.).

A NASO map Microsoft Excel form was prepared to facilitate the creation of the NASO maps.
This user manual aims to facilitate the completion of the Excel form. The manual is aimed
for all FAO member countries who are reporting aquaculture statistics to FAO and who also
wish to inventory and monitor aquaculture in their respective countries. The NASO maps
collection is being developed by the Aquaculture Branch in collaboration with the Fisheries
and Aquaculture Statistics and Information Branch of the FAO Fisheries and Aquaculture
Department.

Aguilar-Manjarrez, J. & Crespi, V. 2013.
National Aquaculture Sector Overview map collection. User manual. / Vues générales du
secteur aquacole national (NASO). Manuel de l’utilisateur. Rome, FAO. 65 pp.

                                                                                         1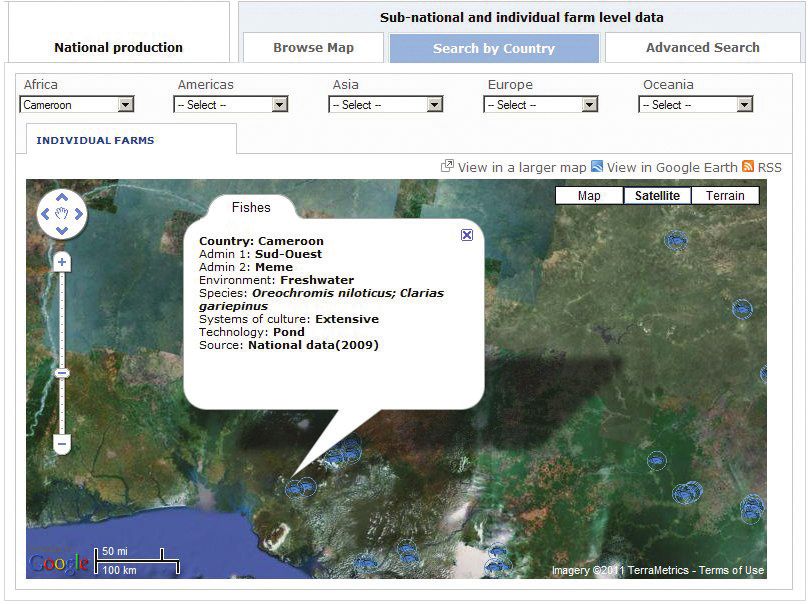
CONTENTS

1. GETTING STARTED                                               3

2. ENTRY PAGE                                                    6

3. NAVIGATION                                                    7

Recording aquaculture locations on the individual farms form
Option 1. Recording aquaculture locations using a GPS
Option 2. Recording aquaculture locations using Google
Option 3. GPS cell phone and cameras
Option 4. Recording aquaculture locations using hard-copy maps

The geographic coordinate system

4. HOW TO ADD NEW RECORDS                                        13

Data entry step 1
Data entry step 2
Data entry step 3

APPENDIX                                                         26

Terminology and glossary
Abbreviations and acronyms

2
1. GETTING STARTED

NASO Excel forms are customized for each country. The appearance of the entry page may
differ from what is presented in this manual. Options available in various dropdown boxes
in the individual data entry forms may also differ from the illustrations in this manual. The
instructions presented in this manual are applicable to all NASO Excel forms.

Opening the NASO Excel form
The NASO Excel form contains several computing instructions (or macros) and Visual Basic
Applications (VBA) functions to assist in data entry and to export data into database (dBASE)
tables and/or Google Earth Keyhole Markup Language (KML) files. To use the form correctly,
you may need to enable these macros when you open the Excel file.

Depending on the Excel version used, you will need to carry out the following settings
described below before you begin to complete the Excel form.

Excel 2002
In Excel 2002 (from Microsoft Office XP), you might see the following message when you
open the file:

“Macros in this workbook are disabled because the security level is high, and the macros
have not been digitally signed or verified as safe. To run the macros, you can either have
them signed or change your security level. Click “Help” for more information.”

In this message, do not worry about “signing” the macros. This is complex, and it is far easier
to simply change your security level to enable the macros.

To enable the macros, click your “Tools” menu, then “Macros”, then “Security” to open your
“Security” window. On the “Security Level” tab, set the security level to “Medium”.

                                                                                            3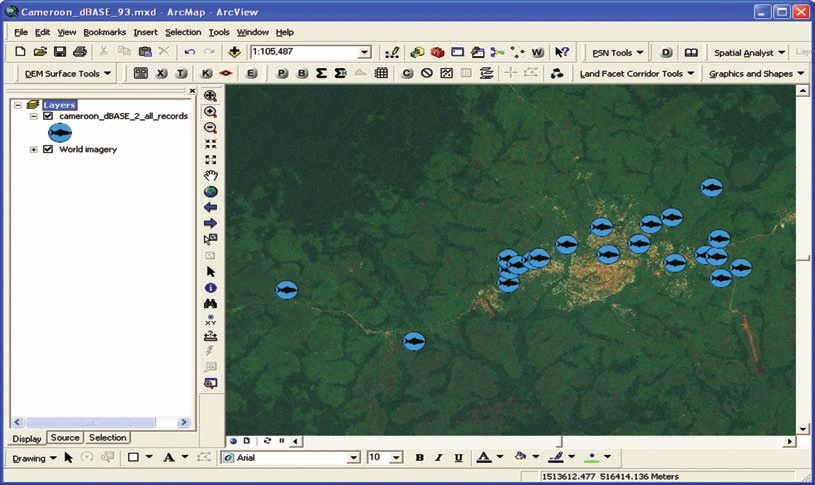
Click the “Trusted Sources” tab, then check
                                               “Trust access to Visual Basic Project”:

Click “OK” to close the window. Save the Excel file, close it and then reopen it.

Excel 2003
In Excel 2003, you might get a message similar to the following when you open the file:

                                                    In this case, simply click “Enable Macros”
                                                    to open the file.

Alternatively, you may see the following message:

The text in the warning box above explains how to enable macros in Excel 2003.

4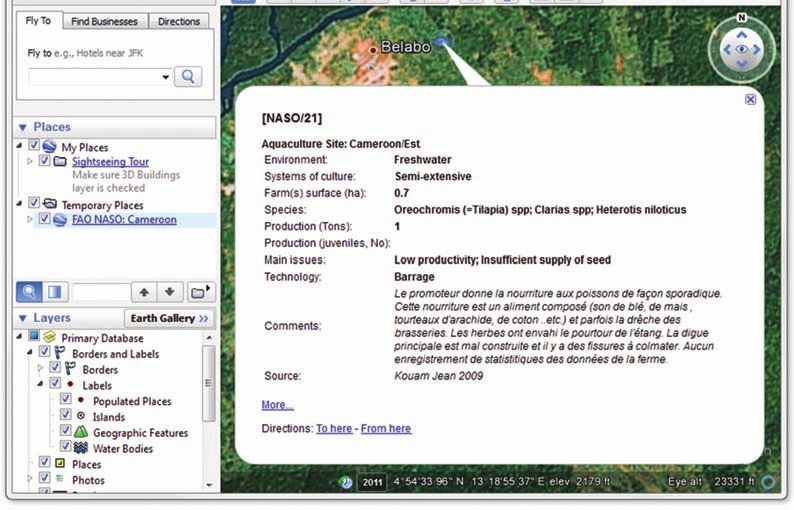
Excel 2007
In Excel 2007, you may need to click the “Options” button as soon as you open the file:

In the “Options” dialog, choose “Enable this content”.

Excel 2010
In Excel 2010, you may need to initially click “Enable Editing”.

And then “Enable Content”.

                                                                                          5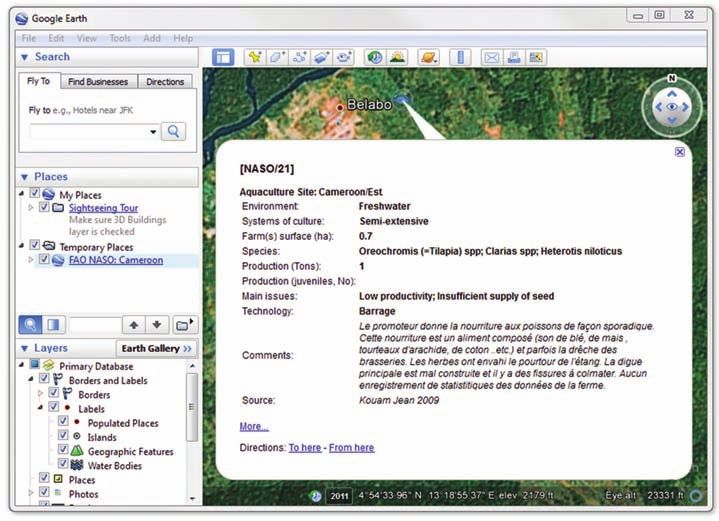
2. ENTRY PAGE

When opening the Excel file, you may see an entry page (customized for your country) which
looks similar to the following:

If so, simply click the “Enter” button to go to the Introduction page.

At this point you should see your navigation links on the left side of the Excel form.

A description of each navigation menu is presented on the next page.

6
3. NAVIGATION

Introduction
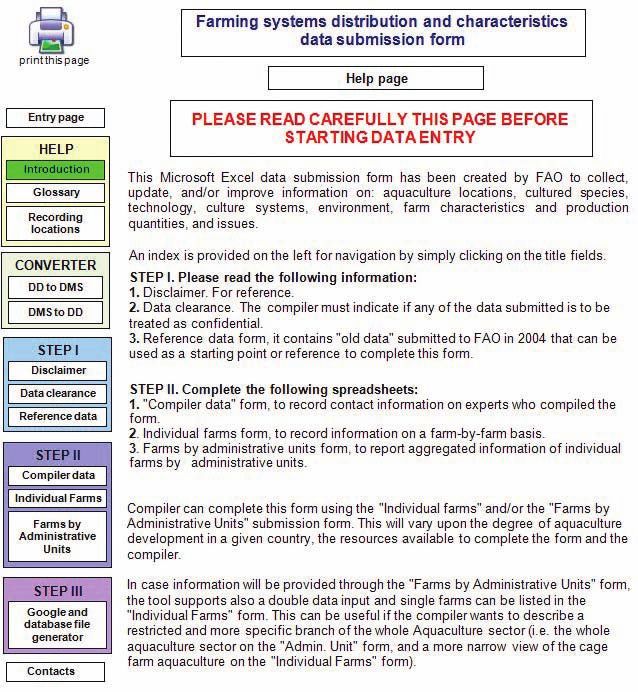
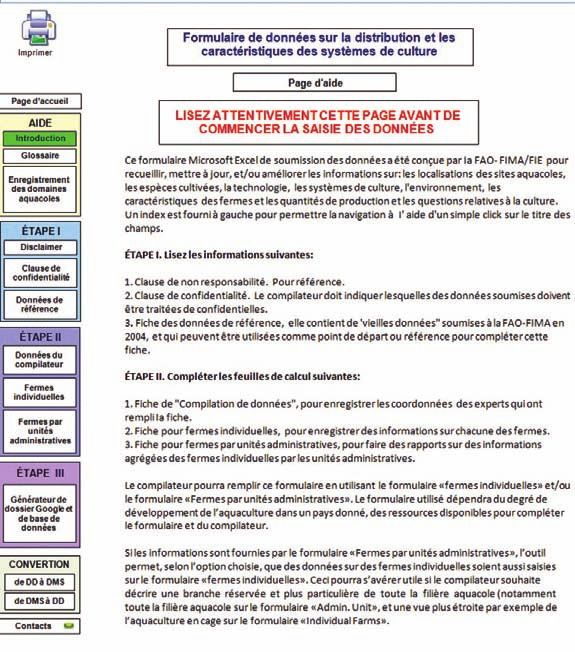
The compiler can complete this form using either the “Individual farms” form and/or the
“Farms by Administrative Units” form. The form used will depend on the degree of aquaculture
development in a given country, the resources available to complete the form and the compiler.

If the information is provided through the “Farms by Administrative Units” form, the tool
optionally allows data on single farms to also be entered in the “Individual Farms” form. This
can be useful if the compiler wants to describe a restricted and more specific branch of the
whole aquaculture sector (i.e. the whole aquaculture sector on the “Administrative Unit” form,
and a more narrow view of, for example, cage farm aquaculture on the “Individual Farms”
form).

     Warning:
Please, do not move, copy, paste or delete any field or spreadsheet in the document. You
can copy and paste ONLY cells within the same field (column).

    Caution:
Each production data form is a spreadsheet organized by CATEGORIES (columns).
Each record must be compiled following the field order from Left to Right:
Location → Cultured species →Technologies → Culture systems → Environments →
Farm characteristic and production quantities → Main issues

                    Fields with a yellow background are mandatory. If a mandatory
                    field is left unfilled, it will be not possible to fill the next fields of the
                    record. Therefore fields must be filled in the order specified above.

Each record has an ID number. The background color of the ID numbers will change
automatically depending on whether the record is complete. An ID number with a green
background color indicates that the record is complete, while a red background color
indicates the record is missing some mandatory data:

ID Record
1                Completed record. all the mandatory fields have been filled.
2                NOT completed record. Some mandatory fileds have been left empty.
3                Empty records.

     Caution:
1. Do not leave empty records (rows) within completed records.
2. Almost all the fields have dropdown menu cells where a value must be selected. In many
   cases, the options available in the dropdown menu will be customized for each country.
3. Where the dropdown menu is available, fill the cells only with values included in the menu
   list. Do not paste different values onto these cells.

                                                                                                     7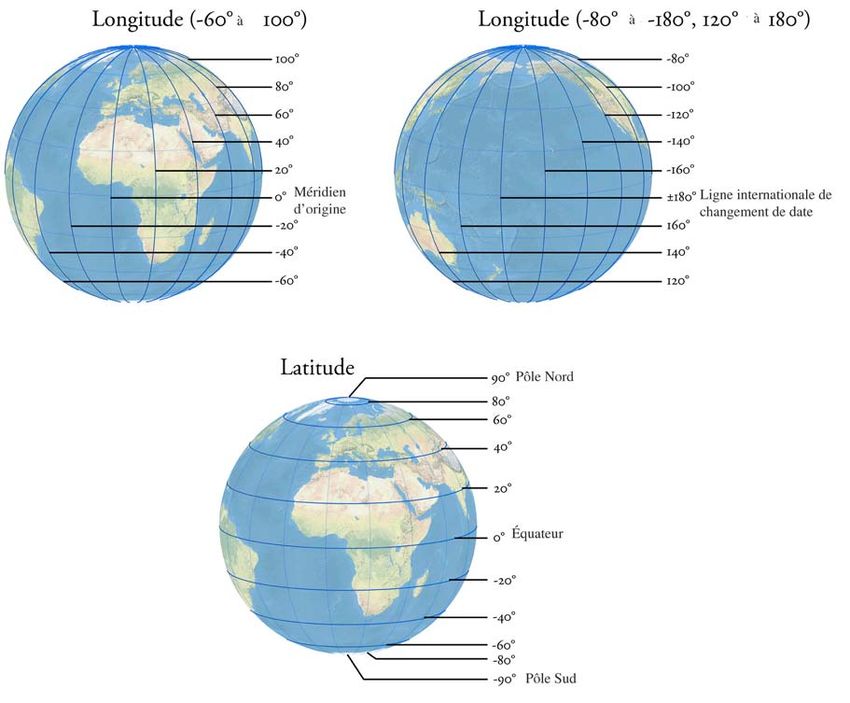
Caution:
1. If exporting data to either a Google KML or dBASE DBF file, please make sure all data
   has been entered and all mandatory fields have been completed before exporting the
   data.

Recording aquaculture locations on the individual farms form:
Entering data for individual farms requires the user to enter the latitude and longitude of the
farm location.

The following instructions aim to assist in collecting information on aquaculture locations and
their characteristics to upload and display in FAOs National Aquaculture Sector Overview
(NASO) (www.fao.org/fishery/naso/search/en).

Record the latitude and longitude coordinates of each aquaculture site (preferably) and/or
locations of clusters of farms (i.e. provide a lat/long location at the approximate centre of the
cluster). The lat/long locations can be derived using: (1) a Global Positioning System (GPS) as
the preferred choice; or else (2) using Google Earth, Google Maps, Yahoo! Maps or Microsoft
Virtual Earth; or (3) GPS cell phones (e.g. iPhone, Blackberry, Motorola), some cameras and
GPS mobile navigators; or (4) on a worst case scenario extracting this information from paper
maps.

OPTION 1. Recording aquaculture locations using a GPS
1. Travel to desired site location, record the Latitude and Longitude of the site using a GPS
   and assign a unique ID.
2. The ID or name of the location is extremely important to help identify and manage/
   update this information in databases. To this end, create an alphanumeric ID number
   (i.e. a combination of numbers of letters) of no more than eight characters.
3. Use the NASO map CONVERTER tool (see section below) or the Coordinate Converter
   “calculator” in the GPS Visualizer (www.gpsvisualizer.com) Web site to upload and/or
   export GPS data.
4. Experienced GPS users should use GPS software to upload/export the data recorded in
   GPS into an Excel file.

There are a vast range of GPS devices, therefore users are advised to read their GPS
user manual carefully. The Latitude and Longitude format varies among GPS units
(www.gpsinformation.org/dale/measure.htm), so it is important for users to select the
“hddd °mm’ss.s” format in their GPS device to enable Latitude and Longitude recordings in
Degrees, Minutes and Seconds.

When recording the Latitude and Longitude location of an individual farm simply record any
location that is within any part of the farm or in close proximity to the farm. The white dots in
the Google Earth images below show the possible locations for recording the Latitude and
Longitude location of individual pond or cages in Nicaragua and Italy.

If there are clusters of individual farms (i.e. ponds) then try to record the coordinates while
standing on the northernmost perimetre of the farm. This will allow you to determine that the
coordinates refers to the farm that is south of the location that will appear when entering the
coordinates on the map (see example below).

8
Nicaragua. Shrimp farming                        Italy. Fish cage culture
Individual pond        		                        Coordinates: 44° 4’23.08”N, 9°50’27.91”E
Coordinates: 12°57’21.65”N, 87°20’21.29”W        Source/Imagery:
Source/Imagery:                                  Image©2013 Digitalglobe
Image©2013 TerraMetrics
Image©2013 DigitalGlobe

                        Nicaragua. Shrimp farming
                        Pond cluster
                        Coordinates: 12°53’28.03”N, 87°14’29.56”W
                        Source/Imagery:
                        Image©2013 TerraMetrics
                        Image©2013 DigitalGlobe

OPTION 2. Recording aquaculture locations using Google Earth (similar
steps are used for Google Maps, Yahoo! Maps or Microsoft Virtual Earth)
If you did not record the aquaculture sites locations using a GPS, use Google Earth following
these instructions:
1. Download (http://earth.google.com/intl/en_uk) and install Google Earth in your PC.
2. Start Google Earth.
3. Zoom to the desired location.
4. Place the mouse over the desired location and manually record/write the lat/long values
     provided at the bottom left side of the Google Earth image in the Excel “Individual farms
     form”.
As an alternative, go to www.maps.google.com, find the spot that you need to record,
right click on the spot and select “what’s here” from the dropdown menu that appears. The
coordinates will appear in the search field in the Degrees and Decimal Degrees Format. They
can be converted to Degrees, Minutes and Seconds using the conversion tool in the NASO
Maps Excel form.
                                                                                           9
OPTION 3. GPS cell phone and cameras GPS cell phones are a new aid in the direction of using GPS tracking system. These devices, with the right software and service packs, can indicate your location, provide information regarding nearby areas and give turn-by-turn direction to your destination. These days, almost all new mobile phones sold in the United States of America and some other countries are GPS enabled. Many recent digital cameras (e.g. Nikon) record geographic coordinates. Also the ATP Photo Finder saves geographic coordinates in photos to be uploaded to Google Earth. GPS mobile navigators (e.g. Garmin) for your car, motorcycle and mobile phone. For those of you who have GPS enabled cell phones, digital cameras, and/or navigators this equipment could be an option to record your lat/long locations. Please consult your user manuals. OPTION 4. Recording aquaculture locations using paper maps Select a paper map at the appropriate scale (e.g. 1:50 000) then manually estimate the lat/ long location of desired site using data provided on the map (typically the graticules along the edges of the map). The geographic coordinate system The NASO map Excel form requires geographic coordinates input using Degrees, Minutes and Seconds (DMS). When looking at a map, latitude lines run horizontally. They are also known as parallels since they are parallel and are equally distant from each other. Each degree of latitude is approximately 111 km apart. Degrees of latitude are numbered from 0° to 90°. Latitude 0° corresponds to the Equator, the imaginary line which divides our planet into the Northern and Southern Hemispheres. Latitudes 90° and -90° refer to the North Pole and the South Pole, respectively. The vertical longitude lines are also known as meridians. They converge at the poles and are widest at the Equator. Longitude 0° is located at Greenwich, England. The degrees continue 180° (or 180° east) and -180° (or 180° west) where they meet and form the International Date Line in the Pacific Ocean. Greenwich, the site of the British Royal Greenwich Observatory, was established as the site of the Prime Meridian by an international conference in 1884. There are two methods of expressing fractions of degrees. The first method divides each degree into 60 minutes (1° = 60’), then each minute into 60 seconds (1’= 60”). This system is called DMS (Degrees, Minutes, Seconds). The symbol for degrees is °, for minutes is ‘, and for seconds is “. For example Rome, Italy is located at the latitude 41° 53’00”, longitude 12° 30’00”. The second method states the fraction as a decimal of a degree. This is the DD (decimal degree) system. With this system the position of Rome is: latitude 41.88333°, longitude 12.5°. DMS coordinates sometimes include a letter to indicate whether they are north or south of the equator (“N” or “S”), and east or west of the prime meridian (“E” or “W”). For example, the city of Lima, Peru (Longitude ‑76.945583, Latitude ‑12.049838) may be converted to DMS as either (W76° 56’ 44.099, S12° 2’ 59.417”) or (-76° 56’ 44.099, -12° 2’ 59.417”). 10
Converting between DD and DMS
The NASO Excel form require you to enter coordinates formatted as DMS, with a letter
indicating North/South and East/West. Unfortunately, you may only have coordinates
formatted as DD, and therefore you must convert them to DMS before entering them into
the NASO table. The NASO Excel tables include a tool to help with this, but in general the
formulas are as follows:

To convert from the DMS system to decimal degrees (DD):

       Decimal Degrees = (Degrees) + (Minutes / 60) + (Seconds / 3600)

The conversion from DD to DMS is a little more complicated, and will be explained with
the following example. Suppose you have the decimal degree reading of 5.23456°.
To convert it to the DMS system, you first subtract the whole degree. 5° is the whole degree,
so 5.23456°-5°=0.23456°. Then you multiply the remaining fraction with 60 minutes
(0.23456° * 60’=14.0736’), 14’ is the whole minutes. After this you multiply the fraction of
the minutes with 60 seconds (14.0736’-14’=0.0736’, 0.0736’*60”=4.416”), 4.416” are the
remaining seconds. The DMS version of 5.23456° is 5° 14’ 4.416”

                                                                                          11
Using the NASO tool for converting between DD and DMS Click the “DD to DMS” or “DMS to DD” link in the “Converter” box in the Navigation Bar to go to the appropriate worksheet: To convert from Decimal Degrees to Degrees Minutes Seconds, click the “DD to DMS” link. Simply enter your Decimal Degrees values in the appropriate columns. The Degrees Minutes Seconds values will appear automatically. The coordinates for Rome, Italy and Lima, Peru are already entered as examples. To convert from Degrees Minutes Seconds to Decimal Degrees, click the “DMS to DD” link. Enter your DMS values in the appropriate columns. The Decimal Degree values will appear automatically. The coordinates for Rome, Italy and Lima, Peru are already entered as examples. For details on converting degrees, minutes and seconds to decimal degrees, see De Graaf et al. (2003) (available at: www.fao.org/DOCREP/006/Y4816E/y4816e0e.htm#bm14). For conversion tools, see GPS Visualizer “calculator” (www.gpsvisualizer.com/calculators). de Graaf, G., Marttin, F.J.B., Aguilar-Manjarrez, J. & Jenness, J. 2003. Geographic Information Systems in fisheries management and planning. Technical manual, FAO Fisheries Technical Paper. 449. Rome. 162 pp. (also available at www.fao.org/docrep/006/y4816e/y4816e00.HTM). 12
4. HOW TO ADD NEW RECORDS

STEPS TO DATA ENTRY
There are three general steps to data entry. These steps are described briefly below and
explained in more detail in “General instructions”.

Step 1: Required
•   Disclaimer: For reference purposes only.
•   Data clearance: Whether your data should be treated as confidential or unrestricted.
•   Reference data: If available, samples of historical data are provided to be used as a
    starting point or as a reference to completing this form.

Step 2: Required
•   Compiler data: Contact information for experts who compiled this data.
•   Individual farms data: For data recorded on specific farms.
•   Farms by administrative units data: For aggregate data on all farms within specific
    administrative units.

Step 3: Optional
•   Export data to a Google Earth file (KML). Please visit www.google.com/earth/index.html
    to download Google Earth.
•   Export data to a dBASE Database file (dbf).

DATA ENTRY STEP 1
Data clearance

Click on the “Data clearance” link in Step 1 of the navigation bar to open the Data clearance
form.

It would be most grateful if all mandatory fields are completed to help enhance statistics at
FAO. However, it is understandable if you wish to restrict or control the distribution of this
information outside of FAO. Please select the appropriate boxes below to indicate whether
the following fields should be considered as unrestricted, or as strictly confidential and cannot
be published.

Data marked as “confidential” will be used only for statistical purposes at FAO.

Reference Data:
No data entry is needed here. This is simply historical data from past data entry sessions, or
sample data from FAO, if available, to assist or guide the user with the current data entry
session.

                                                                                              13
DATA ENTRY STEP 2: Compiler data: When opening the Compiler data, you will see an entry page (customized for your country) which looks similar to the following: For each person involved in this data entry session, please enter the following information in the appropriate fields. 1. Country 2. Expert name 3. Expert institution affiliation 4. Language 5. Email 6. Telephone 7. Address 8. Last save date 14
The next important step will be to decide whether the form will be completed by individual
farms or administrative units and this will depend upon the degree of aquaculture develop-
ment and the resources available to complete data collection form and the level of clearance
provided by the country experts.

Individual farms data:
Aquaculture data for individual farms requires the latitude and longitude of the farm location.
Please see the section on “Recording aquaculture locations on the individual farms form”
above for suggestions on how to obtain the correct latitude and longitude coordinates for farm
locations.

There are five separate data entry forms for different categories of aquaculture production:

 Fish                     Molluscs                     Crustaceans

 Seaweeds                 Other (reptiles, amphibians, invertebrates)

First click on “Individual Farms” in the navigation bar, then click the category you wish to enter
data for. Please complete the relevant categories according to the aquaculture practices in
your respective country.

                                                                                               15
For each individual farm, enter the following data in order: Please refer to the glossary for
definitions of individual fields.
There are nine main sections to complete in the Excel form: (1) location (farm name and geo-
graphic coordinates); (2) administrative location; (3) culture species; (4) technologies used;
(5) culture systems; (6) environments; (7) farm characteristics, production and quantities and
value; (8) seed input quantity and characteristics; and (9) main issues.
The completion of the Excel form simply requires the user to select categories in the “drop-
down” lists. The categories in the dropdown lists are standardized and correspond to the
categories for reporting national aquaculture statistics to FAO.
Note: Many of these dropdown lists will be customized for each country, so the options avail-
able to you may differ from the illustrations below.
Location
Individual farms
1. Farm Name: Required
2. Farm Latitude Degrees: Required
3. Farm Latitude Minutes: Required
4. Farm Latitude Seconds: Required
5. Farm Latitude N/S (enter either “N” for North, or “S” for South) : Required, select from
dropdown list.
6. Farm Longitude Degrees: Required
7. Farm Longitude Minutes: Required
8. Farm Longitude Seconds: Required
9. Farm Longitude E/W (enter either “E” for East, or “W” for West): Required, select from
dropdown list
16Administrative location
1. Administrative Level 1 (region/state): Required, select from dropdown list.
2. Administrative Level 2 (province/district): Optional, select from dropdown list.
Cultured species
Species 1: Required, select from dropdown list.
Species 2: Optional, select from dropdown list.
Species 3: Optional, select from dropdown list.
Species 4: Optional, select from dropdown list.
Note: It is possible to list up to 4 species. Species should be listed in descending order ac-
cording to the proportion of each species cultured, with the species with the largest proportion
listed first as Species 1.
Technologies used
Technology 1: Required, select from dropdown list.
Technology 2: Optional, select from dropdown list.
Technology 3: Optional, select from dropdown list.
17Note: You may list up to 3 technologies. Technologies should be listed in descending order according to the proportion each technology is used, with the technology used the most listed first as Technology 1. Culture systems 1. System 1: Required, select from dropdown list. 2. System 2: Optional, select from dropdown list. 3. System 3: Optional, select from dropdown list. Note: It is possible to list up to 3 culture systems. Systems should be listed in descending order according to the proportion of each culture system used, with the most used culture system listed first as System 1. Environments 1. Environment 1: Required, select from dropdown list. 2. Environment 2: Optional, select from dropdown list. 3. Environment 3: Optional, select from dropdown list. Note: It is possible to list up to 3 environments. Environments should be listed in descending order according to the proportion of each environment used, with the most-used environment listed first as Environment 1. Farm characteristics, production quantities and value 1. Employees (i.e. # of permanent employees): Optional 2. Surface area (in hectares): Optional 3. Number of rearing units (ponds, cages, etc.): Optional 18
4. Production in tonnes, Either this field or “number of juveniles” below is required to be filled
   out. Both fields can be filled out if necessary.
5. Number of juveniles Either this field or “production in tonnes” above is required to be filled
   out. Both fields can be filled out if necessary.
6. Year of production: Required
7. Price ex farm (USD x 1kg): Optional
8. Source of water: Optional
9. Land tenure: Optional

Notes:
• The data recorded must correspond to one year, please do not enter information from
   different years.
• The values in this section should be entered in US Dollars in order to allow for compari-
   son with other countries. It can be understood and acknowledged that the US Dollars
   currency varies in value in relation to other currencies, so the value entered in the NASO
   tables should reflect roughly the average value over the year.

Seed input quantity and characteristics
Annual input (Number of fish): Optional.
Input Categories: Optional, select from dropdown list.
Input Source: Optional, select from dropdown list.

Main issues
1. Issue 1: Optional
2. Issue 2: Optional
3. Issue 3: Optional

Note:
Issue 1: Most important issue in location;
Issue 2: Moderately important issue in location and
Issue 3: Least important, but it is an issue in location.

                                                                                               19
Comments General comments: Optional, please limit comment to 900 characters or less. Farms by administrative unit data: This category is intended for aquaculture data that is aggregated to describe an entire region, state, province or district. As with the individual farms form above, there are five separate data entry forms for different categories of aquaculture production: Fish Molluscs Crustaceans Seaweeds Other (reptiles, amphibians, invertebrates) First click on “Farms by Administrative Units” on the left side of the Excel window, then click the category you wish to enter data for. Please complete the relevant categories according to the aquaculture practices in your respective country. 20
If the country completing this Excel form does not have “Individual farms” level data, if the
countries does have the resources to conduct an inventory by individual farms, or if the number
of farms are too many to record then the user should complete the “Farms by Administrative
Units” section.

The categories for this form are “identical” to those described in the Individual farms section,
except that: (1) the location only refers to the administrative units and not single farms; and
(2) the information being provided is aggregated/summarized.

                                                                                             21
DATA ENTRY STEP 3:
The Excel worksheet includes tools to export your data into a Google Earth (KML) file or a
dBASE database (dbf) file. This step is not required, but it may be useful to the user to have
a compiled database file for their records, or a map file to visualize the data.
The compiler must have recorded the Excel form by either “Individual Farms” or “Farms by
Administrative Unit”, therefore, the relevant file to export will be selected automatically by the
Excel form. The Excel form does not allow the user to export both files at the same time.
Export to Google Earth:
This option will generate a KML (Keyhole Markup Language) file illustratring the spatial dis-
tribution of your data.
KML files are a special type of geographic data format created by Google for their Google
Earth application. KML files can also be imported into many mainstream GIS (Geographic
Information Systems) software for viewing and analysis. Google Earth is available for free
download at www.google.com/earth/index.html
Caution:
To make sure the KML file generator works properly, the Excel decimal separator must be a
full stop or dot (.). This is due to the International settings of PCs running Excel. If your Excel
display has a different symbol as decimal separator, such as a comma (,), you should change
this setting. To do this, open Excel and:
• In the Tools menu, click Options, and then click the International tab.
• Under Number Handling, clear the Use system separators check box.
Type “.” (a dot) in the Decimal separator and “,” (a comma) in the Thousands separator boxes.
To generate the Google Earth file, click on the Google Earth icon:
22Follow the directions to specify the name and location to save your KML file on your computer.
Upon completion (and assuming you have installed Google Earth), you may open and view
the file by double-clicking on it. An example is provided for the Republic of Cameroon.
Like most types of GIS data, KML data include both location and attribute information. For
example, KML files produced by this NASO Export tool include both the location of the
aquaculture sites and a variety of attributes concerning each site.
Attribute data on individual farm in Cameroon
23Once the Excel form is completed it should be sent to the FAO Aquaculture Branch (FIRA) for
validation. After the validation process is completed and the necessary corrections are made,
FIRA staff will then upload the results for display in the NASO map Web site. Countries are
also most welcome and encouraged to use the NASO Excel form in their institutes/organiza-
tions to help them update this information.
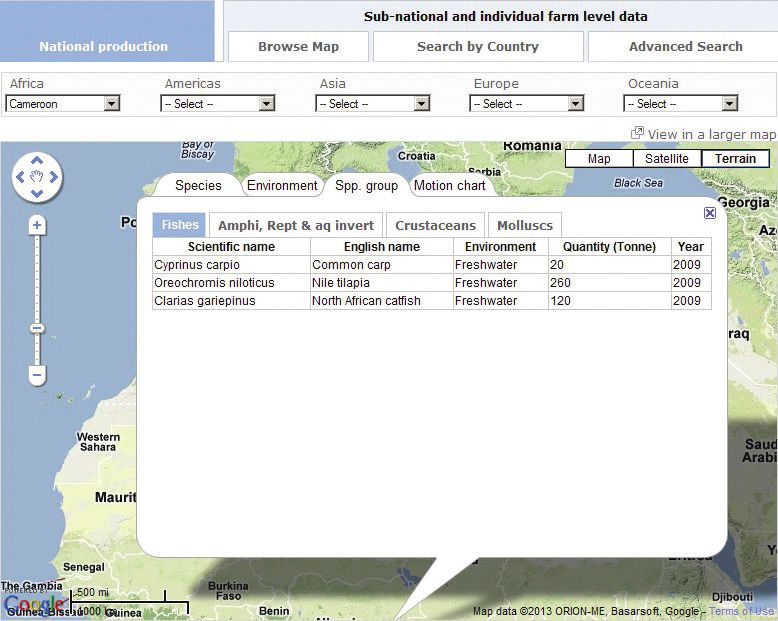
NASO map for Cameroon
(National production)
Source: FAO FishStat Plus
NASO map for Cameroon
(Individual farms)
Source: NASO Excel form
Source: www.fao.org/fishery/naso-maps/naso-home/en
24Export to CSV
For GIS users this option will generate a CSV database file of your data. Databases in CSV
format can easily be imported into most standard GIS packages for analysis and review.
Click on the CSV icon to generate the CSV file:
Follow the directions to specify the name and location to save your CSV file. Once completed,
you may import the file into the GIS software of your choice. e.g. the screenshot below shows
the output of Excel form using ArcGIS 9.3 software.
Selected Individual Farms in Cameroon displayed in ArcGIS 9.3 software
25APPENDIX
Terminology and glossary
1. Terminology
The present list of terms provide additional information to describe the categories listed in the
Excel form, the categories for the “Individual Farms” or the “Farms by Administrative Units”
are identical except for the location categories and the fact that information recorded in each
category in the “Farms by Administrative Units” form is aggregated. The “individual farms”
forms records geographic coordinate locations of farms on a farm-by-farm basis, or group of
farms basis whereas the “farms by administrative units” records aggregated information of
farms by State, provinces or districts as necessary. Likewise, the surface areas or tonnes
are recorded individually in the “Individual Farms” form and by administrative units in the
“farms administrative units” form.
Drop down Mandatory
Fields Submitted information
.
menu fields
Name of the farm or the name of
Farm name
the company owning the farm.
Geographic coordinates of the farm,
Latitude and longitude expressed in Degrees, minutes,
Location seconds.
At least one Author must indicate the
field from drop appropriate administrative location
Administrative location
menu is of the farm (e.g. state, district or
mandatory province).
At least one
field from drop Species reared in the farm. Author
Cultured species
menu is can list up to four species.
mandatory
At least one
Technologies used in the farm.
field from drop
Technology used Author can list up to three
menu is
technologies.
mandatory
At least one
field from drop Culture systems of the farm. Author
Culture system
menu is can list up to three systems.
mandatory
At least one
Environment used by the farm.
field from drop
Environments Author can list up to three
menu is
environments.
mandatory
26Number of permanent employees
Employees
working in the farm.
Surface of the farm expressed in
Surface (ha) hectares (the entire farm, not only
the individual rearing units).
Number of rearing units available in
Number of rearing units the farm. Rearing units could be
ponds, cages, tanks, etc.
Fish production can be expressed in
Tonnes tonnes (if farm does not have, or is
not, a hatchery) or number of
juveniles produced (in case the farm
would have, or is, a hatchery). Both
Production
“tonnes” and “number of juveniles”
Farm can be recorded in cases where the
Number of farm would perform both hatchery
characteristics
juveniles and outgrowing activities. At least
one production field is mandatory.
The year to which the record data
Year of production refers.
Price of the fish expressed in US
Dollars per Kilogram or US Dollars
per fish (in case production would
Price ex farm be expressed in “number of
juveniles”. The price is to be
referred to the product value ex
farm.
Source of water Source of water used by the farm.
The possession status of the land
Land tenure
occupied by the farm.
Seed input expressed in number of
Annual input
fish used yearly by the farm.
Seed input Categories of seed (e.g. eyed eggs,
Input categories
spat, postlarvae, etc.).
Input source Seed origin.
Aquaculture issues. Author can list
Main issues up to three issues within a list
displayed on a dropdown menu.
Free text, relevant comments may
Comments
be added here.
Note: Green color drop-down menu available, yellow color mandatory fields which need to be completed.
272. Glossary Selected terms as defined by FAO’s Glossary of aquaculture (www.fao.org/fi/glossary/aquaculture): Techniques Bag culture. Off-bottom shellfish culture (e.g. oysters) in which ongrowing takes place in mesh bags held on intertidal trestles. Barrage. (a) Artificial bar in any watercourse to raise the level of water. (b) Semi-permanent or seasonal enclosure formed by impervious man-made barriers and appropriate natural features. Basin catch. In totally drainable ponds, a harvesting structure built in the deepest part of the pond, in front of the water outlet; usually drainable so as to harvest the largest fish easily. Bottom culture. Type of extensive culture of mussels, oysters, scallops and clams in which ongrowing occurs on the seabed. After an appropriate period of growth period, the shellfish are harvested by dredging. Method also used for the culture of seaweeds. Cage. Rearing facility enclosed on the bottom as well as on the sides by wooden, mesh or net screens. It allows natural water exchange through the lateral sides and in most cases below the cage. Cage, fixed. A cage consisting of a net bag supported by posts driven into the bottom of a lake or river. Cage, floating. Traditional design: floating wood or bamboo cage, occasionally incorporated into a boat to form a sort of well boat; still widely used in Indonesia and Indo-China. Modern design: generally consists of a mesh bag supported by a buoyant collar or, in some cases, frame; some floating types rotate, as a means of controlling fouling. Collector (seed). Underwater device used to collect sticky eggs and settling larval stages such as mussel or oyster spat. Dam. A barrier constructed across a valley for impounding water or creating a reservoir. Dams are characterized by their purposes and construction materials used. ‘To dam’ means the holding back of water by means of a dam. Ditch. Long and narrow excavation dug out to receive or conduct water. Enclosure. An enclosed natural bay, where the shoreline forms all but one side, which is typi- cally closed off by a solid, net or mesh barrier. Farming, integrated. Occurs when an output from one subsystem in an integrated farming system, which otherwise may have been wasted, becomes an input to another subsystem resulting in a greater efficiency of output of desired products from the land/water area under a farmer’s control. 28
Hatchery. Place for artificial breeding, hatching and rearing through the early life stages of
animals, finfish and shellfish in particular. Generally, in pisciculture, hatchery and nursery are
closely associated. On the contrary, in conchyliculture, specific nurseries are common, where
larvae produced in hatcheries are grown until ready for stocking in fattening areas.

Lagoon. Water body situated between the shore and a coral reef, through the openings of
which tidal water circulates.

Lake. A natural relatively large body of standing water with negligible currents and enclosed
by land. It can be regarded as a relatively closed system as most of its hydrology is internal,
although it may have substantial inflowing and outflowing rivers.

Longline, culture. Form of open-water suspended culture in which cultured species are on-
grown on ropes or diverse containers (e.g. baskets, stacked trays, lantern nets) suspended
from anchored and buoyed surface or subsurface ropes (longlines). Used for the culture of
bivalve molluscs, e.g. mussels, oysters, scallops, and marine macroalgae.

Mixed, culture. The rearing of fish of different age and size in the same waterbody.

Off-bottom, culture. Where the culture equipment are kept off the bottom.

Paddy (field). Bunded or diked field in which surface water can be maintained for culture of
rice or other crops.

Pen. Fenced, netted structure fixed to the bottom substrate and allowing free water exchange;
in the intertidal zone, it may be solid-walled; the bottom of the structure, however, is always
formed by the natural bottom of the waterbody where it is built; usually coastal e.g. in shallow
lagoons, but also inland e.g. in lakes, reservoirs. A pen generally encloses a relatively large
volume of water.

Pond. Relatively shallow and usually small body of still water or with a low refreshment rate,
most frequently artificially formed, but can also apply to a natural pool, tarn, mere or small
lake.

Pond, barrage. Pond created in the bottom of a valley by building a dam across the lower
end of the valley. Water fed directly from a nearby spring, a stream, another barrage pond or a
reservoir. Water inflow either uncontrolled or controlled through a diversion canal and a water
intake. Drainable through the old river bed. Overflow structure present or not.

Pond, diversion. Pond fed indirectly by gravity or by pumping through a diversion canal
(which becomes the main feeder canal), from a spring, stream, lake, reservoir or barrage
pond. Water inflow controlled through a water intake. Usually drainable through a drainage
canal. Individual inlet and outlet for each pond.
Raceway. Structure, usually above ground, with a long, linear configuration; high water turn-
over rate; highly controlled environment; often terraced with water reuse.

Raft, culture. Form of suspended culture in which the ongrowing structures (ropes, etc.)
are suspended from a raft. Utilizes moored, floating rafts mostly for coastal shellfish culture;
holes are punched in old shells and the shells are placed on strings, which are attached to the
raft structure; after settling of spat on the shells, the rafts may be anchored in good growing
areas.
                                                                                               29
Ranching. Commercial raising of animals, mainly for human consumption, under extensive production systems, within controlled boundaries and paddocks (e.g. in agriculture), or in open space (oceans, lakes) where they grow using natural food supplies. In fisheries: stocking usually of juvenile finfish, crustaceans or molluscs from culture facilities for growth to market size or to maturity in the natural environment. Species usually used are migratory and return close to the point of release (e.g. salmon) or non-migratory and remain for at least a substantial portion of the life-cycle in restricted areas where they enter the local fishery (e.g. red sea bream, Penaeus japonicus, etc.). Silo. In aquaculture: (i) conical or straight sided vessels, which operate on an upwelling or downwelling of water through a bed of eggs. Similar to the Zoug jar method, except that the eggs are not hatched in the vessel. Commonly used as a method of storing excess eggs, or holding eggs whilst parent fish are tested for diseases. (ii) Deep tank with high flow rate and high stocking densiy. If circular also called “vertical raceway”. Wastes are flushed out. Stakes. Wooden or bamboo posts, mangrove tree branches, nipa palm petioles, etc. embedded in the bottom of shallow (intertidal) sea areas where they are used to collect wild mussel or oyster spat to be cultured on them. Tank. In aquaculture: a fish or water holding structure, usually above ground, typically with a high water turnover rate; highly controlled environment. Systems Extensive. Production system characterized by (i) a low degree of control (e.g. of environment, nutrition, predators, competitors, disease agents); (ii) low initial costs, low-level technology, and low production efficiency (yielding no more than 500 kg/ha/yr); (iii) high dependence on local climate and water quality; use of natural waterbodies (e.g. lagoons, bays, embayments) and of natural often unspecified food organisms. Semi-extensive. System of culture characterized by a production of 0.5—5 tonnes/ha/yr, possibly supplementary feeding with low-grade feeds, stocking with wild-caught or hatchery- reared fry, regular use of organic or inorganic fertilisers, rain or tidal water supply and/or some water exchange, simple monitoring of water quality, and normally in traditional or improved ponds; also some cage systems e.g. with zooplankton feeding for fry. Intensive. System of culture characterized by (i) a production of up to 200 tonnes/ha/yr; (ii) a high degree of control; (iii) high initial costs, high-level technology, and high production efficiency; (iv) tendency towards increased independence of local climate and water quality; (v) use of man-made culture systems. Integrated aquaculture. Aquaculture system sharing resources - water, feeds, management, etc. - with other activities; commonly agricultural, agro-industrial, infrastructural (wastewaters, power stations, etc.). Paddy cum fish culture. An integration technique, which entails raising fish in a rice paddy; fish and rice may be produced either concurrently (rizipisciculture) or in rotation. Hyper-intensive. System of culture characterized by a production averaging more than 200 tonnes/ha/yr, by the use of a complete (processed) fully formulated feed to meet all diet requirements of the species, stocking with hatchery-reared fry, no fertilizers used, full 30
predator and anti-theft precautions taken, highly co-ordinated and controlled regimes, usually
pumped or gravity supplied water or cage-based, full use of water exchange and aeration
with increasing levels of control over supply and quality, usually in flowing water ponds, cage
systems, or tanks and raceways.

Environment

Freshwater. The cultivation of aquatic organisms where the end product is raised in fresh
water; earlier stages of the life cycle of these species may be spent in brackish waters or
marine waters.

Brackish water. Water with a salinity intermediate between seawater and freshwater, usually
showing wide salinity fluctuations.

Marine. Coastal and offshore waters in which the salinity is maximal (around 35 ppt) and not
subject to significant daily and seasonal variation.

3. Abbreviations and acronyms
CSV comma separated value
DD   decimal degrees
DMS degrees, minutes, seconds
FAO Food and Agriculture Organization of the United Nations
GIS  geographic information system
GPS global positioning systems
KML keyhole markup language
NASO National Aquaculture Sector Overview

                                                                                            31
Remerciements Plusieurs personnes ont contribué à la réussite de la collection des cartes NASO, dont le formulaire Microsoft Excel, ce manuel de l’utilisateur et le site Web des cartes NASO. À toutes ces personnes, nous exprimons notre sincère reconnaissance pour leurs contributions à la phase de développement et d’essai de ce projet. Nous remercions tout particulièrement F. Cardia (consultant FAO Rome, Italie); X. Zhou et S. Tsuji (Sous-Division des statistiques et de l’information, FAO Rome, Italie); K. Morteo (Systèmes d’appui, FAO Rome, Italie); (K. Sukwong et M. Abbas (Systèmes d’appui, FAO Bangkok, Thaïlande). L’actuel manuel de l’utilisateur a été rédigé par J. Aguilar-Manjarrez et V. Crespi (Sous-Division de l’aquaculture, FAO Rome, Italie) avec d’importantes contributions de J. Jenness (consultant FAO, Flagstaff, Arizona, États-Unis d’Amérique). La présentation graphique de ce manuel a été l’oeuvre de Mlle S. Borghesi (Sous-Division de l’aquaculture, FAO Rome, Italie) et M. J. Luis Castilla (consultant FAO Rome, Italie) a préparé la page de garde. Photo de couverture: gauche: carte NASO pour la République populaire de Chine sur le plan administratif (gauche). Centre: une partie de la fiche Excel des cartes NASO. Droite: carte NASO de la République du Nicaragua dans une exploitation individuelle (étangs de crevettes, Penaeus vannamei) Le quatrième de page: Cages, Italie, Gilthead seabream 32
Formulaire pour la collection des cartes des vues
        générales du secteur aquacole national (NASO),
       données relatives aux systèmes de distribution et
                       aux caractéristiques des cultures
                                              version 1.0

                                                        Manuel de l’utilisateur

                                       Résumé

La collection des cartes des Vues générales du secteur aquacole national (NASO) illustre
géographiquement là où l’aquaculture est pratiquée. Les caractéristiques des informations
clé associées aux localisations géographiques s’obtiennent soit auprès des unités
administratives ou des exploitations individuelles et comprennent: les espèces cultivées, les
technologies utilisées, les systèmes de culture, l’environnement, les caractéristiques des
exploitations et les quantités de production respectives, et les principales questions (crédit,
maladies, impact environnemental, etc.).

Un formulaire Microsoft Excel carte NASO a été conçu pour faciliter la création des cartes
NASO. Ce manuel de l’utilisateur vise à faciliter le remplissage du formulaire. Le manuel
est destiné à tous les pays membres de la FAO qui soumettent des rapports sur les
statistiques aquacoles à la FAO et qui souhaiteraient entreprendre un inventaire et un suivi
de l’aquaculture. La collection des cartes NASO est développée par la Sous-Division de
l’aquaculture en collaboration avec la Sous-Division des statistiques et de l’information du
Département des pêches et de l’aquaculture de la FAO.

Aguilar-Manjarrez, J. & Crespi, V. 2013.
National Aquaculture Sector Overview map collection. User manual/Vues générales du
secteur aquacole national (NASO). Manuel de l’utilisateur. 65 pp.

                                                                                            33
TABLE DES MATIÈRES 1. AVANT DE COMMENCER 35 2. PAGE D’ACCUEIL 38 3. NAVIGATION 39 Enregistrement des domaines aquacoles sur la fiche «individual farms» (fermes individuelles) Option 1. Enregistrement des domaines aquacoles en utilisant un GPS Option 2. Enregistrement des domaines aquacoles en utilisant Google Option 3. Téléphones portables et caméras GPS Option 4. Enregistrement des domaines aquacoles en utilisant des cartes papiers Le système des coordonnées géographiques 4. COMMENT EFFECTUER DE NOUVEAUX ENREGISTREMENTS 46 Saisie de données – étape 1 Saisie de données – étape 2 Saisie de données – étape 3 ANNEXE 59 Terminologie et glossaire Abréviations et sigles 34
1. AVANT DE COMMENCER

Les formulaires NASO Excel sont conçus sur mesure pour chaque pays. La présentation
de la page d’accueil pourra être différente de ce qui se trouve dans ce manuel. Les options
disponibles dans chaque menu déroulant sur les fiches de saisie des données individuelles
pourraient aussi être différentes des illustrations qui se trouvent dans ce manuel. Les
instructions présentées dans ce manuel sont applicables à tous les formulaires Excel NASO.

Ouvrir le formulaire NASO Excel
Le formulaire Excel NASO contient plusieurs instructions informatiques (ou macros) et des
fonctions VBA (Visual Basic applications) pour faciliter la saisie des données et pour exporter
des données dans les tableaux des bases de données (dBASE) et/ou les dossiers en
language KML (Keyhole Markup Language) de Google Earth. Pour bien utiliser le formulaire,
vous devez activer ces macros lorsque vous ouvrez le fichier Excel.

Selon la version Excel utilisée, vous devrez procéder aux réglages décrits ci-dessous avant
de commencer à remplir le formulaire Excel.

Excel 2002
En Excel 2002 (de Microsoft Office XP), en ouvrant le fichier le message suivant s’afichera:

“Dans ce manuel, les macros sont désactivées parce que le niveau de sécurité est élevé,
et les macros n’ont pas été numériquement certifiées ou vérifiées comme étant sûres. Pour
exécuter les macros, vous pouvez les faire certifier ou changer votre niveau de sécurité.
Cliquez sur «Help» (Aide) pour plus d’informations.”

Il n’est pas nécessaire de «valider» les macros. Cette opération est complexe, et il est
beaucoup plus simple de changer votre niveau de sécurité pour activer les macros. Pour
activer les macros, cliquez sur le menu «Tools» (Outils), puis «Macros», ensuite «Security»
pour ouvrir votre fenêtre «Security». Sur l’onglet «Security Level» (Niveau de Sécurité),
réglez le niveau de sécurité sur «Medium»..

                                                                                             35
Cliquez sur l’onglet «Trusted Sources»
(Sources Sûres), puis cherchez «Trust
access to Visual Basic Project»:
Cliquez sur «OK» pour fermer la fenêtre. Sauvegardez le fichier Excel, fermez-le puis rouvrez-
le.
Excel 2003
Dans Excel 2003, lorsque vous ouvrirez le dossier, un message similaire à celui-ci
s’affichera
Le cas échéant, cliquez simplement sur
«Enable Macros» (Activer Macros)
pour ouvrir le dossier.
Alternativement, message suivant s’affichera:
Le texte dans la boîte d’avertissement en haut explique comment activer les macros dans
Excel 2003.
36Vous pouvez aussi lire


