APPORTS DU WEB-SCRAPING POUR UN SUIVI À HAUTE FRÉQUENCE DU MARCHÉ IMMOBILIER : LE CAS DU ROYAUME-UNI - J-C. BRICONGNE - CNIS
←
→
Transcription du contenu de la page
Si votre navigateur ne rend pas la page correctement, lisez s'il vous plaît le contenu de la page ci-dessous
APPORTS DU WEB-SCRAPING POUR UN SUIVI
À HAUTE FRÉQUENCE DU MARCHÉ IMMOBILIER :
 LE CAS DU ROYAUME-UNI
 CNIS – COMMISSION SYSTÈME FINANCIER ET FINANCEMENT DE L'ÉCONOMIE
 27 MAI 2021

 J-C. BRICONGNE
 BANQUE DE FRANCE
Messages principaux :

• Les données issues du web-scraping (téléchargement massif de données
 sur Internet) permettent un suivi granulaire [tout en veillant à la
 représentativité] et plus régulier des marchés immobiliers, et offrent un
 angle complémentaire, avec le point de vue des vendeurs

• Dans le cas du Royaume-Uni, le marché a été gelé pendant le premier
 confinement, avec un effondrement temporaire des offres postées, et
 une relative stabilité des prix (absolus) postés sauf sur Londres

• Les données de scraping sont cohérentes avec les sources officielles et
 permettent d’obtenir des prix en niveau, qui apportent de l’information
 par rapport aux indices, et permettent de mieux prévoir les
 retournements et d’estimer les stocks de richesse immobilière
Nombreuses informations publiques en temps réel sur les sites immobiliers au UK :
92 % des agences immobilières publient des annonces sur Internet

Exemples d’utilisation de données alternatives pour suivre le marché immobilier :
Kulkarni et al., 2009 avec les Google Trends ou web-scraping (par exemple Hanson
et Santas, 2014 ou Bricongne et al., 2019)

Le web-scraping offre le point de vue des vendeurs (par opposition avec les
transactions finales qui résultent de l’interaction entre vendeurs et acheteurs)

Couverture du marché UK dans cette période particulière de Covid-19 & Brexit,
sachant que l’approche peut être étendue à d'autres zones géographiques

Couverture des sites utilisés variable selon les régions, mais assez élevée dans tous
les cas pour assurer une bonne représentativité au niveau infra-national
Données récupérées par web-scraping des sites majeurs d’annonces
immobilières au UK : Rightmove, Zoopla et OnTheMarket.

Pour améliorer la couverture sur des régions plus spécifiques,
PropertyPal – un site immobilier spécialisé dans l’Irlande du Nord –
et S1Homes, son alter ego pour l'Écosse, sont également couverts.

Grâce à ces sites Web, plus de 1,5 million d’offres immobilières sont
téléchargées en moyenne chaque jour. Environ les deux tiers de ces
dernières sont des offres de vente (cf. tableau). Les données pour
Zoopla sont téléchargées (et nettoyées) depuis début mars 2020
alors que les données d'autres sites Web le sont depuis juillet 2020.
Nombre moyen d’offres web-scrapées par jour (par URL unique)

 Vente Location Vente Location
 Nom du site
 (résidentiel) (résidentiel) (commercial) (commercial)

Zoopla 300 000 200 000 15 000 35 000

Rightmove 500 000 200 000 20 000 25 000

OnTheMarket 250 000 100 000 5 000 10 000
Des nouvelles offres immobilières hebdomadaires en baisse très forte lors du premier
confinement et moindre lors du deuxième (en unités/semaine)

 Sources : Zoopla calculs des auteurs.
Un marché quasi gelé : offres encore disponibles après un mois sur Internet (à
 rapprocher d’une chute de 95% des transactions) (en unités)

 Sources : Zoopla, calculs des auteurs.
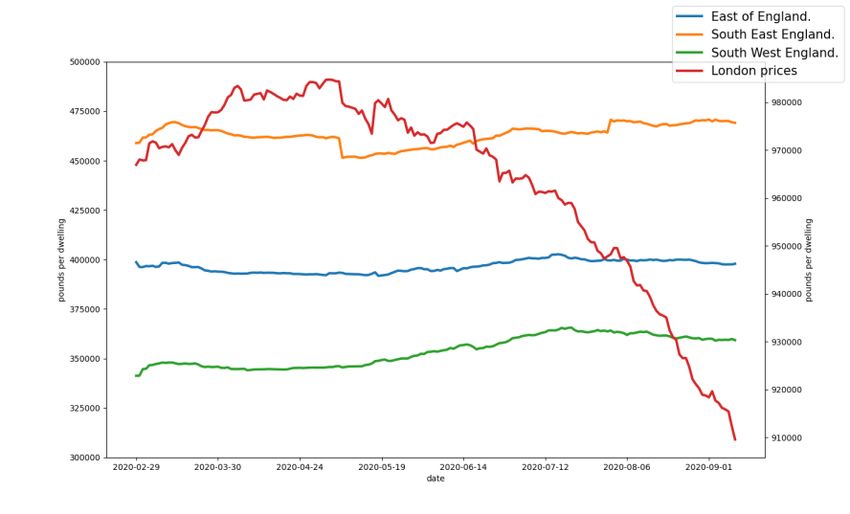
Prix de vente moyen affiché par région
 (en livres sterling par logement)

Sources : Zoopla et calculs des auteurs.
Les statistiques issues du web-scraping sont complémentaires des
statistiques officielles et permettent un suivi en temps réel et
granulaire.

De façon plus structurelle, elles permettent aussi un calcul de prix
(ou de loyers) en niveaux.

Les deux sources sont utiles notamment pour les banques centrales :
risques de retournement, stabilité financière…
ALTERNATIVE METHOD: FROM REALTORS /BIG DATA

LE WEB-SCRAPING PERMET UN CALCUL DE PRIX EN NIVEAU

Méthode basée sur données individuelles (web-scraping, voire transactions : IE, FR
ou MT), au niveau infra-national i (région, municipalité…) avec wi le stock de m2 :
 σ 2
 =1 ∗ é é
 = σ
 (2)
 =1

Avec prix moyen pondéré au m2i égal à la somme des prix divisée par la somme
des surfaces, equivalent à :
 σ =1 ∗ 2 ( )
 prix moyen pondéré au m2i =
 σ =1

 10
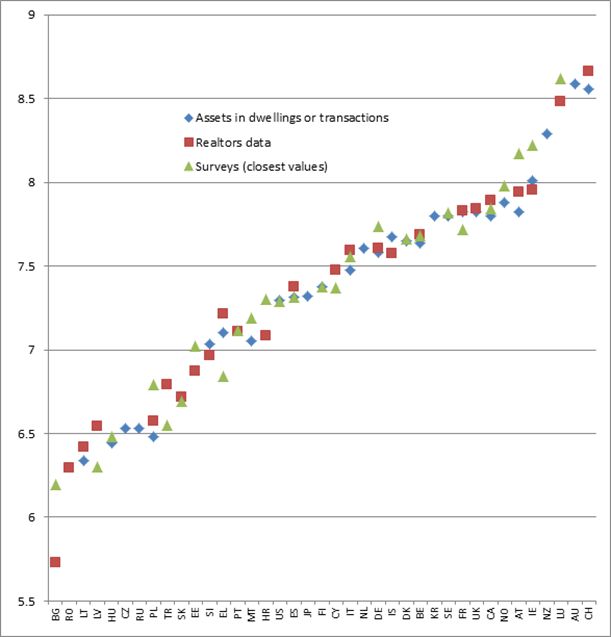
WEB-SCRAPING : DES ORDRES DE GRANDEUR COHÉRENTS
Quelques applications possibles :
• Estimer la richesse immobilière (nationale ou
 régionale), surtout dans les pays qui n’en publient
 pas
• Prévoir les retournements (information
 additionnelle par rapport aux indices) : prix sur
 revenu, capacité d’achat, marges de négociation si
 données de transactions sont publiées et les prix
 postés
Prolongement : le projet Alter Hous en liaison avec
le réseau REFINE :
• Proposer des statistiques alternatives (non
 officielles mais présentant des principes communs
 de fiabilité / représentativité) issues du web-
 scraping ou d’autres sources (satellites…) et des
 articles méthodologiques sur l’immobilier
• Projet commun avec la Commission européenne,
 l’OCDE, la Banque mondiale, l’AMSE, le LIEPP,
 l’ESRI irlandais…
CONCLUSIONS / PERSPECTIVES / ENJEUX

• Approfondir la comparaison avec les statistiques officielles, en gardant en tête les
 biais possibles (marges de négociation : quels écarts avec les derniers prix postés ?
 Travaux en cours)

• Extension aux loyers, au prix des terrains et à l’immobilier commercial (en cours)

• Utilisation de la granularité pour étudier les effets de certaines politiques

• Extension de l’approche à d’autres pays : travaux en cours avec la Banque mondiale

• Questions juridiques liées au web-craping et de sécurisation des sources, qui
 peuvent changer au cours du temps, voire disparaître…

 15
ANNEXES

 16
MOTIVATIONS
INFORMATION AVAILABLE PUBLICLY AND IN REAL-TIME

 Lags in official statistics … … but information publicly available

• Official statistics published only after month • Price information available publicly on real-
 end and often only aggregated at national estate website, in real-time, and with a high
 level or at large region level (Wales, Scotland, granularity
 Northern Ireland, and England – with
 potentially a rough decomposition of the
 latter ) • Evidence that a large share of offers are
 posted on the web (92% of realtors post their
 ads on those websites)
 New mortgage approvals
 House Price Index Land Registry data

 Current 7 Month 23 Month 30
 month (n) n+1 n+2

 Need for timely data Real-time housing price index
 (possibly more granular too)

 17
DATA
 WEB-SCRAPING

On each of the 5 websites (Zoopla, Rightmove, OnTheMarket, S1homes, and PropertyPal)

 Request all offers corresponding to a ZIP code
 Loop over all ZIP codes

 Scan the “results” web page to retrieve information for all available offers

 # of # of # of living Transaction Building Type of General
ZIP code City Address Surface Price
 bedrooms bathrooms rooms type type good description
 “Lovely flat with
E1 7A E London - 45 2 1 1 Auction New Flat 525,000
 large terrace”
 “Garage and safe
E1 7A E London - 130 5 2 1 Sale Ancient House 4,500,000
 neighbourhood”

 …
 “Balcony and view
E1 7A E London - - 2 2 2 Sale Ancient Duplex 850,000
 on Westminster”

 Around 1.5 million offers in total per day
 18
19
Price level (€/m2, from BIS, OECD, Eurostat, WidWorld, NSIs, central banks, censuses, other
 national sources, own calculations)

 20
21
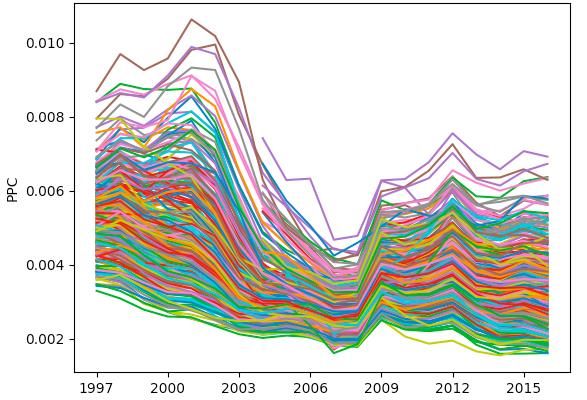
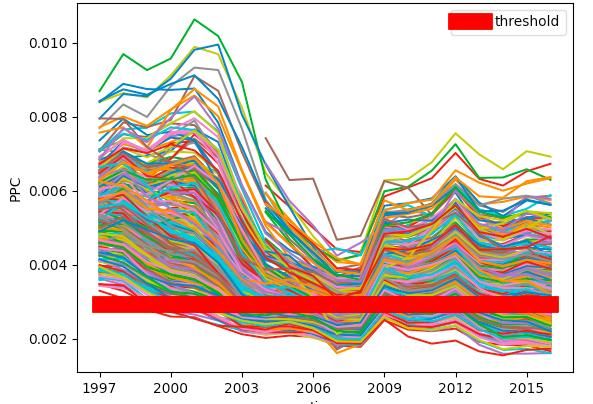
INDICATORS
PRICE-TO-INCOME RATIO & PURCHASING-POWER- CAPACITY

 Purchasing-power-capacity compared with threshold signalling an
 housing bubble – by locality
 Sources: ONS and authors’ calculation

 22
Part des offres dont le prix est révisé, selon le nombre de jours
 (en %)

 Sources : Zoopla, calculs des auteurs
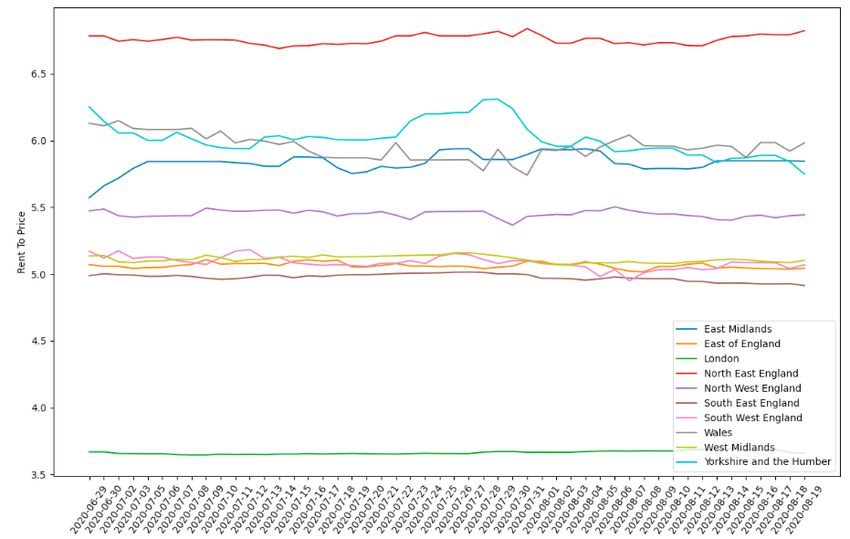
INDICATORS RENT-TO-INCOME RATIO Rent-to-price ratios – by region • Compare each rental offer with its K closest Sources: Zoopla and authors’ calculation sale offers using a K-nearest neighbor algorithm based on similar characteristics (location, surface, number of bedrooms, number of bathrooms, number of living rooms) 1 _ = 1 σ _ , • We fix K=10 as a result of a trade-off: increasing K results in comparing the rental offer with less and less similar dwellings, but a low K introduces a large variability in the index • Little variation during the crisis but large discrepancies across regions. In particular, very low ratio in London – might signal over- • To reflect the unequal coverage of our data, the valuation to some extent (in line with Marsden, ratio is estimated at local level then aggregated 2015 or Petris et al., in press) at national level weighing each regional index by the stock of dwellings in that region (source: ONS) • At national level, index around 5.1% 24
INDICATORS
PRICE-TO-INCOME RATIO & PURCHASING-POWER- CAPACITY

 Purchasing-power-capacity – by locality
 Sources: ONS and authors’ calculation
• Combine our dataset with ONS’ data on
 disposable income – also available to some
 extent at local level – to derive a price-to-
 income ratio = house price divided by
 disposable income

• However, as defined in the literature, price-to-
 income ratio does not consider the evolution
 of interest rates. Propose an alternative index
 (the purchasing-power-capacity) computed as:

 1
 = ∙ ∙ 1 −
 (1 + ) • Large discrepancies but historical evidence for
 a reversal in trend after the GFC
 = maximum effort rate (33%)
 • Empirically, find a higher signalling power
 = mortgage rate (source: BoE) (share of true detection of a forthcoming
 = price-to-income ratio housing crisis) for the PPC than for the price-to-
 income ratio generally used in the literature
 = median duration (15 years)

 25
DATA
DATA CLEANING

1• Ensure consistency across units (price in GBP, area in squared meters, rent as monthly
 amount), numeric (surface/price can given be as a range), and text data (lowering characters,
 lemmatisation) in order to enhance comparability across offers

2• Remove duplicates – which can arise even on the same website

3• Exclude commercial real-estate, miscellaneous offers (garage, land, mobile home, bungalow,
 etc.) and auctions (since the price displayed would be the reserve price)

4• Remove outliers by winsorising at 1%

5• Using natural language processing on the general description of the offer, add dummies to
 account for the presence of additional facilities (e.g. presence of a garage, a garden, or a
 terrace) that might a premium to the price

 26
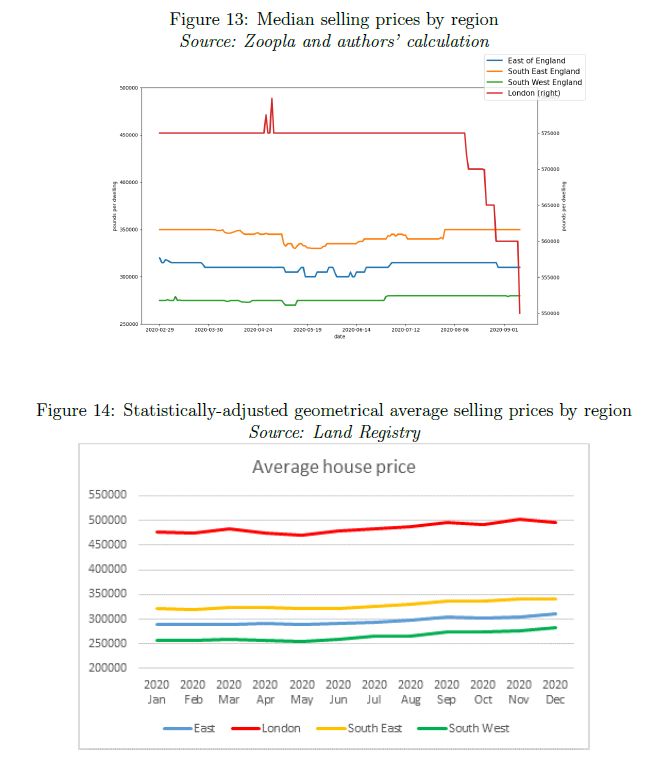
REAL-TIME MONITORING
UK DURING COVID-19 (3/4)

Selling price evolution – all UK Selling price evolution – by region
Sources: Zoopla and authors’ calculation Sources: Zoopla and authors’ calculation

• At national level: slight decrease from mid-February to the beginning of May (first lockdown), followed by a
 steady increase afterwards – with no apparent effect of the second lockdown

• At local level: steady decline in London since the end of the lockdown – in contrast with an increase in
 other regions (East England, South- East England, and South-West England).

• Looking at evolutions by quantiles shows that these patterns are shared across all categories of dwellings

 27
Table 5. Signalling: possible cases

 No crisis episodes (NCE) Crisis episodes (CE)
 Crisis signal False alert (FA) True positive signal
No crisis signal True negative signal Missed crisis (MC)
 Table 4. Threshold, signal power and other relevant statistics for price to income
 with crisis defined as a cumulated fall of prices of at least 5%
 and mean PTI calculated until the year under review

 % Missed # 2SD
 Signal % False alerts Size of the 2SD
 Threshold crises Crisisy lowerbou
 power (type 1 error) sample upperbound
 (type 2 error) ears nd

 (1) (3) (4) (5) (6) (7) (8) (9)
 Full sample
PTI in level 10.21 0.32 0.28 0.4 40 722 9.93 10.48
Max PTI over 3
previous years 10.95 0.44 0.21 0.35 34 680 9.84 12.06
PTI/whole
period mean PTI 1.03 0.26 0.39 0.35 40 722 0.93 1.13
PTI/real time
mean PTI 1.20 0.06 0.19 0.75 40 722 0.87 1.53
 Sample where the PTI of the first five years of each country are deleted
PTI in level 10.20 0.33 0.27 0.4 30 593 9.94 10.47
Max PTI over 3
previous years 10.95 0.49 0.18 0.33 27 538 10.44 11.46
PTI/whole
period mean PTI 0.96 0.22 0.55 0.23 30 593 0.81 1.11
PTI /real time
mean PTI 1.33 0.07 0.10 0.83 30 593 0.96 1.70
 Sample where the PTI of the first ten years of each country are deleted
PTI in level 10.19 0.39 0.24 0.37 19 452 9.93 10.44
Max PTI over 3
previous years 10.02 0.49 0.26 0.25 16 408 9.06 10.98
PTI/whole
period mean PTI 1.14 0.36 0.22 0.42 19 452 1.03 1.25
PTI /real time
 28
mean PTI 1.25 0.08 0.18 0.74 19 452 0.94 1.55
Vous pouvez aussi lire