Controverse: quelle imagerie à la phase aiguë d'un AVC ?
←
→
Transcription du contenu de la page
Si votre navigateur ne rend pas la page correctement, lisez s'il vous plaît le contenu de la page ci-dessous
J2N
                                                                               1er février 2019

Controverse: quelle imagerie à la phase aiguë d’un AVC ?

                            Imagerie “minimale”

                                 Pr Tae-Hee Cho

                                Hôpital Neurologique
            Fédération Hospitalo-Universitaire IRIS, Hospices Civils de Lyon

  CREATIS - Centre de Recherche en Acquisition et Traitement de l'Image pour la Santé
         CNRS UMR 5220, INSERM U1206, INSA de Lyon, Université de Lyon 1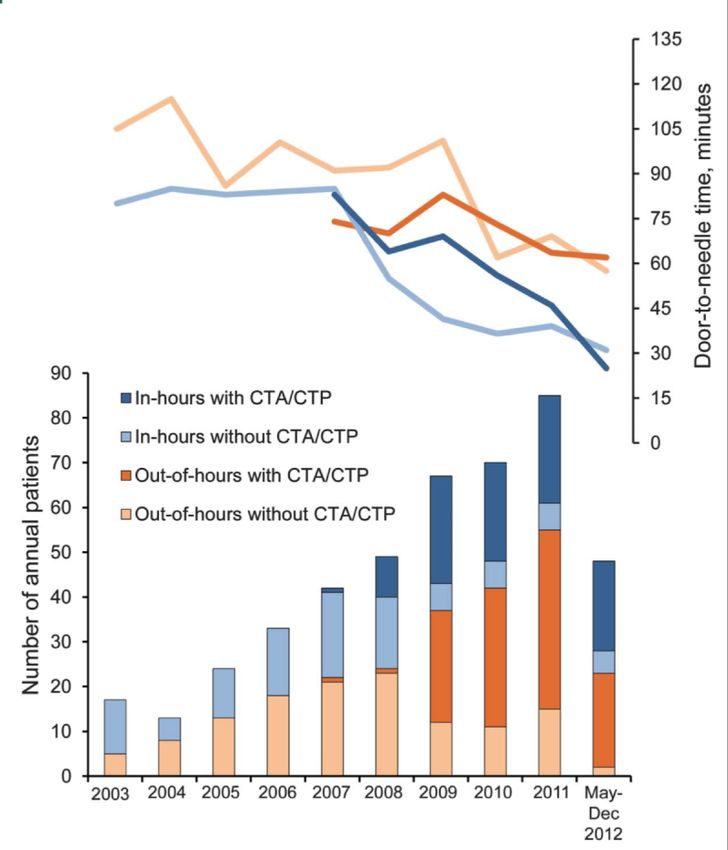
LIENS D’INTÉRÊT

  Bayer, ICOMED, Servier, Sanofi Pasteur MSD,
  UCB Pharma, TEVA Santé, Sophysa
hémiplégie D, aphasie

 Scanner sans injection de pdc
1h10 du début des symptômes
UNV - CHU DE LYON

En 2018

- 510 procédures de revascularisation aiguë dont 318 thrombectomies

- IRM: 81%

- perfusion en IRM: 90% patients avec IRM
IMAGERIE “MINIMALE” ?                              …SCANNER VS IRM

                      Protocole d’Helsinki
  délai intrahospitalier médian tPA IV: 20’ (14-32)

  - scanner sans pdc
  - angioscanner / perfusion:
IMAGERIE “MINIMALE” ? …PROTOCOLES EN 2019
Scanner IRM
Le minimum Le minimum
TDM cérébrale sans PDC Diffusion
Angioscanner cérébral et cervical T2*
FLAIR
3D TOF (cérébrale +/- ARM Gd cervicale)
Optionnel Optionnel
Imagerie de perfusion Imagerie de perfusion
Angioscanner multiphasique Segmentation du tissu à risque
Segmentation du tissu à risqueIMAGERIE “MINIMALE” ? …PROTOCOLES EN 2019
Scanner IRM
Le minimum Le minimum
TDM cérébrale sans PDC Diffusion
Angioscanner cérébral et cervical T2*
FLAIR
3D TOF (cérébrale +/- ARM Gd cervicale)
Optionnel Optionnel
Imagerie minimale
Imagerie de perfusion = sans
Imagerie
perfusion
de perfusion
Angioscanner multiphasique Segmentation du tissu à risque
Segmentation du tissu à risquePOURQUOI SIMPLIFIER ? …ALLER PLUS VITE
Hjort et al. Ann Neurol. 2005;58:462-5.
Saver. Stroke. 2006;37:263-6.
occlusion artérielle + 11 min +3h + 24 h
- 2 x 10⁶ neurones / minutePOURQUOI SIMPLIFIER ? …ALLER PLUS VITE
Hjort et al. Ann Neurol. 2005;58:462-5.
Saver. Stroke. 2006;37:263-6.
occlusion artérielle
= cible thérapeutiquePOURQUOI SIMPLIFIER ? …ALLER PLUS VITE ?
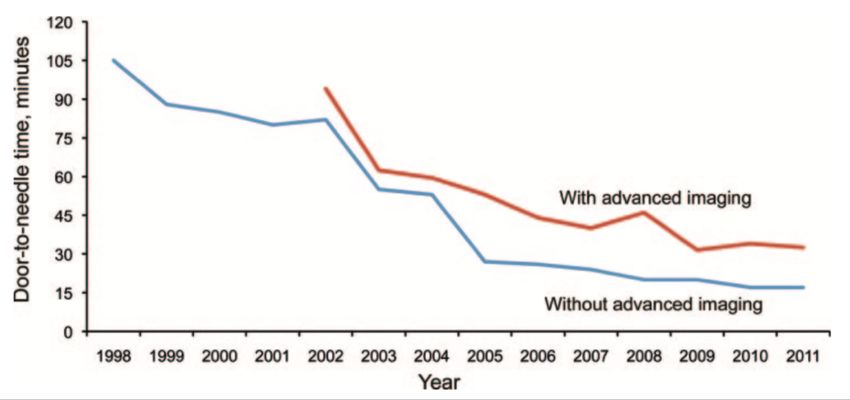
Protocole d’Helsinki Protocole d’Helsinki à Melbourne
délai intrahospitalier médian tPA IV: 20’ (14-32) délai intrahospitalier: 25’ (19-48)
>80% avec angioscanner+perfusion
- scanner sans pdc
- angioscanner / perfusion:IMAGERIE DE PERFUSION: POST-TRAITEMENT COMPLEXE
IMAGERIE DE PERFUSION: POST-TRAITEMENT COMPLEXE
IMAGERIE DE PERFUSION: POST-TRAITEMENT COMPLEXE

Straka et al. J Magn Reson Imaging. 2010;32:1024-1037.
472
       IRMStroke
             DE PERFUSION:
                 February 2009
                               SEUILLAGE NÉCESSAIRE
2010

                                                                   Figure 1. Region of interest analysis of
                                                                   positron emission tomography (PET)
                                                                   cerebral blood flow and perfusion-
                                                                   weighted Tmax. Circular regions of inter-
                                                                   est (10 mm) were manually drawn along
                                                                   the cortical rim and copied on the PET
                                                                   and perfusion-weighted imaging maps.
                                                                   Ventricles and periventricular white
                                                                   mater, large arteries, sinus, and areas of
                                                                   severely delayed contrast agent were
                                                                   excluded.
                                                             Figure 2. Illustration of the evolution of PWI lesion volumes according to Tmax delay. The patient, a 79-y
                                                             with intravenous tPA 340 minutes after symptom onset. She did not experience an FCR. Baseline MRI wa
                     Etudes TEP - IRM:
 ubsequent quantitative PET          as for all      patientstomtogether.
                                                                   onset. TmaxA color
                                                                                  linear
                                                                                               Etudes IRM longitudinales:
                                                             after symptom onset; the first follow-up MRI was 270 minutes after the start of treatment, and the final M
                                                                                            regression
                                                                                       scale:            analysisseconds
                                                                                              2 seconds!Tmax!4       was (blue); 4 seconds!Tmax!6 seconds (green);
 trokes and purecorrespondance
                     subcortical        entre les
                                     performed.                                                 seuils IRM de perfusion et
                                                             (yellow); 8 seconds!Tmax (red). A, On baseline DWI, lesion volume was 15 cm3. B, On baseline PWI, lesi
                                                             Tmax delay were as follows: Tmax "2 seconds#67 cm3; "4 seconds, 34 cm3; "6 seconds, 12 cm3; and
 patient paramètres
           population and IRMthe et le qCBF de la TEP                                        prédicCon de l’infarctus final
                                                             follow-up PWI, lesion volumes according to Tmax delay were as follows: "2 seconds, 97 cm3; "4 second
n previous publication by our        ROC Curve Analysis      cm3; and "8 seconds, 13 cm3. D, On final FLAIR, final infarct volume was 24 cm3.
  consent and the study was          The accuracy of Tmax to detect hypoperfusion was determined by a
 .                                   ROC curve analysis. and
                                                           19 infarct
                                                               We usedgrowth
                                                                          PETregardless of PF
                                                                                to define  the by
                                                                                                presence
                                                                                                    CBF or   absence of
                                                                                                           values             the relations between penumbra
                                                         reperfusion. For patients who do not experience reperfusion,         imaging outcomes in an attemp
                                     "20 mL/100 g/min.      In a first step, the ROC curve analysis was
                                                         substantial infarct growth and minimal penumbra salvage is           threshold provides the most ac
                                     performed for every patient separately. In a second step, the area
                                                         expected. In contrast, for patients with successful early            hypoperfused brain tissue.
ve been described in detail in
                         Précision similaire entre la plupart des paramètres IRM
g was performed on a 1.5-T
                                     under the ROC curve      (AUC)
                                     represents the probability   that a
                                                                        for Tmax
                                                                          ROI   will
                                                                                    was
                                                                                     be
                                                                                         identified.
                                                                                        correctly
                                                                                                      The   AUC
                                                         reperfusion, minimal infarct growth and substantial penumbra
                                                                                                    classified as
                                                         salvage is expected. On the basis of this premise, we assessed
                                                                                                                                 We hypothesized that the opti
                                                                                                                              the strongest correlations betw
ster; Best). PW images were          normal or abnormal as defined by PET–CBF "20 mL/100 g/min.
uences (repetition time, 1.3                    rTTP: 4-5 s
                                     The AUC is an important indicator      of the from
                                                                      Downloaded   PWIstroke.ahajournals.org
                                                                                        performance to detect at HOPITAL CARDIOVASCU ET PNEUMO on F
 slices; slice thickness, 6 mm;      the penumbral threshold independently from the selected cut-off
   cm). PET was performed in                     MTT: 5-6 s
                                     value. The closer the AUC is to 1, the better is the performance of the
HR Scanner (Siemens/CTI).            PWI map. In a third step, the best threshold for Tmax was defined                  Takasawa et al. Stroke. 2008;39:870-7.
 ode providing 47 contiguous
  half-maximum in plane-
                                                 T : 5-6 s
                                     separately for each patient as max the equal sensitivity and specificity Christensen et al. Stroke. 2009;40:2055-61.
                                                                                                                          Olivot et al. Stroke. 2009;40:469-75.
                                     threshold. The median and interquartile range (IQR) of these
 ous bolus injection of 15O-         individual thresholds as well as their sensitivity and specificity Zaro-Weber et al. Stroke. 2010;41:2817-21.
IRM MULTIMODALE
Infarctus vs Pénombre Niveau Risque
hématome ischémique d’occlusion hémorragique
diffusion core: DWI diffusion, T2*,
ARM
T2* pénombre: Tmax > 6s perfusionSCANNER MULTIMODAL
Infarctus vs Pénombre Niveau Risque
hématome ischémique d’occlusion hémorragique
core: CBF < 30%
pénombre: Tmax > 6s angioscanner scanner de
scanner
perfusion
Campbell et al. Stroke. 2011;42:3435-40.
Lin et al. Stroke. 2014;45:1727-32.
Campbell et al. N Engl J Med. 2015;372:1009-18.IMAGERIE DE PERFUSION
expertise pluridisciplinaire requise pour aller vite
estimation du tissu à risque: post-traitement chronophage et/ou coûteux
difficile à généraliser sur l’ensemble d’un territoire (UNV périphériques, SAU, CHU…)
scanner de perfusion & IRM de diffusion: intérêt incertain < 6 h
Campbell et al. Lancet Neurol. 2018.THROMBECTOMIE < 6H: ESSAIS CONTRÔLÉS Méta-analyse HERMES
N=1764 patients
7 essais (MR CLEAN, EXTEND-IA, ESCAPE, SWIFT PRIME, REVASCAT, PISTE, THRACE)
Critère d’inclusion en imagerie:
- score ASPECTS ≥ 6-7
- pas de critère sur l’estimation du tissu à risque (sauf EXTEND-IA, N=70)
Scanner de perfusion: N=591 (34%)
IRM de diffusion: N=309 (18%)
Campbell et al. Lancet Neurol. 2018;18:46-55.IMPORTANCE DU “CORE” ISCHÉMIQUE Méta-analyse HERMES
Etendue du core ischémique associé à un risque accru de handicap
↗ 10 mL core (scanner perfusion): OR mRS 0-2 = 0.77 (0.69-0.86)
↗ 10 mL core ~ +30 min délai imagerie-reperfusion
Bénéfice de la thrombectomie pour volumes > 70-100 mL
Patients sans mismatch (N=34; 6%): pas de bénéfice de la thrombectomie
Patients reperfusés (TICI 2b-3): âge, volume core, délai imagerie-reperfusion
associés au pronostic fonctionnel
Médiane core scanner: 10 mL (3-28) Médiane core DWI: 21 mL (10-52) Core scanner, mRS 0-2
Campbell et al. Lancet Neurol. 2018;18:46-55.APPROCHES SIMPLIFIÉES: MISMATCH ARM-DIFFUSION
occlusion proximale & DWI < 25 mL
occlusion distale & DWI < 15 mL
occlusion M1 & DWI < 50 mL
occlusion ACI ou M1 & DWI-ASPECTS ≥ 6
DAWN: ACI-T ou M1 & “core” < 21-51 mL
Lansberg et al. Stroke. 2008;39:2491-2496.
Mishra et al. Stroke. 2014;45:1369-1374.
Deguchi et al. J Stroke Cerebrovasc Dis. 2014;23:1471-1476.
Nogueira et al. N Engl J Med. 2018;378:11-21.APPROCHES SIMPLIFIÉES: MISMATCH CLINIQUE-DIFFUSION
Score NIHSS ≥ 8 & DWI ≤ 25 mL
- identification des personnes avec risque accru de détérioration neurologique
précoce et de croissance lésionnelle
- spécificité 93%, sensibilité 53% pour détection mismatch perfusion-diffusion
Dávalos et al. Neurology. 2004;62:2187-2192.
Prosser et al. Stroke. 2005;36:1700-1704.
Thrombolyse IV (occlusions proximales et distales)
- Mismatch perfusion-diffusion plus précis que le m. clinique-diffusion
- Pas d’impact du mismatch clinique-diffusion sur l’évolution clinique ni
croissance lésionnelle (étude contrôlée EPITHET)
Lansberg et al. Stroke. 2007;38:1826-1830.
Ebinger et al. Stroke. 2009;40:2572-2574.
Occlusions proximales: approche utilisée dans DAWN
- âge ≥ 80 ans: NIHSS ≥ 10 & core < 21 mL
- âge < 80 ans: NIHSS ≥ 10 & core < 31 mL ou NIHSS ≥ 20 & core < 51 mL
Nogueira et al. N Engl J Med. 2018;378:11-21.APPROCHES SIMPLIFIÉES: COLLATÉRALES EN ANGIOSCANNER
Menon et al. Radiology. 2015;275:510-520.
Critère d’exclusion dans l’étude ESCAPE:
Collatérales corticales visibles < 50% territoire ACM (vs côté sain)
Goyal et al. N Engl J Med. 2015;372:1019-30.APPROCHES SIMPLIFIÉES: ARTÉRIOGRAPHIE PRIMAIRE
Etude cas - témoins
Artériographie directe si NIHSS >10 et salle angio disponible sans délai
Angio rotationnelle pour exclure hématomes
Cas: N= 79
Témoins: N=145, appariement pour l’âge, score NIHSS, niveau d’occlusion,
délai symptômes-admission
P=0.05
Mendez et al. Stroke. 2018;49:2723-2727.REPERFUSION CÉRÉBRALE EN 2019 Occlusions distales: tPA IV - < 4h30 - absence d’horaire mais présence d’un mismatch FLAIR-DWI Occlusions proximales (M1): tPA IV + thrombectomie - core ischémique limité (< 1/3 territoire ACM) - certains patients entre 6-24h: sélection par scanner de perfusion/IRM de diffusion - thrombectomie seule si contre-indication au tPA
CONCLUSION: IMAGERIE “MINIMALE”

               Scanner                                        IRM

  TDM cérébrale sans PDC                       Diffusion
  Angioscanner cérébral et cervical            T2*
                                               FLAIR
                                               3D TOF (cérébrale +/- ARM Gd cervicale)

     Suffisante pour la majorité des situations cliniques < 6 h

     Imagerie de perfusion à réserver pour certaines situations:
       - déficit d’horaire inconnu et occlusion proximale
       - déficit > 6 h et occlusion proximale
hémiplégie D, aphasie Scanner sans injection de pdc 1h10 du début des symptômes
hémiplégie D, aphasie

    Salle d’angiographie
➜   Thrombectomie
Un autre cas très facile…
H 87 ans
“Malaise”, PF centrale G isolée
Admission aux urgences sans régulation 15
IRM faite depuis urgences >4h30
H 87 ans
“Malaise”, PF centrale G isolée
Admission aux urgences sans régulation 15
IRM faite depuis urgences >4h30

                             IRM considérée comme sans argument pour un AVC
                                                                   Méningiome
                                     ARM cervicale prévue initialement non faite
                                                Avis neurochirurgical demandé
IRM de perfusion:
Détection aisée des occlusions distales
(autre patient)Vous pouvez aussi lire