IOC/EC-LI/2 Annexe 6 Distribution limitée - Unesco
←
→
Transcription du contenu de la page
Si votre navigateur ne rend pas la page correctement, lisez s'il vous plaît le contenu de la page ci-dessous
IOC/EC-LI/2 Annexe 6
                                                       Distribution limitée
COMMISSION OCÉANOGRAPHIQUE
INTERGOUVERNEMENTALE
(de l'UNESCO)
                                                       PARIS, le 13 juin 2018
                                                       Original anglais
Cinquantième et unième session du Conseil exécutif
UNESCO, Paris, 3-6 juillet 2018

Point 4.4 de l’ordre du jour provisoire révisé

   SUIVI DU RÔLE D’ORGANISME RESPONSABLE CONFIÉ À LA COI
        CONCERNANT CERTAINS INDICATEURS DE L’ODD 14

                                     Résumé

  Dans sa décision XXIX/9.1, l’Assemblée de la COI a pris note de la mission
  de la Commission en tant qu’organisme responsable pour les indicateurs
  spécifiques de l’ODD 14, en particulier dans le cadre des cibles 14.3 et 14.a.
  Cela signifie que la COI est chargée de mettre au point une méthodologie
  et de mesurer ces indicateurs des ODD à l’échelle mondiale. D’autre part,
  l’Assemblée s’est félicitée de la méthode proposée pour l’indicateur 14.a.1
  et a prié le Secrétariat de finaliser la méthode pour l’indicateur 14.3.1 en
  vue de la soumettre à l’examen du Conseil exécutif de la COI à sa
  51e session.

  Objet du document : Le présent document donne une vue d’ensemble des
  travaux engagés par le Secrétariat de la COI afin d’avancer dans
  l’élaboration d’une méthodologie et dans la collecte de données pour les
  indicateurs placés sous la responsabilité de la Commission, ainsi que pour
  ceux au titre desquels elle apporte un soutien technique à d’autres
  institutions du système des Nations Unies. Plus précisément, la
  méthodologie relative à l’indicateur 14.3.1 est présentée dans l’appendice
  du présent document (en anglais uniquement). Le Conseil exécutif est invité
  à prendre note de cette méthodologie, et à en recommander la présentation,
  au cours du second semestre 2018, au Groupe d'experts des Nations Unies
  et de l'extérieur chargé des indicateurs relatifs aux objectifs de
  développement durable.

  Les incidences financières et administratives sont présentées au
  paragraphe 14.

  La décision proposée porte la cote EC-LI/4.4 dans le Document relatif aux
  décisions à adopter (document IOC/EC-LI/2 Prov.).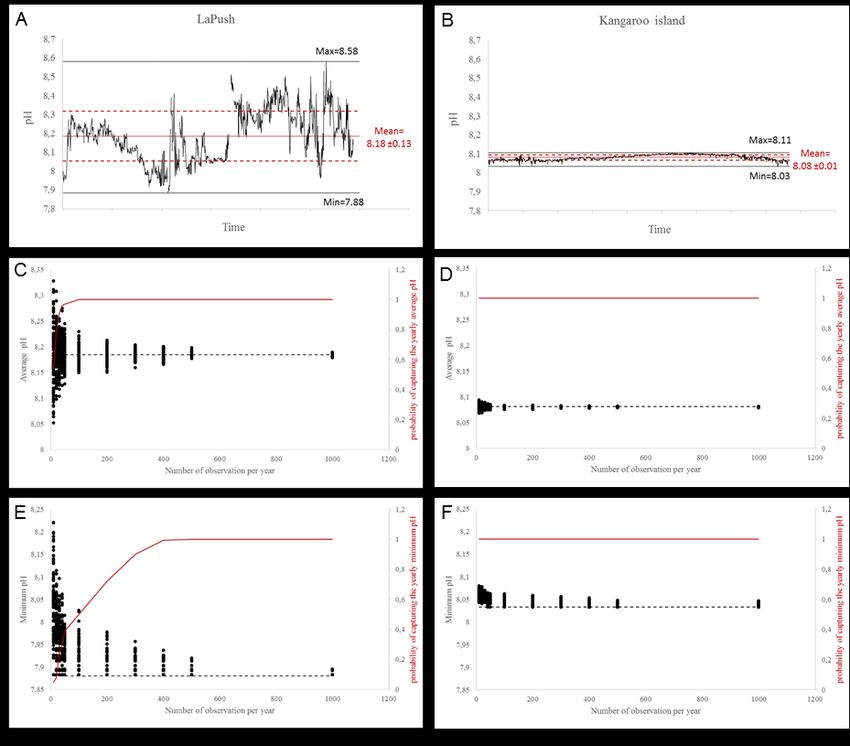
IOC/EC-LI/2 Annexe 6

Introduction

1.    En 2015, l’ONU a adopté le Programme 2030 et un ensemble d’Objectifs de développement
durable (ODD), incluant un objectif consacré aux océans, l’ODD 14, qui appelle à « conserver et
exploiter de manière durable les océans, les mers et les ressources marines aux fins du
développement durable ». Cela constitue un point de référence essentiel pour l’action que mène la
COI aux côtés de ses États membres, ainsi que pour ses programmes aux niveaux mondial, régional
et national.

2.    À sa 49e session, le Conseil exécutif de la COI a estimé, dans sa décision EC-XLIX/4.1, que
la Commission devait apporter un « soutien normatif aux pays dans la mise en place, l’exécution et
le suivi d’activités de mise en œuvre de l’ODD [14] sur les océans et des cibles correspondantes
[…], ainsi que dans la présentation de rapports en la matière ».

3.    Le 6 mars 2015, à sa 46e session, la Commission de statistique de l’ONU a créé le Groupe
d'experts des Nations Unies et de l'extérieur chargé des indicateurs relatifs aux objectifs de
développement durable, composé d’États membres, et l’a chargé des tâches suivantes : (i) élaborer
un cadre d’indicateurs pour le suivi et l’examen des objectifs et des cibles du Programme 2030 au
niveau mondial ; (ii) fournir une assistance technique pour l’application des indicateurs et du cadre
de suivi adoptés pendant les 15 années qui s’écouleront jusqu’en 2030 ; et (iii) examiner
régulièrement les nouveautés et les questions méthodologiques relatives aux indicateurs et à leurs
métadonnées.

4.    En 2016, le Groupe d’experts est convenu d’une liste d’indicateurs pour tous les ODD, laquelle
a été approuvée par la Commission de statistique de l’ONU. La COI a été désignée organisme
responsable pour deux cibles de l’ODD 14 et les indicateurs associés, à savoir l’acidification des
océans (cible 14.3) et la recherche scientifique marine (cible 14.a). Une classification par catégorie
a été mise en place afin d’évaluer le caractère opérationnel de chaque indicateur des ODD, de la
catégorie III (indicateurs pour lesquels on ne dispose pour le moment d’aucune méthode de calcul
arrêtée au niveau international) à la catégorie I (indicateurs clairement définis sur le plan conceptuel,
pour lesquels on dispose d’une méthode de calcul arrêtée au niveau international et des données
sont régulièrement collectées pour au moins 50 % des pays). Les indicateurs à la charge de la COI
sont les suivants :

      Indicateur 14.a.1 : Proportion du budget total de la recherche allouée à la recherche sur les
      techniques marines ;

      Indicateur 14.3.1 : Acidité moyenne des mers (pH) mesurée à plusieurs points de prélèvement
      représentatifs.

5.    La COI a également été désignée organisme chargé d’apporter une assistance technique pour
deux autres cibles et leurs indicateurs, à savoir la cible 14.1 relative à la pollution marine et la cible
14.2 sur les écosystèmes marins et côtiers, qui relèvent toutes deux du Programme des Nations
Unies pour l’environnement (PNUE). Les indicateurs associés à ces deux cibles sont les suivants :

      Indicateur 14.1.1 : Indicateur du potentiel d’eutrophisation côtière (ICEP) et densité des débris
      de plastiques flottant en surface des océans ;

      Indicateur 14.2.1 : Proportion de zones économiques exclusives nationales gérées en utilisant
      des approches écosystémiques.

Progrès accomplis dans l’élaboration de méthodologies

6.    Le soutien technique apporté par la COI inclut l’élaboration d’une méthode commune pour le
calcul des différents indicateurs des ODD, ainsi que la définition de normes applicables à la collecte
des données des États membres et à la communication de ces données, à l’échelle mondiale, à la
Division de statistique de l’ONU. Pour chaque indicateur, la méthode englobe : des définitions, une
IOC/EC-LI/2 Annexe 6 – page 2
technique d’échantillonnage, des recommandations pour la réalisation de mesures, le contrôle
qualité, l’analyse et la visualisation des données, et des éléments relatifs aux données à
communiquer.
Indicateur 14.a.1
7. En 2017, sur la base de la méthode testée dans le cadre du Rapport mondial sur les sciences
océaniques et suite à la décision XXIX/9.1, l’Assemblée de la COI a approuvé la méthode proposée
pour l’indicateur 14.a.1 (annexe 3 du document IOC-XXIX/2 Annexe 14). Par la suite, la COI a
demandé au Groupe d'experts des Nations Unies et de l'extérieur chargé des indicateurs relatifs aux
objectifs de développement durable de faire passer cet indicateur à la catégorie supérieure : la
catégorie II (indicateur clair sur le plan conceptuel, doté d’une méthodologie et de normes établies
à l’échelle internationale, mais pour lequel la production de données par les pays n’est pas
régulière). Le Groupe d’experts a accepté le reclassement de cet indicateur à sa 6e réunion en
novembre 2017. Les futures collectes de données concernant cet indicateur seront encouragées
dans le cadre de la deuxième édition du Rapport mondial sur les sciences océaniques, prévue en
2020, et du portail de données associé élaboré avec le soutien de l’IODE. Si un nombre suffisant
d’États membres font rapport sur cet indicateur, le reclassement de l’indicateur à la catégorie I pourra
être demandé.
Indicateur 14.3.1
8. Le Réseau mondial d'observation de l'acidification de l'océan (GOA-ON) et d’autres
spécialistes de ce domaine fournissent des conseils techniques pour élaborer la méthode de calcul
de cet indicateur, qui est toujours classé en catégorie III. La réunion d’experts tenue à la COI en
janvier 2018 sur ce sujet a donné lieu à la préparation d’un projet de méthodologie. En coopération
avec l’IODE, une enquête a été menée pour évaluer les capacités des centres nationaux de données
océanographiques (CNDO) de stocker et de fournir des données relatives à l’indicateur 14.3.1.
D’autres examens ont été effectués par des experts entre mars et mai 2018 et le Conseil exécutif
du GOA-ON a validé la méthodologie présentée à l’appendice du présent document.
9. La méthodologie indique aux chercheurs et aux pays quelles mesures de l’acidification des
océans et des paramètres associés effectuer, où et selon quelles modalités. La méthodologie
proposée indique également comment communiquer les informations recueillies de manière
transparente et traçable. La méthodologie établie en collaboration avec l’IODE nous permettra de
partager des données sur l’acidification des océans particulièrement utiles pour les PMA et les PEID,
qui disposent à l’heure actuelle de capacités limitées dans ce domaine.
10. La prochaine étape inclura un exercice pilote de collecte de données s’appuyant sur des
données et métadonnées en accès libre hébergées par les CNDO et les unités de données
associées de l’IODE, en collaboration avec le portail de données GOA-ON. Sur la base de cet
exercice, il sera demandé au Groupe d'experts des Nations Unies et de l'extérieur chargé des
indicateurs relatifs aux objectifs de développement durable, à sa session d’automne, de faire passer
cet indicateur à la catégorie II.
Indicateur 14.1.1
11. Par ailleurs, la COI appuie directement les travaux visant à élaborer l’Indicateur du potentiel
d’eutrophisation côtière (ICEP) et de la densité des débris de plastiques flottant en surface des
océans en tant qu’indicateur pour la cible 14.1 relative à la pollution par les nutriments des
écosystèmes marins côtiers.
12. Combiner les informations relatives à la charge en nutriments d’origine terrestre et les
informations concernant la proportion de nutriments d’origine terrestre (ICEP) permet d’évaluer le
risque d’apparition de problèmes tels que l’hypoxie/anoxie côtière, les efflorescences toxiques, etc.
L’un des avantages que présente l’ICEP par rapport à la chlorophylle-a en tant qu’indicateur de laIOC/EC-LI/2 Annexe 6 – page 3
qualité des eaux côtières est le fait qu’il signale la probabilité d’épisodes d’efflorescences algales
nuisibles tandis que la chl-a signale seulement la quantité de phytoplancton présent. Le fait d’utiliser
l’ICEP comme indicateur de l’eutrophisation des zones côtières permet en outre d’utiliser les
modèles de charges en nutriments pour combler les lacunes en termes de données spatiales (par
exemple, en estimant l’ICEP pour les grands écosystèmes marins – LME – où aucune donnée n’a
été collectée en ce qui concerne les nutriments) et pour étudier des scénarios d’avenir et
d’éventuelles mesures de réduction des nutriments. Cela rendra possible la réalisation de synthèses
régionales et mondiales plus complètes et de meilleure qualité que celles pouvant être réalisées à
l’heure actuelle en utilisant la chl-a comme indicateur et, de ce fait, l’élaboration de rapports plus
informatifs et de meilleur qualité au titre de l’indicateur 14.1.1.
13. Le travail effectué pour faire passer l’ICEP à la catégorie supérieure est coordonné par la COI
pour le PNUE, organisme responsable de l’indicateur 14.1.1. Sans ce travail, il serait impossible
d’adapter l’ICEP à une application mondiale pour l’établissement de rapports nationaux sur l’ODD
14. Un atelier a été organisé en décembre 2017 pour déterminer le travail à réaliser pour mettre
définitivement au point l’ICEP pendant la période 2018-2019, sous réserve de la disponibilité des
financements nécessaires. Pour pouvoir calculer la situation et l’évolution d’un pays au regard de
l’Indicateur du potentiel d’eutrophisation côtière (ICEP), il convient d’adopter une approche
opérationnelle en suivant les étapes suivantes :
(i) élaborer une méthode mondiale pour le calcul de l’évolution passée (de 1970 à nos
jours) et future (d’aujourd’hui à 2050 sur la base des Orientations socioéconomiques
communes – Shared Socioeconomic Pathways –, qui constituent actuellement les
scénarios de changement planétaire les plus utilisés) de l’ICEP avec une résolution
temporelle et spatiale adéquate ;
(ii) évaluer les simulations de prévisions de l’ICEP en les comparant avec les valeurs
mesurées de l’Indicateur, sur la base des concentrations ou charges en nutriments
(azote, phosphore et silice) observées ;
(iii) évaluer la capacité de l’ICEP de signaler les épisodes d’efflorescences algales nuisibles
en comparant les valeurs de l’ICEP observées et celles prévues par les modèles avec
les épisodes d’efflorescences algales nuisibles survenus dans des régions de
démonstration.
Incidences financières et administratives
14. Les tâches liées à l’élaboration de méthodologies et à l’échange de données pour les
indicateurs des ODD devraient être en partie intégrées dans le programme de travail de la Section
des politiques marines et de la coordination régionale (MPR) de la COI, de sa Section des sciences
océaniques (OSS) et de l’IODE au titre de l’actuel Programme et budget (39 C/5).
15. Toutefois, des ressources extrabudgétaires supplémentaires sont nécessaires pour :
(i) maintenir/conduire/développer la communication/l’archivage/le contrôle qualité des
données pour les indicateurs 14.3.1 et 14.a.1 (estimation : 200 000 dollars des États-
Unis pour deux ans) ;
(ii) élaborer la méthodologie relative à l’indicateur 14.1.1 en soutenant deux postes de
chercheurs postdoctoraux au sein d’universités partenaires (estimation : 385 000 dollars
des États-Unis pour deux ans).IOC/EC-LI/2 Annexe 6 – page 4 Décision proposée 16. À la lumière de ce qui précède, le Conseil exécutif de la COI souhaitera peut-être examiner le projet de décision EC-LI/4.4 proposé dans le Document relatif aux décisions à adopter (document IOC/EC-LI/2 Prov.).
IOC/EC-LI/2 Annexe 6 – page 5

                                               APPENDICE

                       MÉTHODOLOGIE RELATIVE À L’INDICATEUR 14.3.1

Indicator Description 14.3.1 – Average marine acidity (pH) measured at agreed suite of
representative sampling stations.
Target

14.3: Minimize and address the impacts of ocean acidification, including through enhanced
scientific cooperation at all levels.
Tier level

Tier III - No internationally established methodology or standards are yet available for the indicator,
but methodology/standards are being (or will be) developed or tested.
Definition

This indicator is based on observations that constrain the carbon system, which are required to
capture the variability in ocean acidity at locations providing ocean services. The carbon system in
this context refers mainly to the four measurable parameters: pH (the concentration of hydrogen
ions on a logarithmic scale), CT (total dissolved inorganic carbon), pCO2 (carbon dioxide partial
pressure), and AT (total alkalinity). Ocean acidification is a reduction in the pH of the ocean over
an extended period of typically decades or longer, which is caused primarily by uptake of carbon
dioxide from the atmosphere1. Ocean services are the benefits the ocean provides to people,
which may be recreational, economic, environmental (by providing coastal protection) or cultural.
Average2 as used herein is the equally weighted annual mean.
A agreed suite of representative sampling stations are sites that: 1) have a measurement
frequency adequate to describe variability and trends in carbonate chemistry to deliver critical
information on the exposure of and impacts on marine systems to ocean acidification, 2) provide
data of sufficient quality and with comprehensive metadata information to enable integration with
data from other sites in the country.
Unit

pH on total scale
and/or pCO2 [µatm or ppt], CT [µmol kg-1], AT [µmol kg-1]
Rationale for inclusion

The ocean absorbs up to 30% of the annual emissions of anthropogenic CO2 to the atmosphere,
helping to alleviate the impacts of climate change on the planet. However, this comes at a steep
ecological cost, as the absorbed CO2 reacts with seawater and results in shifts in the dissolved
carbonate chemistry including increased acidity levels in the marine environment (decreased
seawater pH). The observed changes have been shown to cause a range of responses at the
organism level that can affect biodiversity, ecosystem structure and food security. For example, a
decrease in dissolved carbonate reduces the solubility of carbonate minerals including aragonite

1
       The International Panel on Climate Change (IPCC) Workshop on Impacts of Ocean Acidification on
       Marine Biology and Ecosystems (2011, p. 37) defines Ocean Acidification (OA) as “a reduction in the
       pH of the ocean over an extended period, typically decades or longer, which is caused primarily by
       uptake of carbon dioxide from the atmosphere, but can also be caused by other chemical additions or
       subtractions from the ocean.”
2      Although this indicator requests “average acidity” values from nations, the complete data set (which
       comprises the average) will provide valuable insight into the variability of the measurements
IOC/EC-LI/2 Annexe 6 – page 6
and calcite, the two main forms of calcium carbonate used by marine species to form shells and
skeletal material (e.g. reef building corals and shelled molluscs). Aragonite is the more soluble
form and its availability for shell building by organisms such as corals and oysters, called the
aragonite saturation state [Ω (aragonite)], is used together with pH as an indicator in tracking the
progression of ocean acidification. In addition, of equal importance to some key marine organisms
is the dissolved CO2 and bicarbonate concentration. It is, therefore, of the upmost urgency that a
full categorization of the changing carbonate system is delivered.
Regular observations of marine acidity at open-ocean locations over the past 20-30 years have
revealed a clear trend of decreasing pH and that present-day conditions are often outside
preindustrial bounds. Observational trends in coastal areas have been reported to be more difficult
to determine. In some regions, the changes are amplified by natural processes like upwelling
(whereby cold, often CO2 and nutrient rich, water from the deep rises toward the sea surface). In
addition, other factors, including freshwater run-off, ice-melting, nutrients, biological activity,
temperature change and large ocean oscillations influencing carbon dioxide levels, particularly in
coastal waters need to be taken into account when interpreting drivers of ocean acidification and
the related impacts.
Ocean acidification has potentially direct consequences for marine life and cascades through to the
services provided by the open ocean and coastal areas including food and livelihood, tourism,
coastal protection, cultural identity, transportation and recreation. The impacts on ocean services
from ocean acidification may be lessened through appropriate monitoring and improved
understanding of variability and rates of change, helping to inform mitigation and/or adaptation
strategies.
Although this indicator requests “average acidity” values from nations, the data which comprises
the average ought to provide insight into the variability of the measurements, which is more
relevant for the impact on marine life. In other words, species do not respond to “average”
conditions, but to real time conditions. At a minimum, the total range (minimum and maximum
values) should be reported in addition to the average.
Coastal countries often have long-term monitoring of water quality, including information on
nutrient concentrations, temperature, salinity and occasionally carbonate chemistry. These water
quality monitoring sites provide historical context about biogeochemical variability of the system
and should be considered ideal location for ocean acidification monitoring. Additional sites may
also need to be established to characterize variability.
The data variables associated with the monitoring of ocean acidification (variables include pH,
carbon dioxide partial pressure [pCO2], total dissolved inorganic carbon [CT], and total alkalinity
[AT]) have the potential to serve global, national, regional, and local data needs, such as tracking
the exposure of marine ecosystems and aquaculture sites to corrosive 3 conditions, and identifying
opportunities to reduce ecosystem and economic vulnerability to ocean acidification. For example,
local monitoring of pH and aragonite saturation state on the Pacific coast of the United States has
enabled shellfish farmers to adapt to damaging conditions present during upwelling events, which
reduce pH and threaten brood stock.
3 Aragonite saturation values below 1.0 in seawater are often referred to as corrosive conditions,
dissolution of pure aragonite and unprotected aragonite shells will begin to occur (Feely, R. A., Byrne,
R. H., Acker, J. G., Betzer, P. R., Chen, C. T. A., Gendron, J. F., & Lamb, M. F. (1988). Winter-
summer variations of calcite and aragonite saturation in the northeast Pacific. Marine Chemistry,
25(3), 227-241.).IOC/EC-LI/2 Annexe 6 – page 7 Measurement methods and calculation – in development Tier III Computation Method As mentioned in the definition paragraph, this indicator calls for the collection of multiple observations (individual data points) so as to capture the variability in ocean acidity. Individual data points for pH (hydrogen ion concentrations on a logarithmic scale) that are measured either directly or calculated based on data of two other parameters - AT, CT, pCO2 - will be provided by countries and/or data providers designated by countries. Average pH is the annual equally weighted mean of multiple data points at representative sampling stations (see Definition). The exact number of samplings and therefore data points varies depending on the natural variation of ocean acidity at the site(s); the minimum should be the number of measurements needed to characterize the seasonal cycle for the site (Box 1). Higher frequency measurements (e.g. daily) using calibrated autonomous sensors may be useable in some locations to characterise shorter term variability that can be as significant in influencing ecosystem impacts. In addition to the data value, standard deviation and the total range (minimum and maximum values) of replicates should be reported, along with the underlying data used to provide traceability and transparency (metadata information). In order to include calculations about the rate of change and to compare natural variability and anthropogenic alterations, available historical data should be released. 4 (IOC guidelines on data sharing). National data sets should be reported annually (see Data collection, Data sources paragraphs). The first assessment in 2018 will include first-level quality controlled data, since and including 2010 (all of the years or a subset). Disaggregation Countries provide complete data sets with respective site-specific data and metadata files. Regional aggregates Every country will provide annually updated national data sets. Aggregation across nations will require that data of similar quality and metadata with site-specific information and information on parameters be reported. Given the variability in ocean acidification measurements across coastal habitat types, aggregated averages (equally annual mean) across habitat types will be difficult to decipher and are thus discouraged. Regional aggregates according to the IAEG SDG Regional groupings as used in 2017 Report and Statistical Annex, will refer to change of ocean acidification to the previous year (equal +/- 5%; increase in ocean acidification > 5% (pH decrease), decrease in ocean acidification
IOC/EC-LI/2 Annexe 6 – page 8

Sources of discrepancies

As this indicator only takes into account data submitted by Member States, there are no
discrepancies between estimates and submitted data sets.
What to report

The 14.3.1 data and metadata files give detailed information about the requested data and
metadata to report. Data and metadata files contain compulsory variables to be reported and
additional variables to be included if available.
Data providers/Member States are encouraged to submit primary quality controlled data sets of
two variables characterizing the carbonate system: pH, AT, CT or pCO2, plus precise location,
temperature, salinity and hydrostatic pressure (depth) (see Quality control). Depending on data
quality, different categories will be assigned to the submitted data sets. In addition, corresponding
macro nutrient concentrations are requested, if nitrate, phosphate and silicate data are available
(see Data quality).
Further, data providers will be invited to submit all data, independent of where the data were
collected within the water column; however, they are encouraged to provide surface data (≤ 10 m),
to be visualized in the ocean acidification Map 2 (see Data visualization).
Sampling strategy

A sampling strategy will need to be developed or adapted for each sampling site. It is envisaged
that new observation sites will be created at locations providing ocean services or marine products
that are potentially vulnerable to ocean acidification and on which the countries and their
communities rely. It is strongly advised that, in order to understand the context of measurements
and to leverage existing infrastructures, sites where long-term water quality monitoring has been
conducted should be considered for additional ocean acidification monitoring. These sites can
provide the historical context with respect to water quality, ecosystem productivity, change in highly
vulnerable habitats e.g. corals, and/or provide relative baselines for biodiversity. The utilisation of
existing monitoring sites may also facilitate the development of algorithms/proxies that can be used
to extend the time series back even at newly established sites with similar conditions. These sites
are not always optimal for ocean acidification monitoring and additional sites should be added to
characterise variability if needed.
The development of sampling strategies will need to consider the following items: 1. Question and
expected outcome, 2. Constraints and opportunities, 3. Data needs, 4. Methodology and
Instrumentation (Figure 1).
Each of these items requires an individual assessment (guidelines presented below) in order to
obtain an appropriate sampling strategy, tailored to local and national demands and possibilities.
IOC/EC-LI/2 Annexe 6 – page 9

            Figure 1. Sampling strategy flow chart for ocean acidification observations.

1.    Question/expected outcome
Depending on the local and national research strategy and observations/monitoring already
undertaken, the rationale behind establishing a new sampling strategy for ocean acidification
observation will differ. For each new sampling site, established in the framework of SDG 14.3.1
reporting requirements, it is likely that at the same time specific scientific questions will outline the
observations, such as the evaluation of ocean acidification impacts on key marine species and
habitats, and the development of predictive capabilities.
2.    Constraints/opportunities
When developing a new ocean acidification observing strategy, a balance of: a) research questions
and b) with local and national constraints and opportunities, in particular existing scientific/technical
infrastructure, financial resources to establish and maintain the observations, human capacities
and accessibility of site are important. The inclusion of ocean acidification measurements to
already established observation sites increases the probability of sustained observations and gives
the possibilities to broaden the scope of the investigation. However, not all these sites will be
optimal for monitoring locations e.g. upwelling sites where ecosystem services may be more
exposed to ocean acidification and other stressors like deoxygenation and shifts in temperature.
3.    Data needs
In order to determine the number, times and places for sampling, the natural variability in ocean
chemistry (in particular seasonal variability) and the driving forces behind it (e.g. tides, seasons,
runoff etc.) need to be considered in designing a sampling strategy. Box 1 shows examples of how
sampling frequency for waters with different variability will influence the mean and range of results
and related data. If historical data on the variability of ocean acidification are not available, general
knowledge of the oceanographic variability (e.g. observations using temperature and salinity) might
help in the design of the sampling strategy. Sampling at frequencies appropriate to capturing
seasonal salinity and temperature variability is a useful first step. For each newly established
ocean acidification observation site it is recommended to include surface samples (up to 10 m
depth).
Finally, the accuracy of measurements is determined by the combination of research question and
local/national constraints (see Measurement quality).
IOC/EC-LI/2 Annexe 6 – page 10
Box 1. Simulations to determine the temporal resolution of sampling the carbonate system to cover
the natural variability in order to define the minimum number of samplings per year needed to
obtain average or minimum values for e.g. pH with an accuracy of 0.05 pH. The results of a
simplified power analysis for two ‘sampling sites’ with different natural variability serve as a guide
to determine the frequency of measurements or instrumentation for the ocean acidification
sampling strategy 5,6,7.
When monitoring the carbonate chemistry, it is important to consider the spatio-temporal
resolution. Data points for pH and other parameters of the carbonate system can be highly variable
in space and time. 8 Different questions will require capturing different aspects of this variability. For
example, predicting organism sensitivity and identifying relevant future scenarios for biological
experimentation require capturing the yearly pH niche experienced by the organism, including
extremes, such as the minimum value experienced. 9
The frequency of observation will depend on the parameter to be measured (e.g. average pH or
minimum pH), the required accuracy and the characteristic of the temporal variability at the
sampling site. For example, the coastal zone is often characterized by higher temporal variability in
the carbonate chemistry compared to the open ocean, thus more data points are required to
accurately capture the average pH. The number of observations needed to capture extreme pH
values will also depend on their frequency and intensity.
In order to define the required sampling frequency simulations applying simplified power analysis
can be used. 10 Figure 2 illustrates the yearly variability in pH at two different locations with
contrasting levels of variability: (i) La Push (USA; Figure 2A), with pH ranging between 7.88 and
8.58 and, (ii) Kangaroo island (Australia; Figure 2B), with pH ranging between 8.03 and 8.11. Due
to the low variability and absence of extreme events at Kangaroo Island, the average and minimum
pH with an accuracy of 0.05 pH units can be captured with only 10 observations per year (Figure
2D & 2F). For LaPush, more than 100 yearly observation are needed to capture the average pH
with an accuracy of 0.05 pH units (Figure 2C) and more than 400 for the minimum pH (Figure 2E).
This comparison illustrates the importance of considering variability for the development of a
meaningful monitoring strategy. The level of variability at a given site can be evaluated by a
preliminary sampling and/or existing datasets from similar sites (e.g. upwelling zones).
5
Karl, D.M. (2010) Oceanic ecosystem time-series programs: Ten lessons learned.
Oceanography 23(3):104–125.
6 Hofmann, G.E., Barry, J.P., Edmunds, P.J., Gates, R.D., Hutchins, D.A., Klinger, T. and Sewell, M.A.,
(2010) The effect of ocean acidification on calcifying organisms in marine ecosystems: an organism-
to-ecosystem perspective. Annual Review of Ecology, Evolution, and Systematics, 41:127-147.
7
Alin, S.R., R.E. Brainard, N.N. Price, J.A. Newton, A. Cohen, W.T. Peterson, E.H. DeCarlo,
E.H. Shadwick, S. Noakes, and N. Bednaršek (2015) Characterizing the natural system:Toward
sustained, integrated coastal ocean acidification observing networks to facilitate resource
management and decision support. Oceanography 28(2):92–107.
8 Hofmann GE, Smith JE, Johnson KS, Send U, Levin LA, Micheli F, et al. (2011) High-Frequency
Dynamics of Ocean pH: A Multi-Ecosystem Comparison. PLoS ONE 6(12): e28983.
9 Vargas C, Lagos N, Lardies M, Duarte C, Manríquez P, Aguilera V, Broiman B, Widdicombe S &
Dupont S (2017) Species-specific responses to ocean acidification should account for local adaptation
and adaptive plasticity. Nature Ecology and Evolution. 1:84.
10 Dupont S. (in prep.) Simulations to determine the temporal resolution of sampling the carbonate
system to cover the natural variability.IOC/EC-LI/2 Annexe 6 – page 11
Figure 2. Comparison of the yearly pH variability at two sampling sites (A. LaPush; B. Kangaroo
island) and the relation between the calculated average pH (C, D) and minimum pH (D,F) for different
frequencies of observation per year (10 to 1000). The probability (calculated from 100 randomized
subsample for each frequency of observation) of capturing the average or minimum pH with an
accuracy of 0.05 pH unit is presented in red.
4. Methodology/Instrumentation
Methodologies and instruments to observe ocean acidification at a particular site are informed
based on decisions made using the above three sections. The choice of methodology and
instrumentation has to take into consideration the marine ecosystem structure, biological activity
and behaviour, biofouling experiences, and any strong physical and chemical modulators (e.g.
upwelling, tides, freshwater run-off). Some preliminary non-comprehensive assessment of sensor
technologies for coastal observations have been made (http://www.act-us.info/) and new guidelines
for coastal ocean acidification observation have been published 11. Local constraints (e.g. limited
financial resources) and the availability of existing equipment may orient decisions on sampling
strategy, including choices of methodology and instrumentation.
11
Pimenta, A.R. and Grear, J.S. (2018) EPA Guidelines for Measuring Changes in Seawater pH and
Associated Carbonate Chemistry in Coastal Environments of the Eastern United States. Office of
Research and Development, National Health and Environmental Effects Research Laboratory.
EPA/600/R-17/483IOC/EC-LI/2 Annexe 6 – page 12
Methods and guidance available to countries for the compilation
of the data at the national level
Overview statements on best practices
There are four measurable variables in the ocean carbon system. Two of the four must be
measured or estimated in order to “constrain” the carbon system relative to ocean acidification: pH,
carbon dioxide partial pressure (pCO2), total alkalinity (AT), and total dissolved inorganic carbon
(CT). In addition, temperature and salinity data are required.
As detailed in the Requirements and Governance Plan of the Global Ocean Acidification Observing
Network (GOA-ON) (Newton et al., 2015) 12, common practices include the following approaches:
● Collection of seawater samples for laboratory analyses of CT and AT is a standard practice
if ship or fixed platform access to the water allows. Parameters of interest, such as pH and
aragonite saturation, can be derived via commonly available software (e.g., CO2SYS).
Some calculations require nutrients and other variables (see Recommendations for
calculation of the carbonate system).
● As of 2018, sensors are only commercially available for measurements of pH and pCO2 in
the ocean. Currently, sensors capable of measuring either of these parameters with the
high precision required to detect the ocean acidification signal are costly and require high
maintenance. New developments are underway to produce less expensive and high
accuracy sensors.
● Use of empirical proxies, such as more easily and accurately measured variables (salinity,
temperature, oxygen), to estimate pH and aragonite saturation has been tested for use in
oceanic waters, but has yet to be established for estuarine waters where other factors may
interfere.
The Global Ocean Observing System (GOOS) considers these parameters Essential Ocean
Variables (EOVs) and provides detailed specifications here.
Table 1 illustrates an example of combined relative uncertainties in calculated parameters based
on different measurement pairs (redrawn from McLaughlin et al. 2015), stressing the strong
covariation of pCO2 and pH, as well as CT and AT, assuming state-of -the art measurement
accuracy: 13,14
Table 1. Combined uncertainties in calculated ocean carbon cycle parameters based on different
measurement (Mc.Laughlin et al. 2015).
Pairing pH CT AT pCO2
pH + CT 0.3% 0.5% 1% 6%
pH + pCO2 0.3% 7% 7% 3%
CT + AT 0.3% 0.5% 0.5% 12%
CT + pCO2 0.3% 0.5% 1% 3%
12
Newton J. A., Feeley, R. A., Jewett, E. B., Williamson, P. and Mathis, J. (2015) Global Ocean
Acidification Observing Network: Requirements and Governance Plan (2nd edition)
13
McLaughlin, K., S.B. Weisberg, A.G. Dickson, G.E. Hofmann, J.A. Newton, D. Aseltine-Neilson, A.
Barton, S. Cudd, R.A., Feely, I.W. Jefferds, E.B. Jewett, T. King, C.J. Langdon, S. McAfee, D.,
14 Pleschner-Steele, and B. Steele. (2015) Core principles of the California Current Acidification Network:
Linking chemistry, physics, and ecological effects. Oceanography 28(2):160–169.IOC/EC-LI/2 Annexe 6 – page 13
Overview description of data collection methods
All contributors of data to SDG 14.3.1 are encouraged to read and follow the standard operating
procedures provided in Dickson et al. 2007. This document covers ocean carbon chemistry,
sample-handling techniques, quality assurance procedures, the use of Certified Reference
Materials (CRMs) and Standard Operating Procedures (SOPs) for discrete sampling of pH, pCO2,
AT, and CT. Data contributors are also encouraged to read the Guide to Best Practices in Ocean
Acidification Research and Data Reporting, which focuses on best practices for laboratory
experiments, but also includes background on carbon chemistry (Riebesell et al. 2010). 15 For
coastal environments, which can be subject to large variability and a range of influences such as
nutrient and freshwater inputs, guidelines for the measurement of pH and carbonate chemistry can
be found here 16.
Recent developments discussed among the scientific Ocean Acidification Community, advising
and recommending operating procedures for new emerging technologies are recorded on the
Ocean Acidification Information Exchange online platform. These methodologies are not
referenced in Table 2 yet, but are expected to be included in the near future.
All data submitted to SDG 14.3.1 must include an estimate of measurement uncertainty in the
metadata. Autonomous sensors for pH and pCO2 require calibration and maintenance to validate
sensor performance and identify drift or sensor malfunction. Where possible, the analysis of
discrete bottle samples analysed for pH, CT or AT collected next to the sensors can be used to
calculate pH and pCO2.
All ocean acidity datasets submitted to SDG 14.3.1 must also include associated temperature (in
situ [and temperature of measurement if different than in situ]), salinity, and pressure (water depth).
If submitting pH values, all pH values must be on the total scale (see Dickson et al. 2007). 17
Measurement quality
For the purposes of SDG 14.3.1, three categories of measurement quality were established
(adapted from Newton et al. 2015) 18:
Category 1: Climate quality
The climate quality objective is typically used to determine trends in the open ocean, shelf and
coastal waters, providing data on seasonal through interannual variability on regional scales. The
climate quality objective requires that a change in the dissolved carbonate ion concentration to be
estimated at a particular site with a relative standard uncertainty of 1%. The carbonate ion
concentration is calculated from two of the four carbonate system parameters and implies an
uncertainty of approximately 0.003 in pH; of 2 μmol kg–1 in measurements of AT and CT; and a
relative uncertainty of about 0.5% in the pCO2. Such precision is only currently achievable by a
limited number of laboratories and is not typically achievable for all parameters by even the best
autonomous sensors.
15 Riebesell U., Fabry V. J., Hansson L. & Gattuso J.-P. (Eds.) (2011) Guide to best practices for ocean
acidification research and data reporting. Luxembourg, Publications Office of the European Union,
258pp. (EUR 24872 EN).
16 Pimenta, A.R. and Grear, J.S. (2018) EPA Guidelines for Measuring Changes in Seawater pH and
Associated Carbonate Chemistry in Coastal Environments of the Eastern United States. Office of
Research and Development, National Health and Environmental Effects Research Laboratory.
EPA/600/R-17/483
17 Dickson, A.G., Sabine, C.L. and Christian, J.R. (Eds.) (2007) GUIDE TO BEST PRACTICES FOR
OCEAN CO2 MEASUREMENTS. PICES Special Publication 3, 191 pp.
18 Newton J. A., Feeley, R. A., Jewett, E. B., Williamson, P. and Mathis, J. (2015) Global Ocean
Acidification Observing Network: Requirements and Governance Plan (2nd edition)IOC/EC-LI/2 Annexe 6 – page 14
Category 2: Weather quality
The weather quality objective is suitable for many coastal and nearshore environments, particularly
those with restricted circulation or where CO2 system parameters are forced by processes like
upwelling, pollution or freshwater inputs that can cause large variability. The weather objective
requires the carbonate ion concentration (used to calculate saturation state) to have a relative
standard uncertainty of 10%. This implies an uncertainty of approximately 0.02 in pH; of 10 μmol
kg–1 in measurements of AT and CT; and a relative uncertainty of about 2.5% in pCO2. Such
precision should be achievable in competent laboratories, and is also achievable with the best
autonomous sensors.
Category 3: Measurements of undefined quality
For SDG 14.3.1, pH measurements using glass electrodes will be considered Category 3 due to
the challenges of using glass pH electrodes in seawater. 19 It is intended that the methodology
provided here gives useful information for countries building capacity towards Category 1 and 2
measurements. For example, carefully calibrated glass pH electrodes may help in the identification
of coastal ocean acidification hot spots and help prioritize future monitoring plans. In annual SDG
14.3.1 summary products, Category 3 measurement sites will be presented as data collection sites
only, no data values will be visualized.
All those contributing data to SDG 14.3.1 are encouraged to adopt measurement quality Category
1 or 2. A variety of capacity development activities to support Member States’ capacity in this
regard are conducted by different organizations (more information can be found here: e.g.
www.iaea.org/ocean-acidification; http://ioccp.org; http://www.ioc-cd.org/index.php;
http://www.whoi.edu/courses/OCB-OA/).
For more information, see the GOA-ON Requirements and Governance Plan (Newton et al.,
2015) 20.
Standard Operating Procedures (SOP)
Table 2 provides links to existing SOPs for discrete, underway (ships of opportunity), and
autonomous sensors.
Table 2. List of standard operating procedures to measure different parameters of the carbonate
system (procedures marked with * are able to attain climate quality).
Discrete Underway Fixed autonomous
sensors
pH Spectrophotometric * Spectrophotometric Spectrophotometric
Potentiometric ISFET ISFET
CT IR detection - -
Coulometry *
AT Potentiometric titration - -
(open and closed cell;
open recommended) *
pCO2 - Equilibration, Equilibration *
headspace * Membrane-based
Membrane-based
19 Dickson, A.G., Sabine, C.L. and Christian, J.R. (Eds.) (2007) Guide to best practices for ocean CO2
measurements. SOP6a. PICES Special Publication 3, 191 pp.
20 Newton J. A., Feeley, R. A., Jewett, E. B., Williamson, P. and Mathis, J. (2015) Global Ocean
Acidification Observing Network: Requirements and Governance Plan (2nd edition)IOC/EC-LI/2 Annexe 6 – page 15
Discrete Underway Fixed autonomous
sensors
Temperature Sensor measurements Sensor measurements Sensor measurements
Salinity Sensor measurements Sensor measurements Sensor measurements
Recommendations for calculation of the carbonate system
At least two out of four measurable parameters in the ocean carbon system (pH, pCO2, AT, CT) are
needed to “constrain” the carbonate system. Computer programmes are commonly used to
calculate other carbonate chemistry parameters from the measured parameters and many of these
software packages are publicly accessible. In addition to the two carbonate system parameters the
software packages require temperature (in situ at time of sampling and temperature at time of
measurement, if different), salinity and pressure (depth).Nutrient concentrations provide additional
information. The calculations of the carbonate system should follow the recommendations made by
Orr et al. (2015) 21. Based on the submitted data sets it is intended to obtain equally weighted
monthly means, though annual equally weighted means will be considered for the SDG 14.3.1
reporting.
Empirical relationships to calculate alkalinity from salinity and other variables are published 22,23
although these may not be suitable in coastal waters. Careful calibration against direct
measurements at each site are needed.
Uncertainty of measurement
Uncertainty of measurement comprises, in general, many components. Some of these components
may be evaluated from the statistical distribution of the results of series of measurements and can
be characterised by standard deviations. The other components, which also can be characterised
by standard deviations, are evaluated from assumed probability distributions based on experience
or other information. 24
A key goal for any observing network is to ensure that the measurements made are of appropriate
quality for their intended purpose, and are comparable across sites. It is thus essential to ascertain
and report through the metadata the uncertainty of measurements. The definition of the term
uncertainty (of measurement) is: 25 “A parameter associated with the result of a measurement, that
characterizes the dispersion of the values that could reasonably be attributed to the measurement.”
Thus, measurement uncertainty is not a synonym for measurement repeatability or even
reproducibility. 26 Its evaluation requires a significant investment of effort. 27
21
Orr, J. C.; Epitalon, J.-M.; Gattuso, J.-P. (2015) Comparison of ten packages that compute ocean
carbonate chemistry. Biogeosciences, 12(5):1483-1510
22 Carter, B R, N L Williams, A R Gray, and R A Feely. (2016) Locally interpolated alkalinity regression
for global alkalinity estimation. Limnology and Oceanography: Methods,14: 268–277
23
Carter, B R, R A Feely, N L Williams, A G Dickson, M B Fong, and Y Takeshita. (2018) Updated
methods for global locally interpolated estimation of alkalinity, pH, and nitrate.Limnology and
Oceanography: Methods 16: 119-131.
24 S L R Ellison and A Williams (Eds). Eurachem/CITAC guide: Quantifying Uncertainty in Analytical
Measurement, Third edition, (2012) ISBN 978-0-948926-30-3. Available from www.eurachem.org.
25 Guide To The Expression Of Uncertainty In Measurement. ISO, Geneva (1993).
(ISBN 92-67-10188-9) (Reprinted 1995: Reissued as ISO Guide 98-3 (2008), also available from
http://www.bipm.org as JCGM 100:2008)
26 P de Bièvre, Measurement uncertainty is not a synonym of measurement repeatability or
measurement reproducibility . . . Accred. Qual. Assur. 13:61–62 (2008).
27 S L R Ellison and A Williams (Eds). Eurachem/CITAC guide: Quantifying Uncertainty in Analytical
Measurement, Third edition, (2012) ISBN 978-0-948926-30-3. Available from www.eurachem.org.IOC/EC-LI/2 Annexe 6 – page 16
The provided guidelines, best practices and SOPs provide information on how to calculate the
uncertainty (see Methods and guidance available to countries for the compilation of the data at the
national level). Furthermore, the 14.3.1 SDG methodology metadata template contains information
on data quality and the related required information, in particular guidance on how to report the
used instruments and measurement guidelines. All data and metadata submitted under SDG14.3.1
must be accompanied by the associated uncertainty information.
A complete uncertainty budget has a double role: on one side it allows the comparability of the
data, on the other hand it enables to identify the main sources of errors and therefore improve the
data quality (see Quality control).
Data Sources
Description
The general IOC data collection process is described in Document IOC-XXIX/2Annex 14.
The novelty of assessing ocean acidification at the global level, as in indicator 14.3.1, requires the
IOC secretariat to collect the data via different pathways. Future data collections are expected to
be a mixture of:
• direct requests to National Statistical Offices (NSOs), as new national reporting
mechanisms are now installed allowing them to provide the required information,
• annual requests to the IOC national focal points,
• collaboration with National Oceanographic Data Centres, international data centres and
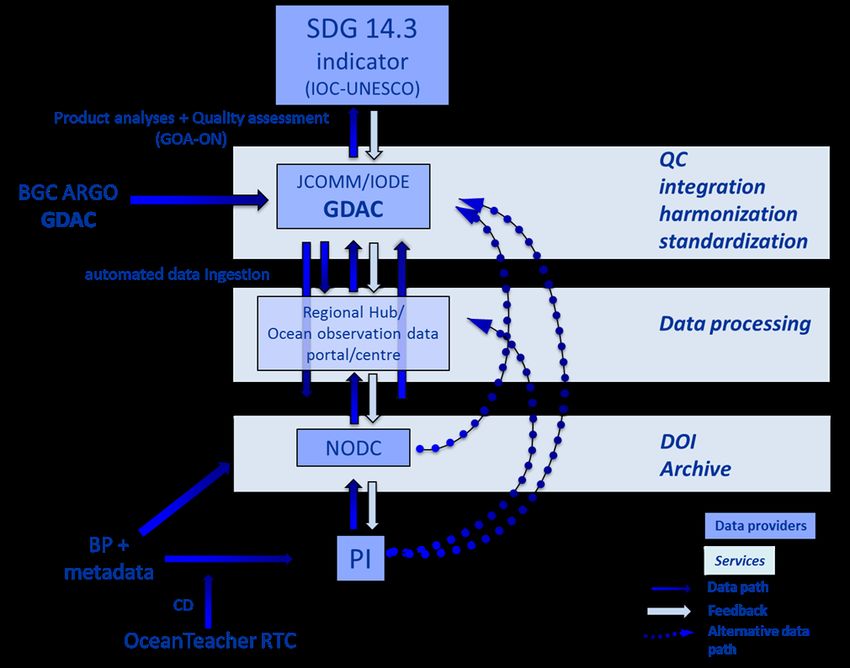
• directly with data providers via the GOA-ON data portal (Figure 3).IOC/EC-LI/2 Annexe 6 – page 17 Figure 3. Scheme to illustrate the proposed data collection and publication process related to national contributions of data related to 14.3.1 (SDG: Sustainable Development Goal; IOC- UNESCO: Intergovernmental Oceanographic Commission of UNESCO; GOA-ON: Global Ocean Acidification – Observing Network; JCOMM: WMO-IOC Joint Technical Commission for Oceanography and Marine Meteorology; WMO: World Meteorological Association; IODE: International Oceanographic Data and Information Exchange of IOC UNESCO; GDAC: Global Data Assembly Center; BGC ARGO: Biogeochemical Argo floats; QC: Quality Control; NODC: National Oceanographic Data Centre; DOI: Digital Object Identifier; BP: Best Practice; CD: Capacity Development; PI: Principal Investigator; RTC: Regional Training Centre). Global scientific efforts (GO-SHIP, SOCAT, GCOS) which host and feature data from various ocean observing efforts and/or focus on collecting measurements in international waters will also be queried for annual or more likely multi-year data sets representing status and change of ocean acidification variables in the open ocean. As mentioned the data collection process will take place in close collaboration with the IOC Project Office for IODE Oostende, Belgium and relevant data providers/national archives, the GOA-ON data portal, and entities such as the marine chemistry part of the European Marine Observation and Data Network (EMODnet). The GOA-ON data portal features open access data, in addition to a global monitoring asset inventory. The portal is designed to offer two levels of access: 1) visualization and 2) download capabilities. Combining different open-access data sets may provide incentives to create new observing systems in under-sampled areas and to increase the application of open access data policies worldwide, according to the IOC Criteria and Guidelines for the Transfer of Marine
IOC/EC-LI/2 Annexe 6 – page 18

Technology 28.The detailed SDG 14.3.1metadata and data forms (part of the final methodology to
ensure inter-comparability between measurements) will be included on the GOA-ON website. The
information requested will include a detailed habitat description, which will be required to assess
the natural and anthropogenic causes of variability within the data sets.

Collection process:

(I) Counterparts:
The official counterparts are the IOC focal points. They, as well as National Oceanographic Data
Centres (NODCs), will initially be contacted by IOC to request relevant data from the appropriate
national oceanographic data centres and/or relevant scientists, agencies or programmes. An
annual data submission request will be sent out directly to the member states asking for the
respective data and metadata. It is envisaged that an online submission interface, to be developed
in collaboration with existing ocean carbon data centres and biogeochemical data platforms will
facilitate the submission process in the future.
(II) Validation and consultation process:
The counterparts are invited to provide references (metadata) for the information provided. The
quality control mechanisms are described in more detail later in this document (see Quality
Control).

Data visualization

Data provided by National Oceanographic Data Centres/National Statistical Offices or other
relevant data portals/centres (Figure 3) can be visualized via the GOA-ON data portal. The
submitted information will be used to produce the visualization products.
Two maps will be included in the visualized product, one showing the locations and quality of
measurements taken, and the other showing the climatological mean (taken on the linear scale,
i.e., total hydrogen ion concentration) and variance of high quality annual equally weighted pH
values from each data collection site.
     •    Map 1 with points indicating data contributors – colour coded to show the 3 data quality
          categories
     •    Map 2 with points indicating high quality data of annual equally weighted mean pH (surface)
          and variability.
It is expected, that the visualization will evolve as more data become available with time.

Quality control

Data quality control is a critical component of the data analysis, submission and process. Scientists
and technicians who collected the submitted data will be responsible for the primary quality control
of the data and accompanying detailed metadata. The metadata submitted with the data must also
describe the quality control standard operating procedures (SOPs) followed for each parameter.
Primary quality control
     ●    Quality control that is attached to the methodology (CRMs, tris buffer calibration, SOPs are
          provided),
     ●    Quality control and quality assurance of the actual data (SOP are provided) and usage of
          community agreed quality flags,

28
         Intergovernmental Oceanographic Commission. IOC Criteria and Guidelines on the Transfer of Marine
         Technology (CGTMT)/ Critères et principes directeurs de la COI concernant le Transfert de
         Techniques Marines (CPTTM). Paris, UNESCO, 2005. 68pp. (IOC Information document, 1203)
Vous pouvez aussi lire