The Gulf Stream, European climate and abrupt climate change, past and future Richard Seager Lamont Doherty Earth Observatory Palisades, New York ...
←
→
Transcription du contenu de la page
Si votre navigateur ne rend pas la page correctement, lisez s'il vous plaît le contenu de la page ci-dessous
The Gulf Stream, European climate and abrupt climate
                    change, past and future

                               Richard Seager
                      Lamont Doherty Earth Observatory
                             Palisades, New York

              http://www.ldeo.columbia.edu/res/div/ocp/gs

Seager et al. (2002) Quarterly Journal of the Royal Meteorological Society
Seager (2006) American Scientist
Seager and Battisti (2007) In The Global Circulation of the Atmosphere, Schneider and Sobel, Eds.,
Princeton Univ. Press.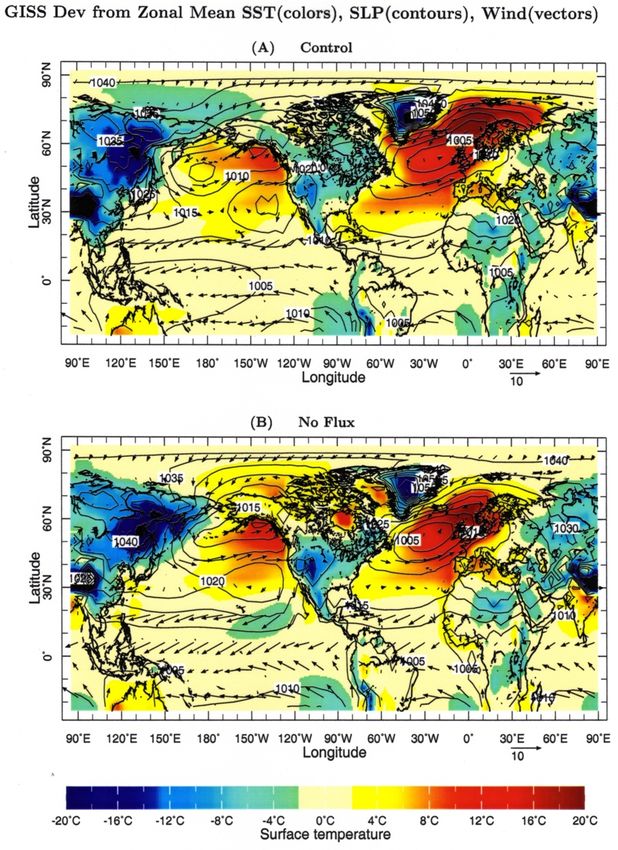
A typical spring day in Torbay,
     southwest England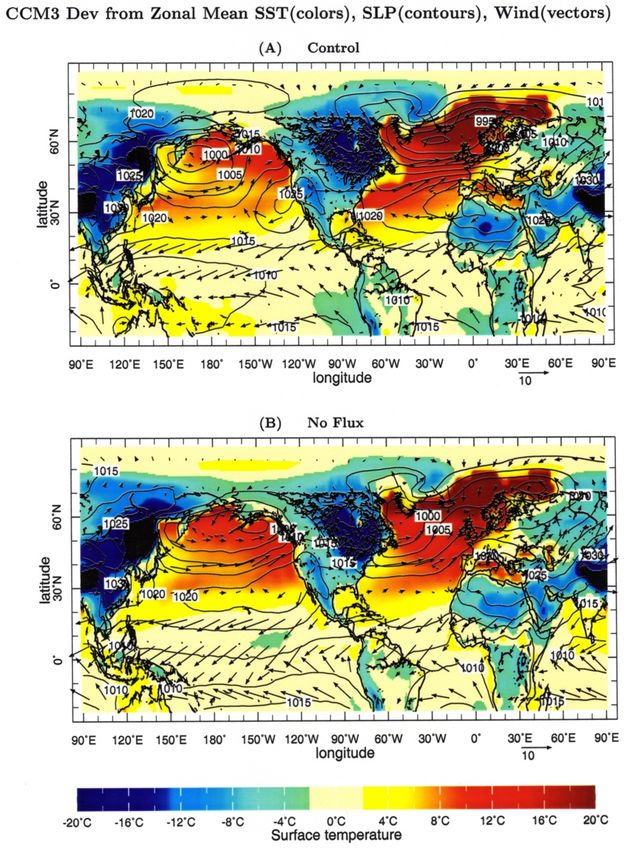
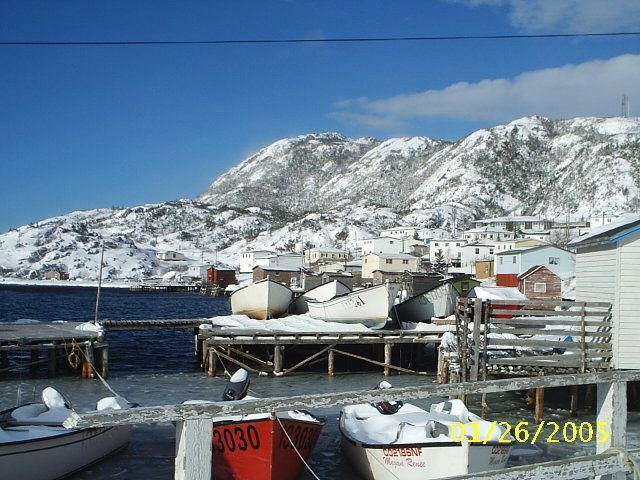
A typical summer day in Newfoundland
Departure of Dec, Jan, Feb observed
                         surface air temperature from zonal mean

                     0                                                              0
                                                                    -3                                        3                             0
                         -3          -6                        -6 -12
                                                                     -9
                                                                                                                     -3
                                                   -9
          60˚N

                                                                              18                                                  -18
                                12                       -12                       12 6                       -6
                                                                     15
   Latitude

                                                                                                   0                              -15
                                 9          -6                                                                       -12
                                                                          9               6                             -15
                                                                                                                       -18
                                                                                                                              -9
          30˚N

                 6                                                                                     -6
                                            -6
                                                                               -3                                                       3
                         3
                                                                                               0

                                                         -3                                                                00 0
                                0
          0˚

                                                        -6                                -3

                 180˚         150˚W 120˚W        90˚W        60˚W   30˚W            0˚    30˚E         60˚E        90˚E     120˚E       150˚E
                                                                      Longitude
2 m_above_gnd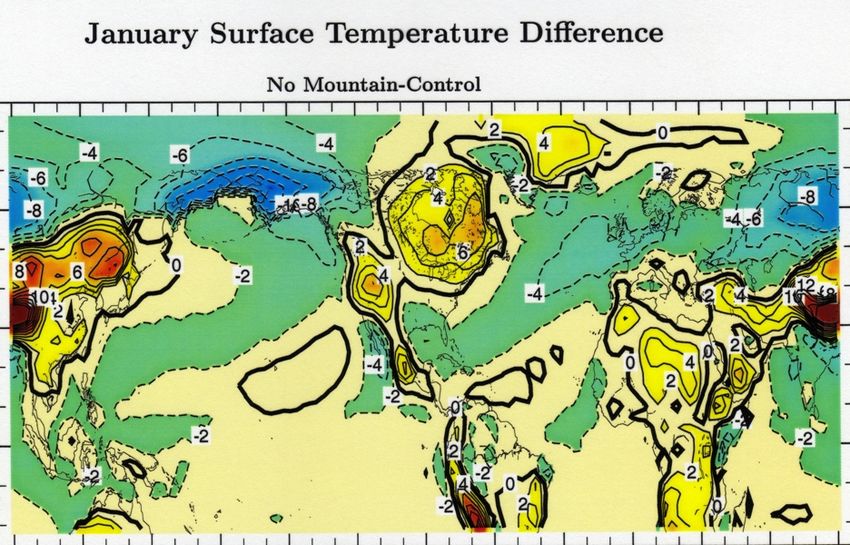
A random survey of:

     3, 643, 521, 489 people 12 and older
                      and
             3, 867 oceanographers

revealed that almost all think this temperature
 difference is caused by THE GULF STREAM
        (which, itself, was invented by Benjamin Franklin)
‘The Big Chill’, BBC documentary 2003

                                              ‘Our ports could be
                                               frozen over ... Ice
                                              storms could ravage
                                                the country ... It
                                              would be the biggest
                                              change in the British
                                              way of life since the
                                                  last Ice Age ..’

‘In the end there came the terrifying revelation: the Gulf
Stream, that vast current of water the keeps us warm,
could be cut off.’
and it all
started
with ...

Matthew
Fontaine
Maury
(Commander,
U.S. Navy)
Maury (1855) The Physical Geography of the Sea
‘One of the benign offices of the Gulf Stream is to convey heat from the Gulf of
Mexico, where otherwise it would become excessive, and to disperse it in regions
beyond the Atlantic for the amelioration of the climate of the British Isles and all of
western Europe.’

and were this not to happen ...

‘.. the soft climate of both France and England would be as that of Labrador, severe in
the extreme, and ice-bound.’

‘Every west wind that blows crosses the stream on its way to Europe, and carries with
it a portion of this heat to temper there the northern winds of winter. It is the
influence of this stream upon climate that makes Erin the “Emerald Isle of the Sea”,
and that clothes the shores of Albion in evergreen robes; while in the same latitude,
on this side, the coasts of Labrador are fast bound with fetters of ice.’
Maury
(Commodore,
Confederate Navy)
monument,
Richmond,VA,
(forever in
residence next to
Stonewall Jackson)
More modern researchers have picked up this idea (with noted loss of erudition)

‘The Atlantic thermohaline circulation (THC) is an important component
of the global climate system. In the North Atlantic the Gulf Stream
transports enormous amounts of heat poleward (1PW) as part of the
THC, thereby warming western Europe.’ (Latif et al. 2000)

‘One of the major elements of today’s ocean system is a conveyor-like
circulation that delivers an enormous amount of tropical heat to the
northern Atlantic. During winter, this heat is released to the overlying
eastward moving air masses, thereby greatly ameliorating winter
temperatures in northern Europe.’ (Broecker 1997)
First hint that this may all be myth comes from using
observations to estimate atmosphere and ocean heat
                       transports

                                              TRENBERTH et al. (2001) estimates for northward heat transports
                          6
                                    NCEP DER. ATM
                                    ECMWF DER. ATM
                                    NCEP DER. OCEAN
                                    ECMWF DER. OCEAN
                          4
 Net radiation at
top of atmosphere
  = divergence of         2

  (AHT + OHT)
                          0
                    PW

 Net radiation           !2
 from satellites,
 AHT from
 weather obs
                         !4
 and models,
 OHT from
 residual
                         !6
                              !80       !60       !40        !20         0          20        40         60     80
                                                                      Latitude
Contributions of heat transports and seasonal
heat release by ocean to zonal mean
temperatures over the NH
- Winter atmospheric HT across 35N = 6PW or 54W/m2
- Annual mean (> winter) ocean HT across 35N = 1.3PW or 11W/m2
- Seasonal ocean heat release north of 35N
(= heat release - absorbed solar - OHT) = 53W/m2
Assuming climate sensitivity of 2 W/m2 per deg C
Warming of area north of 35N is:
AHT OHT storage
27 C 6C 27 CThree determinants on European climate
(as a departure from the zonal mean):
1. Summer storage and winter release of
heat from the ocean and its effect on
climate downstream
2. The pattern of movement of heat within
stationary and transient atmospheric
waves
3. The pattern of movement of heat by
the ocean and release to the atmospheremille ans, ont garanti à l’Europe un climat doux » (…) écri-
vait que « les zones septentrionales de l’Atlantique nord…
et, dans le français reçoivent environ 1015 watts du Gulf Stream et du courant Été Hiver
CLIMATOLOGIE nord-atlantique. Cette chaleur se dissipe dans l’atmosphère et
EN ÉTÉ, À LA FAVEUR D’UN ENSOLEILLEMENT PLUS FORT, la sur-
face de l’océan se réchauffe. Les vents qui brassent les eaux
superficielles de l’océan redistribuent cette chaleur sur une
Fig.2 Trois phénomènes en compétition couche de quelques dizaines de mètres de profondeur. Cette
➩ croise le courant, absorbe une part de sa chaleur et tempère couche dite « de mélange » stocke cette énergie. En hiver, l’en-
Fig.1 L’action
ainsi les vents d’hiver venant du nord. C’est l’influence de ce soleillement est moindredes vents
et les vents beaucoup plus violents :
courant sur le climat qui fait d’Erin l’“île d’Émeraude de la l’océan se refroidit en surface et relargue sa chaleur dans l’at-
mer”, et qui drape les côtes d’Albion de robes toujours vertes ; mosphère. Les eaux froides superficielles, plus denses (en bleu
alors qu’à la même latitude, de ce côté, les côtes du Labrador clair), plongent alors et sont remplacées par les eaux plus pro-
fondes, plus chaudes et moins denses (en bleu foncé).
sont vite prises dans les glaces. »
La même explication figure encore dans la presse scienti-
fique récente. Par exemple, dans la revue Nature du 28 août
2
1997, Stefan Rahmstorf, un climatologue du Postdam Ins-rique des moyennes latitudes est très fortement marquée
3 titute for Climate Impact Research, s’inquiétant « des chan-par de larges méandres qui s’étendent sur plusieurs milliers
gements climatiques imposés par l’homme [capables de] bou-de kilomètres (appelés « ondes stationnaires » car ils sont
leverser les courants océaniques qui, au cours des derniers dixstables par rapport à la surface terrestre). Ces méandres
mille ans, ont garanti à l’Europe un climat doux » (…) écri-résultent en partie des différences de pression, elles-mêmes
vait que
1 « les zones septentrionales de l’Atlantique nord…liées au contraste de température, entre l’océan et les conti-
reçoivent environ 1015 watts du Gulf Stream et du courantnents. Aux mêmes Été Hiver
latitudes, ces derniers sont considéra-
nord-atlantique. Cette chaleur se dissipe dans l’atmosphère etblement plus froids en hiver. Toutefois, ces grands mouve-
mentsENsont ÉTÉ, dus
À LA pour
FAVEUR uneD’UNtrèsENSOLEILLEMENT
large part à la PLUS FORT, la sur-
distribution du
face de l’océan se réchauffe. Les vents qui brassent les eaux
reliefsuperficielles
terrestre, qui de dévie
l’océanl’écoulement
redistribuent cettede l’air, créant
chaleur des
sur une
Fig.2 Trois phénomènes en compétition
TROIS PHÉNOMÈNES PARTICIPENT AU CONTRASTE des températures hivernales entre les méandrescouchelàde oùquelques
le vent dizaines
voudraitdesouffler
mètres de d’ouest en est.Cette
profondeur. De
côtes atlantiques américaines et européennes, mais dans quelles proportions ? ➀ Le relar- plus, couche
il est connu demélange
dite « de tous que» les vents
stocke deénergie.
cette l’hémisphère
En hiver,nord
l’en-
gage dans l’atmosphère de la chaleur stockée pendant l’été dans la couche superficielle de sont relativement froids quand ils soufflent depuis le nord,:
soleillement est moindre et les vents beaucoup plus violents
l’océan. ➁ Le transport de chaleur par le Gulf Stream des subtropiques vers le nord et sa l’océan se refroidit
et relativement chaudsenquandsurfaceils et proviennent
relargue sa chaleur dans l’at-
du sud.
libération dans l’atmosphère. ➂ Les grands méandres atmosphériques qui, en partie façon- mosphère. Les eaux froides superficielles, plus denses (en bleu
Un de ces méandres existe à l’est des montagnes Rocheuses
nés par les reliefs, s’étendent sur plusieurs milliers de kilomètres. En l’occurrence celui pré- clair), plongent alors et sont remplacées par les eaux plus pro-
, amenant
[fig. 2]fondes, de l’air froid vers l’est de
plus chaudes et moins denses (en bleu foncé). l’Amérique du
sent à l’est des montagnes Rocheuses, qui souffle depuis le nord de l’air froid sur l’est de
Nord et de l’air chaud vers l’Europe de l’Ouest. Il est clair que
l’Amérique du Nord et, depuis le sud, de l’air chaud vers l’Europe de l’Ouest.
© INFOGRAPHIES / P. PINEAU
cette sinuosité de la circulation atmosphérique fait égale-
2 ment partie
rique desdu jeu.
moyennes latitudes est très fortement marquée
Nous avons donc trois phénomènes
par de larges méandres qui s’étendent en sur
compétition pour
plusieurs milliers
3
réchauffe les vents soufflant sur l’Europe” [2]». Cette dernière expliquer la relative
de kilomètres douceur
(appelés des hivers
« ondes européens
stationnaires 2].sont
[fig.ils
» car Le
phrase, pour le moins ambiguë (réchauffe l’Europe par rap- premier stablesestparle rapport
stockageà saisonnier de la chaleur
la surface terrestre). dans la
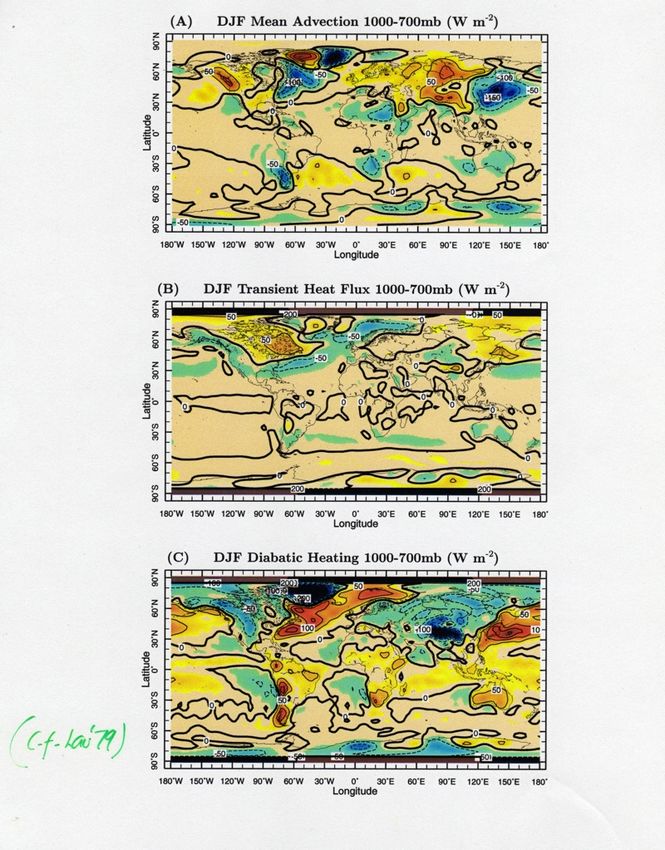
Ces méandresUse Reanalysis data (1949-2000, a byproduct of
numerical weather forecasting) to determine the
mechanisms for generation of EUROPEAN
GULF STREAM AND regional climates
WINTERS 2567
Steady thermodynamic
(b) Maintenanceenergy equation
of the zonal asymmetries of northern hemisphere winter
temperatures
(T=temperature, u,v,w =velocities, Q=diabatic heating,
bar means monthly
To look mean, atprime
more closely departure
the causes of the from
zonal asymmetries of temperature in the
lower atmosphere
monthly mean) during northern hemisphere winter we turned to an analysis of the
balance of terms in the vertically integrated thermodynamic energy equation:
( ) ( )
u @T v @T @T RT
¡ C ¡ !N ¡
a cos µ @¸ a @µ @p pcp
( ) ( ) (1)
1 @.u0 T 0 / 1 @.v 0 T 0 / @.! 0 T 0 / R
¡ C ¡ ¡ .! 0 T 0 / D ¡Q:
a cos µ @¸ a @µ @p pcp
The budget is then integrated from 70 000 Pa to 100 000 Pa and then averaged over
December to February. The overbars denote the monthly mean and primes denote
Advection of heat
departures from by monthly
the monthly mean
mean. flow
Hence the + convergence
transient of heateverything
terms include by eddieson sub-
monthly time-scales. In Eq. (1)(storms)
u, v and !=are
heating
the zonal, meridional and vertical pressure
velocities, respectively, T is temperature, a is the radius of the earth, µ is latitude, ¸ is
longitude, p is pressure, R is the gas constant and Q is the diabatic heating.
The !rst two terms are the stationary advection, including the zonal mean, by the
horizontal "ow and the stationary vertical advection. The third term is the horizontalT tendency due to:
monthly mean
advection
convergence
of heat by
transient
eddies
diabatic heatingDividing
osphere; theup the winter
remainder is maintained by the balance between 200
n theocean
oceanheat
and absorption
release of solar radiation. Hence we can
120
160 160 180 220
240
220 220
60˚N
200
200
Qwinter Qlocal
180
D OHC C (2)
260280
O!A :
160 300
O!A 380
400340
360320
160
30˚N
180
200
220
wintertime heat release from ocean to atmosphere and equals
nt- and long-wave-radiative heat loss, OHC is the ocean heat-
60˚W 30˚W 0˚
100
cal
!A is the release of heat due to local processes of reduction
60 60
80
40
ption of ocean
solar radiation.
heat fluxFigure 7 shows these three quantities
60˚N
80
40 60 60
20
020 60
e marine convergence
data of DaSilva et al. (1994). The total winter heat
80100 40
-20
n the Gulf Stream region, west of 35± W, where it can reach
180 140
120
160 -20
0
30˚N
-40
ase is much less elsewhere. The annual mean ocean heat-!ux
20 -60
ximum in the Gulf Stream region where it is about 50% of the
60˚W 30˚W 0˚
100
ean heat-!ux convergence
local winter oceanalso accounts for up to 50% of the
80
120
120
subpolar North Atlantic north of Norway. Outside these two
60˚N
to atmosphere heat
ease is largely accounted for by the local release of absorbed
reviously stored.loss
These comparisons indicate that for most of
240 160
140
180
30˚N
ocesses of ocean heat-!ux convergence play a secondary role
200
220 220
taining the wintertime heat release from ocean to atmosphere.
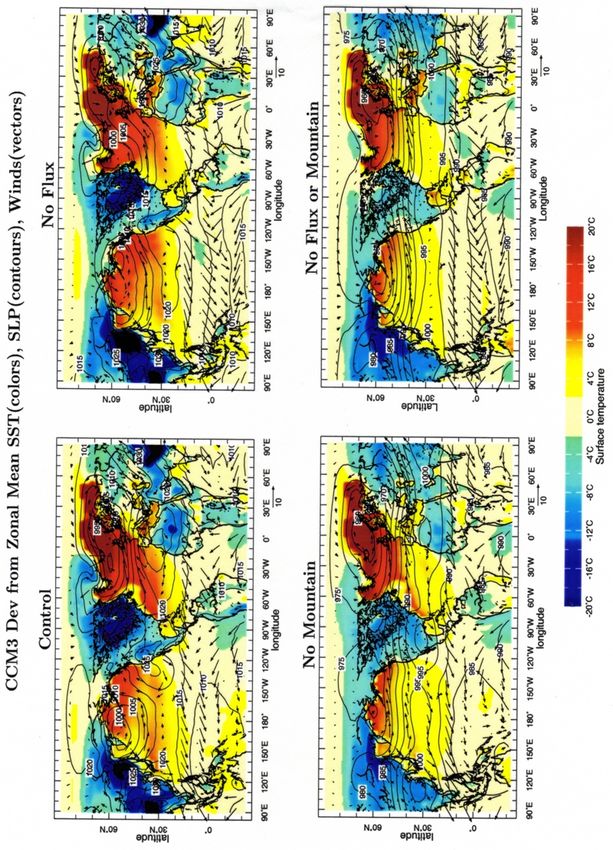
60˚W 30˚W 0˚Model experiments: Use state-of-the-art atmospheric general circulation models coupled to: 1. An ocean with an ocean heat transport specified to ensure accurate simulation of sea surface temperature (SST) 2. An ocean in which the ocean heat transport is zero but which still accounts for seasonal exchange of heat with the atmosphere and space
Difference in January
surface air                                                                                          6

temperature (deg C)                                               9
                                                                                                                3                                           3

                          60˚N
                                                                                                                    0

with OHT minus no                                                                       0                                      6

OHT                                                                                                                                    3

                          30˚N
                                                                                3       0

       CCM3 model,                                                                                                                                              3

       fixed sea ice
                                                                            0

                          0˚
                                                                                                -3                                                                            0
                                             0                                                                                                  -3
                                                                                                     0                             0

                                  90˚E       120˚E       150˚E    180˚      150˚W 120˚W                  90˚W       60˚W       30˚W        0˚        30˚E           60˚E          90˚E
                           90˚N

                                                                   0
                                                                                                                3
                                                           12                                                                                         21
                                                  9                                 6       6
                                                                                                                                                                         12
                           60˚N

                                                          15
                                                                       18                                                                                            9

GISS model, interactive                                                                                         3
                                                                                                                                                            6

       sea ice                                                                                             6
                           30˚N

                                                                       3
                           0˚

                                                                                                                                           -3
                                                            0
                                         0                                                                                                                           0
                                                                                    0
                                                                                                                                   0

                                   90˚E          120˚E    150˚E    180˚         150˚W 120˚W               90˚W          60˚W   30˚W         0˚       30˚E           60˚E          90˚E
Departure of winter
temperature from zonal mean,
CCM3 model
with OHT
no OHTDeparture of winter
temperature from zonal mean,
GISS model
with OHT
no OHTSo ocean heat transport warms British Isles, France .. by 2-3 deg C and eastern N. America by the same amount ... ... leaving the much larger difference in winter temperature (15-20 deg C) across the ocean to be explained by other processes Granted, north of Bergen, OHT keeps winter sea ice at bay making surface air T above and downstream considerably warmer than otherwise would be.
So is the temperature contrast across the N. Atlantic
 explained by a simple maritime-continental climate
                    distinction?

           Thanks to the Rocky Mts., NO.

           Rerun models with a flat Earth
North-south flow forced by mountains
cool eastern North America and warm
western EuropeBecause of need to conserve angular momentum,
Rockies force a stationary wave in the westerlies
with northerly flow (cooling) over eastern N.
TROPOPAU
SE
America and southerly flow (warming) over E.
Atlantic and western Europe
2OC
KY -
OUN
TAINS
&IGURE 4HE WAVINESS IN THE FLOW OF THE MID LATITUDE WESTERLIES THAT IS RESPONSIBLE FOR KEEPING %UROPEAN WINTERS MILD RESULTS FROM A
FUNDAMENTAL PRINCIPLE OF PHYSICS THE CONSERVATION OF ANGULAR MOMENTUM "ECAUSE THE TOP OF THE TROPOSPHERE ACTS AS SOMETHING OF A LID AIRT change due to mountains is caused by deepening of trough over western N. Atlantic and eastern seaboard
So does the larger extratropical ocean heat transport in the Atlantic than
   the Pacific explain the difference in climate between coastal
   northwestern Europe and coastal western North America?
                                      R. SEAGER et al.

            TABLE 1.     ATLANTIC   MINUS PACI FI C NEAR SURFACE COA STAL
                                AIR TEMPERATURE (degC)

                                          GISS-ML          CCM3-ML
                       Observations    OHT    no OHT     OHT    no OHT
             60± N          7           11       10       9       10
             55± N          5            4        7       7        8
             50± N          5            5        6       6        5
            OHT D ocean heat transport. The Models GISS-ML and CCM3-ML
            are explained in the text.

 in these models,No,
                 heat this contrast
                      transport by the remains    intact
                                       thermohaline      with no
                                                     circulation is not required
ime Europe to be warmer than the Paci!c  ocean   heat
                                           coast of    transport
                                                    Canada and Alaska.
So why is the Atlantic coast of north-west Europe warmer than the Paci!c c
Relevance to abrupt climate change
90,000 years of Greenland and Antarctic climate

                                          - Rapid warmings
                                          (then cooling, then
                                          sudden cooling) in
                                          Greenland

                                          - No such things in
                                          Antarctica

                                          - bimodality in
                                          Greenland (Wunsch
                                          2001)

                                              Blunier and Brook
                                              (2001)
Most recent abrupt max and min T in England
change - the YD -
was associated
with dramatic
cooling in
Greenland and W.
Europe in winter
and little cooling in
summer
e.g. Atkinson et al.
(1987, beetles)
supported by periglacial
and glacial evidence
summarized by Denton
et al. (2005)
31and it was accompanied by abrupt
changes in N. Atlantic deep ocean
circulation
Greenland
Claim:
Subpolar N
Atlantic SST ‘drop dead’
circulation between
LGM and B/A warm
transition
Abrupt resumption
of MOC ~14.7 kyr
BP coinciding with
overturning B/A warm period
circulation
Partial reduction of
proxy, MOC in YD
Bermuda
rise
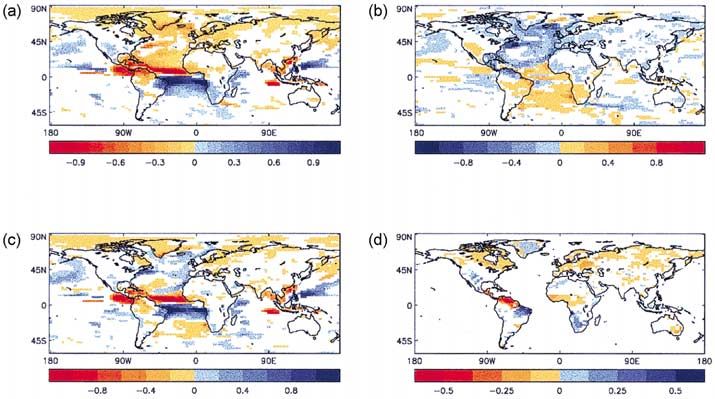
McManus et al. (2004)However, changes in MOC alone cannot
account for Younger Dryas climate change
DJF T and P change for MOC off
For MOC off: a" L%& ." &odern
• Magnitude of the
'ears 10!19
winter temp change
around N. Atlantic
(even accounting for
sea ice in LGM world)
too small c" L%& d" &odern
• The magnitude of the
tropical/subtropical
'ears 40!49
temperature response
too small
• Impact on Asian
monsoon unclear
• SH? !25 !20 !15 !10 !5 0 5
Cheng et al. (2006)European temperature is actually
more sensitive to a forced change to
a zonal (E-W) jet and storm track:
Surface air
T change,
zonal jet
minus
modern
climatology
van de Schrier et al. (2007) 34Implications for anthropogenic
climate change
Climate model projections of the 21st Century do show, to varying extents, a
weakening of the N. Atlantic meridional overturning circulation forced by
subpolar surface warming and freshening
Chapter 10 Global Climate Projections
BCCR-BCM2.0
Observations
CGCM3.1-T47
Atlantic MOC at 30°N (Sv)
CGCM3.1-T63
30 CNRM-CM3.0
CSIRO-MK3.0
GFDL-CM2.1
GISS-AOM
GISS-EH
20 GISS-ER
IAP-FGOALS1.0
INMCM3
IPSL-CM4
MIROC3.2-HIRES
10 MIROC3.2-MEDRES
MIUB-ECHO
MPI-ECHAM
MRI-CGCM2.3.2
NCAR-CCSM3.0
UKMO-HADLEY
0
1900 2000 2100 2200
Year
Figure 10.15. Evolution of the Atlantic meridional overturning circulation (MOC) at 30°N in simulations with the suite of comprehensive coupled climate models (see Table 8.1
for model details) from 1850 to 2100 using 20th Century Climate in Coupled Models (20C3M) simulations for 1850 to 1999 and the SRES A1B emissions scenario for 1999 to
2100. Some of the models continue the integration to year 2200 with the forcing held constant at the values of year 2100. Observationally based estimates of late-20th century
MOC are shown as vertical bars on the left. Three simulations show a steady or rapid slow down of the MOC that is unrelated to the forcing; a few others have late-20th century
simulated values that are inconsistent with observational estimates. Of the model simulations consistent with the late-20th century observational estimates, no simulation
351960 to 1990
shows an increase in the MOC during the 21st century; reductions range from indistinguishable within the simulated natural variability to over 50% relative to the
mean; and none of the models projects an abrupt transition to an off state of the MOC. Adapted from Schmittner et al. (2005) with additions.Despite this weakening of Global Climate Projections Chapter 10
the MOC, the North
Atlantic region and
surrounding regions are
still projected to warm as
radiation wins
Projected T change
(IPCC 2007)
Figure 10.8. Multi-model mean of annual mean surface warming (surface air temperature change, °C) for the scenarios B1 (top), A1B (middle) and A2 (bottom), and three
time periods, 2011 to 2030 (left), 2046 to 2065 (middle) and 2080 to 2099 (right). Stippling is omitted for clarity (see text). Anomalies are relative to the average of the period
1980 to 1999. Results for individual models can be seen in the Supplementary Material for this chapter.
256 MICHAEL VELLINGA AND RICHARD A. WOOD
particularly for the same scenario A1B. Furthermore, the zonal central North Atlantic and the far south Pacific in 2011 to 2030
means over land and ocean considered above are representative is the mean change less than the standard deviation, in part a
of much of the small differences in warming ratio. While there result of ocean model limitations there (Section 8.3.2). Some
is some influence of differences in forcing patterns among the regions of high-latitude surface cooling occur in individual
Which is
scenarios, and of effects of oceanic uptake and heat transport in models.
modifying the patterns over time, there is also support for the The surface warming fields for the extratropical winter and
role of atmospheric heat transport in offsetting such influences summer seasons, December to February (DJF) and June to
consistent with (e.g., Boer and Yu, 2003b; Watterson and Dix, 2005). Dufresne
et al. (2005) show that aerosol contributes a modest cooling of
the Northern Hemisphere (NH) up to the mid-21st century in
August (JJA), are shown for scenario A1B in Figure 10.9. The
high-latitude warming is rather seasonal, being larger in winter
as a result of sea ice and snow, as noted in Chapter 9 of the
the limited T the A2 scenario.
Such similarities in patterns of change have been described
by Mitchell (2003) and Harvey (2004). They aid the efficient
TAR. However, the relatively small warming in southern South
America is more extensive in southern winter. Similar patterns
of change in earlier model simulations are described by Giorgi
impact of an presentation of the broad scale multi-model results, as patterns
depicted for the standard A1B 2080 to 2099 case are usually
typical of other cases. This largely applies to other seasons and
et al. (2001).
10.3.2.2 Cloud and Diurnal Cycle
MOC shutdown also other variables under consideration here. Where there is
similarity of normalised changes, values for other cases can be In addition to being an important link to humidity and
estimated by scaling by the appropriate ratio of global means precipitation, cloud cover plays an important role for the
(Vellinga and from Table 10.5. Note that for some quantities like variability
and extremes, such scaling is unlikely to work. The use of such
sensitivity of the general circulation models (GCMs; e.g., Soden
and Held, 2006) and for the diurnal temperature range (DTR) over
Wood 2002)
scaled results in combination with global warmings from simple land (e.g., Dai and Trenberth, 2004 and references therein) so
models is discussed in Section 11.10.1. this section considers the projection of these variables now made
As for the zonal means (aside from the Arctic Ocean), possible by multi-model ensembles. Cloud radiative feedbacks
consistency in local warmings among the models is high
(stippling is omitted in Figure 10.8 for clarity). Only in the
36
to greenhouse gas forcing are sensitive to the elevation, latitude
and hence temperature of the clouds, in addition to their optical
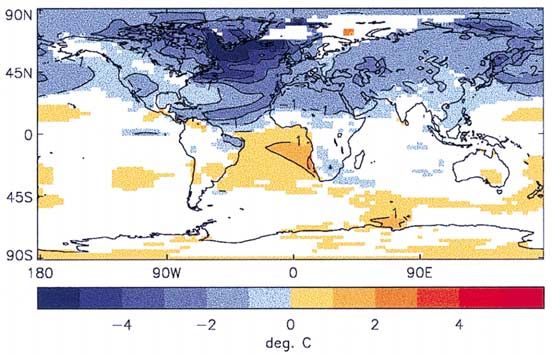
Figure 3. Change in surface air temperature during years 20–30 after the collapse of the THC. Areas
where766
the anomaly is not significant have been masked.Which is not to say Europe has not
climate change to worry about
37Models robustly produce an imminent, or already underway,
further aridification of Mediterranean region that is scary (and
has nothing at all to do with ocean circulation).
38Maximum summer T anomaly over W. Europe 1949-2006 Minimum summer T anomaly over W. Europe 1949-2006 39
Conclusion

The climate system is so rich, complex, and still
not well understood that the current emphasis on
the limited impacts of the Gulf Stream and North
Atlantic Ocean circulation is a serious distraction
of effort and resources when many regions of the
world face a truly worrying future, even in the near-
term.

Priorities should shift to:

Subtropical droughts
Summer heat waves
Loss of glacial ice forcing sea level rise
Severe storms and extreme weather
Water, water, water (and not so much temperature)
                                             40
Vous pouvez aussi lire