Travail de fin d'études et stage BR - Travail de fin d'études : Using passive cooling techniques to improve resilience to global warming of nearly ...
←
→
Transcription du contenu de la page
Si votre navigateur ne rend pas la page correctement, lisez s'il vous plaît le contenu de la page ci-dessous
https://lib.uliege.be https://matheo.uliege.be

 Travail de fin d'études et stage[BR]- Travail de fin d'études : Using passive
 cooling techniques to improve resilience to global warming of nearly
 zero-energy buildings[BR]- Stage d'insertion professionnelle

 Auteur : Zeoli, Alanis
 Promoteur(s) : Lemort, Vincent
 Faculté : Faculté des Sciences appliquées
 Diplôme : Master en ingénieur civil électromécanicien, à finalité spécialisée en énergétique
 Année académique : 2020-2021
 URI/URL : http://hdl.handle.net/2268.2/11569

Avertissement à l'attention des usagers :

Tous les documents placés en accès ouvert sur le site le site MatheO sont protégés par le droit d'auteur. Conformément
aux principes énoncés par la "Budapest Open Access Initiative"(BOAI, 2002), l'utilisateur du site peut lire, télécharger,
copier, transmettre, imprimer, chercher ou faire un lien vers le texte intégral de ces documents, les disséquer pour les
indexer, s'en servir de données pour un logiciel, ou s'en servir à toute autre fin légale (ou prévue par la réglementation
relative au droit d'auteur). Toute utilisation du document à des fins commerciales est strictement interdite.

Par ailleurs, l'utilisateur s'engage à respecter les droits moraux de l'auteur, principalement le droit à l'intégrité de l'oeuvre
et le droit de paternité et ce dans toute utilisation que l'utilisateur entreprend. Ainsi, à titre d'exemple, lorsqu'il reproduira
un document par extrait ou dans son intégralité, l'utilisateur citera de manière complète les sources telles que
mentionnées ci-dessus. Toute utilisation non explicitement autorisée ci-avant (telle que par exemple, la modification du
document ou son résumé) nécessite l'autorisation préalable et expresse des auteurs ou de leurs ayants droit.

i

 AKNOWLEDGEMENT
I would like to thank all the people who helped me make this work a reality.
First, I would like to thank my two supervisors, Pierre Gustin and Vincent Lemort. I thank Pierre Gustin for
giving me the opportunity to realise an unforgettable internship at Ecorce, for his wise advice and for the time
he devoted me for 80 days. I thank Vincent Lemort for his guidance and time and for the opportunity he gave
me to go further in this work with a PhD.
I thank the wonderful team of Ecorce for letting me in for these four months, especially Sophie Haine for her
good mood during those uncommon times and the countless cups of tea.
I also thank M. Shady Attia for his advice and support, as well as the other members of the Jury for taking the
time to read this work.
I am grateful to Sébastien Doutreloup for taking the time to introduce me to the complexity of climatic
simulations and to Essam Elnagar for sharing his information about ventilative cooling and for his enthusiasm.
I also thank Johan Haerbele for his precious help with the simulation software.
Finally, I would like to deeply thank my family, my partner and my friends for their unfailing support.
ii

 ABSTRACT
With climate change, the energy consumption of buildings for cooling purposes is expected to rise, further
enhancing global warming through the increase of greenhouse gas emissions. To break this vicious circle, it is
essential to decrease the anthropogenic CO2 emissions by lessening the energy consumption in all sectors.
Buildings are responsible for 40% of energy consumption in the European Union, according to the International
Energy Agency (IEA). The urge to build more energy-efficient buildings resulted in the emergence of nearly zero-
energy buildings (nZEB). However, the specifications the nZEB design should comply with might not be
sufficient to prevent the risk of overheating in summer, hence the purchase of an active cooling system.
Passive cooling techniques are investigated through a dynamic simulation of a nearly zero-energy dwelling. Their
efficiency is assessed based on their ability to improve thermal comfort while limiting the increase in energy
consumption. Thermal comfort is measured based on the theory of adaptative comfort which is the most relevant
for a residential building. The passive cooling techniques can be combined to ensure the resilience of the building
to global warming. It was found that the most efficient techniques are the ones relying on ventilative cooling. In
Western Europe, day cooling should be combined with night cooling to reduce the overheating risk and improve
thermal comfort by 39%. Solar protections and smart glazing also offer an efficient protection against
overheating. They improve thermal comfort by respectively 34 and 22%.
The effectiveness of the combined passive cooling techniques is studied over an extreme meteorological event,
which is likely to occur by 2100 if nothing is done to prevent global warming. Twenty days of intense heat are
studied to evaluate the resilience of a nZEB. It was found that the most efficient combination includes night
cooling, thermochromic glazing and adiabatic cooling. Adiabatic cooling is particularly efficient during heat
waves. Those techniques allow to decrease the indoor temperature by almost 10°C. However, occupants’
behaviour could have a negative impact on the cooling techniques efficiency.
iii

 RESUME
Avec le dérèglement climatique, on s’attend à une augmentation de la consommation de froid des bâtiments, et
donc de la production de gaz à effet de serre, ce qui aura pour effet d’amplifier le réchauffement climatique. Afin
de briser ce cercle vicieux, il est impératif de tout mettre en œuvre pour diminuer les émissions de CO2 et la
consommation énergétique en général. Dans l’union européenne, les bâtiments sont responsables de 40% de la
consommation énergétique, selon une étude de l’IEA (International Energy Agency). Les bâtiments dits “quasi
zéro énergie” (qZEN) résultent de ce désir d’accroitre l’efficacité énergétique des bâtiments. Cependant, les
spécifications imposées par le label qZEN pourraient ne pas être suffisantes pour empêcher le risque de
surchauffe en été, et donc l’achat d’un système de refroidissement actif par les occupants.
Ce document vise à étudier différentes techniques de refroidissement passif via la simulation dynamique d’un
appartement qZEN. L’efficacité de ces méthodes est évaluée sur base de leur capacité à accroitre la sensation de
confort thermique tout en limitant au maximum leur impact sur la consommation énergétique du bâtiment. Le
confort thermique est mesuré via la théorie du confort adaptatif. Cette théorie étant la plus adaptée à un
bâtiment résidentiel. Les techniques de refroidissement passif peuvent ensuite être combinées pour garantir la
résilience du bâtiment au réchauffement climatique. Les techniques les plus efficaces sont basées sur le
refroidissement par la ventilation. En Europe de l’Ouest, la ventilation de jour doit être combinée avec de la
ventilation de nuit pour réduire significativement le risque de surchauffe et augmenter le confort thermique de
39%. Les protections solaires et les vitrages dit “intelligents” sont aussi des mesures efficaces contre la surchauffe.
Ils augmentent le confort thermique de 34 et 22% respectivement.
L’efficacité des combinaisons des méthodes est étudiée lors d’un événement météorologique extrême. Ce type
d’événement est susceptible de se produire régulièrement d’ici 2100 si rien n’est mis en place pour lutter contre
le dérèglement climatique. La résilience du bâtiment qZEN est étudiée sur vingt jours d’intense chaleur. La
combinaison la plus efficace inclut la ventilation de nuit, le vitrage thermochromique et le refroidissement
adiabatique, qui est particulièrement efficace durant les vagues de chaleur. Ces techniques permettent de
diminuer la température intérieure de presque 10°C. Cependant, le comportement des occupants et la manière
dont ils gèrent leur bâtiment peut avoir un impact néfaste sur l’efficacité des techniques de refroidissement.

iv

Table of Contents

AKNOWLEDGEMENT I

ABSTRACT II

RESUME III

1. INTRODUCTION 1

2. DESCRIPTION OF THE BASELINE SIMULATION MODEL 4

2.1. Theory of the reference building 4

2.2. Presentation of used software 5
 EES 5
 IES VE 5

2.3. Description of the building characteristics and simulation model parameters 5
 Building geometry 5
 Building envelope 6
 Furniture model 7
 Systems 7
 2.3.4.1. Ventilation system 7
 2.3.4.2. Heating system 10
 Operation 11
 2.3.5.1. Internal gains 11
 2.3.5.2. Domestic hot water consumption 12
 Thermal zoning 12

2.4. Assessment of the representativeness of the building 12

2.5. Location and climate 13
 Description of 2020 climate 13
 Obtaining weather conditions with the MAR model 14
 Choice of weather data for the baseline 15
 Analysis of global warming simulations 16
 Extreme meteorological event 18

2.6. Conclusion 19

3. MODEL CALIBRATION AND SENSITIVITY ANALYSIS 20

3.1. Building model validation and calibration 20
 Theoretical background 20
 Comparative testing of EES and VE 21

3.2. Sensitivity analysis 23

3.3. Conclusion 24
v

4. THERMAL COMFORT ANALYSIS 25

4.1. Theory of thermal comfort 25

4.2. Thermal comfort analysis for the baseline 27

4.3. Evolution of thermal comfort with global warming 28
 Evolution of adaptative thermal comfort 28
 Comparison of the thermal comfort criteria 29
 Limitations of the theory of thermal comfort 30

4.4. Causes of thermal discomfort 30
 North-oriented rooms 30
 South-oriented rooms 31

4.5. Conclusion 31

5. PASSIVE COOLING TECHNIQUES 32

5.1. Definition of a passive cooling technique 32

5.2. Hypothesis on equipment consumption 32

5.3. Improvements aiming at decreasing solar gains 33
 External movable solar shades 34
 Fixed solar shading 35
 Solar glazing 36
 Thermochromic smart windows 37
 Comparison 38

5.4. Cooling through natural ventilation 38
 Day cooling through natural ventilation 39
 Night cooling 42
 Comparison 42

5.5. Adiabatic cooling 43

5.6. Building envelope improvements 44
 Cool materials 44

5.7. Conclusion 45

6. COMPARISON OF PASSIVE COOLING TECHNIQUES 46

6.1. Impact of passive cooling techniques on energy consumption and thermal comfort 46

6.2. Combining passive cooling techniques 47

6.3. Resilience of the building to global warming 47

6.4. Limitations of the passive cooling techniques 49

7. FUTURE WORK AND CONCLUSION 51
vi

7.1. Conclusion 51

7.1. Future work 51

REFERENCES 53

APPENDIX A 58

A.1. Building envelope 58

A.2. ISO 17772: Energy performance of buildings – Indoor environmental Quality – part 1: Indoor
environmental input parameters for the design and assessment of energy performance of buildings 59

APPENDIX B 60

B.1. Detailed equations of the EES model 60

B.2. Comparison between the EES and VE models 61
 Solar gains 61
 Results analysis 64
 Other sources of differences 64

APPENDIX C 67

C.1. Heating design and energy consumption analysis 67

APPENDIX D 69

D.1. Modelling occupants’ behaviour for window opening based on Haldi & Robison stochastic model 69
1

 1. INTRODUCTION
Nowadays, global warming has become a major concern, and we regularly hear about its disastrous
consequences, threatening the life quality of current and future generations. Global warming is
characterised by a progressive increase of the average atmospheric temperature, strictly related to
anthropogenic greenhouse gases emissions in the atmosphere due to the intensive exploitation of fossil
fuels in contemporary societies. To slow down or even reverse such upward trend, human beings should
strive to drastically decrease their CO2 emissions, hence limiting the effects of global warming.
The residential building sector is one of the largest energy consumers in most countries of the world. The
energy is used mainly for heating and cooling purposes. The fossil energy is used either directly (mostly
for heating) or indirectly, through the consumption of electricity, which CO2 footprint depends on the
energetic mix of the country. Climate change impacts the energy performance of buildings by lessening
thermal comfort and increasing the energy demand for space cooling. Therefore, the energy consumption
of buildings affects global warming, which in turn leads to the increment of such consumption, resulting
in a vicious circle that needs to be broken to tackle the crucial issues of our generation [1].
To limit the effects of global warming and decrease the greenhouse gas emissions, the European
commission recently published the 2050 long-term strategy, urging all Member States to reduce their CO2
emissions down to zero. To reach this objective, they should limit CO2 emissions in all the economic
sectors, including the residential sector. In Belgium, the energy consumption of residential buildings
accounts for about 20% of the national energy consumption. Of those 20%, 74% of the energy is used
for heating (see Figure 1), which almost exclusively uses fossil fuels, such as oil or natural gas. Two solutions
have been identified to limit the fossil fuel consumption of residential buildings: decrease the energy
consumption through energy efficiency improvements and behaviour changes and direct the energy mix
toward greener sources.
Some directives emerged from this desire to reduce the environmental footprint of EU. On the one hand,
directives such as Ecodesign or energy labelling guide consumers toward more efficient systems and
equipment. On the other hand, the energy performance of building directive (EPBD) resulted in the
emergence of nearly zero-energy buildings (nZEBs). Those buildings are better insulated, hence more
energy-efficient [2].
 Figure 1 – Final energy consumption per sector and Final energy use of households in 2017 in Belgium [2].

 Industry Heating
 19% 2% 12%
 Transport 26% Cooling

 12%
 Residential DHW
 13%

 Services Cooking
 74%
 22%
 Non energetic 20% Lighting &
 use Equipment

Currently, most Belgian residential buildings are not conditioned, as shown by the cooling energy
consumption of households. However, together with the emergence of nZEBs and the global warming,
the cooling needs of such buildings are expected to rise. Due to their better insulation, the heat release in
nZEBs in more difficult, resulting in a higher overheating risk. Many recent scientific studies focused on
this strong link between global warming and building energy performance and some of them are reviewed
to position the present work in relation to what has already been done to date.
2

Rahdi [3] studied the consequences of global warming on the energy performance of air-conditioned
residential buildings in the United Arab Emirates. His study has shown that a rise in the ambient air
temperature by 5.9°C in Al-Ain city is likely to increase the energy used for residential cooling by 23.5%,
resulting in a significant increase in CO2 emissions. The use of thermal mass and thermal insulation has
been demonstrated to be an effective measure against overheating. Emphasis is also made on the window
design which can provide energy savings of 6.8-8.1%.
Santamouris et al. [4] reviewed the impact of urban heat island (UHI) and global warming on energy and
electricity demand of buildings. The urban heat island effect is discussed later in this work. Combined
with global warming, it results in an increase of the ambient temperature and an intensification of the
energy consumption for cooling purposes of buildings and other structures. At the same time, in heating-
dominated climates, a rise of the ambient temperature may offer energy savings. The major impact of
ambient temperature rise is related to the possible increase of electricity demand peaks that would compel
power management institutions to build additional power plants and probably increase the cost of energy
supply. Depending on the characteristics of the building stock, climate zone, urban form, and type of
provided energy services, the potential increase of electricity demand per degree of temperature rise varies
between 0.5 and 8.5% while the peak electricity demand could increase by 0.45 to 4.6%. To reduce the
impact of urban heat island and global warming, building and urban structures must be adapted to the
specific climate conditions. The development of low energy or close to zero energy buildings may
significantly reduce the energy needs, especially if developed in parallel with the use of advanced urban
adaptation and mitigation techniques to limit the rise in ambient temperature.
Closer to the region we are interested in, Hamdy et al. [5] studied the impact of climate change on the
overheating risk in Dutch dwellings. They concluded there is high risk of overheating in dwellings with
higher solar gains and/or lower heat transmission, i.e. in new dwellings with high insulation levels and no
protection against direct solar irradiation. Ventilative cooling and solar protection seem to be the most
effective adaptation measures against global warming. However, the potential of ventilative cooling will
decrease as global warming increases. Traditional adaptation opportunities such as natural ventilation,
solar shading, or a modification of occupants’ behaviour, might not be sufficient to keep the daily average
indoor temperature below 25°C in all dwelling types during the whole summer season.
Attia & Gobin [6] contributed to quantifying the impact of climate change on annual overheating hours
in newly constructed nZEBs. They concluded that the overheating hours of the 2050 and 2100 scenarios
with static and adaptative thermal comfort models exceed the acceptable upper thresholds of discomfort
in residential buildings. Failure to address overheating risk during design shall leave active cooling as one
of the most convenient choices for tenants and owners: the consequences will be catastrophic, resulting
in an increase in carbon emissions and hampering the energy transition.
All scientists concluded their work by warning the competent authorities about the imminence of the
global warming threat and the urge to take actions against the related energy consumption rise. Some of
them also investigated the available technologies to reduce or limit the overheating risk in buildings using
passive cooling. However, few studies address the combination of passive approaches in residential
buildings to improve their energy efficiency. Most studies focus on non-residential buildings.
Cooling techniques are gaining attention. Interest is mainly focused on passive cooling techniques, which,
contrary to active cooling techniques, do not rely on the use of an electricity-driven vapor compression
refrigerator. Passive cooling would allow to limit the electricity consumption for residential cooling.
However, the potential of passive cooling capacity is strongly linked to the outdoor climate as colder and
drier climates allow for larger capacities. With global warming, the Belgian climate is expected to become
hotter and drier and the interest of such techniques in this future climate should be evaluated, as well as
their capacity to reduce the imminent risk of thermal discomfort.
Two more studies have been conducted at the University of Liege by two students in the framework of
their master thesis. Ani Hovsepyan [7] studied the energy retrofit of a tertiary building and its resilience
to global warming while Camille Gobin [8] analysed the impact of global warming on thermal comfort
and energy efficiency of a passive building in Liege. She showed that the requirements of current passive
3

buildings might not be sufficient to guarantee thermal comfort in the future and she ended her work by
raising an interesting question:
 “How should the nZEB model be improved to avoid overheating risks and ensure resilience to global warming?”
This is the question the present work attempts to answer by combining several passive cooling techniques
to guarantee thermal comfort in an nZEB in summer. The present work aims at assessing the energy
consumption and thermal comfort of a residential building located in Belgium and their evolution under
global warming, assuming that no measure is taken to prevent its evolution. The investigation of the
existing passive cooling techniques also allows to propose some guidelines to ensure resilience of nZEBs
to global warming. Resilience is a frequently used term as it is closely linked to climate change. It can be
defined as the ability of a building to withstand disruptions caused by extreme weather events, man-made
disasters, power failure, change in use or atypical conditions and its capacity to adapt, learn and transform
after those events occur [9].
Some studies are currently lead at the University of Liege to predict the evolution of the energy demand
of the Walloon building stock. The present work could be integrated into that project, to study the impact
of global warming on a single building which could then be extrapolated to the nZEB building stock.
This work has been realised in the context of an internship in an engineering consulting company named
Ecorce. It also aims at connecting theory and practice by applying some techniques that sometimes remain
at the laboratory stage to real case studies.
The organisation of the manuscript follows the adopted methodology. Chapter 2 introduces the building
chosen as baseline. The case study geometry, envelope, system, and operation are detailed. Since the
building behaviour is studied through a dynamic simulation, the assumptions made are also developed.
Then the building location and climate are introduced. To simulate the climate evolution in Belgium
until 2100, a climatic model, called MAR, was used. The scenario considered to predict climate change is
a worst-case scenario, in which no measure is taken to prevent or lessen climate change and society
continues to rely on fossil energies for further development.
The building behaviour is modelled through a dynamic simulation made with IES Virtual Environment
software (VE), a building performance simulation (BPS) software. VE has a rather user-friendly interface
but must be used as a black box regarding the modelling equations. Since the studied building has not
been built yet, there is no available data to calibrate the model and make an empirical validation. To cope
with this lack of calibration, another model has been developed with EES. The EES model consists in
hand-written equations and is thus rather simplified. It shall allow to make a comparative testing of both
models. The results of the comparative testing are presented in Chapter 3 and the major differences
between the two models are overviewed. Chapter 4 analyses the results obtained for 2020 in terms of
thermal comfort and the latter is extrapolated in 2050 and 2100, if no measures are taken to prevent
overheating. Chapter 5 proposes several cooling techniques that could be applied to the building to limit
the risk of overheating in summer. Some combinations of techniques are reviewed in Chapter 6 and they
are used to assess the building resilience to global warming. Finally, the last chapter concludes this work
with a summary of the most relevant results and suggests some guidelines to build resilient buildings.
4

 2. DESCRIPTION OF THE BASELINE SIMULATION MODEL
This chapter deals with all the subjects related to the building simulation model. The BPS model is based
on a particular building and the results are thus applicable specifically to that building. However, if the
building is chosen wisely, it is possible to extend the conclusions to all the buildings belonging to the same
category. The concept of the reference building is introduced in the first section of this chapter. The
second section presents the majors characteristics, strengths and limitations of the two software used in
this study. In the third section, the form, envelope, system and operation of the studied dwelling are
detailed, and the parameters and hypotheses of the base case scenario are described. Based on those
characteristics, the reasons for considering the studied dwelling as a reference building are overviewed.
Finally, the last section addresses the building location and climate. The accuracy of the climatic model
and the associated hypotheses are discussed.

 2.1. Theory of the reference building
A BPS model can be either specific or generic. A specific model is built when studying a specific dwelling,
in the context of an energetic audit for example. BPS models allow to extrapolate the behaviour of a
building under different improvements to assess their efficiency. A generic model is built upon a reference
building and is generally used in the scientific community to draw conclusions that can be generalised to a
whole set of buildings.
According to Corgnati et al. [10] a reference building can be defined as “a building characterised by and
representative of its functionality and geographic location, including indoor and outdoor climate conditions. It aims to
represent typical and average building stock in terms of climatic conditions and functionality”. Reference buildings
are used in the scientific community as they allow to compare the results obtained by several researchers
without the bias introduced by the building itself. All modelers use the same reference building to begin
with the same starting point even though they do not use the same software. Although the building used
is the same for all the studies, the results obtained for the base case scenario can vary depending on the
modeler inputs or the software itself. This is discussed in the next section.
The data collected to create a reference building can be classified into four categories:
 • Form regards the type, size and general geometry of the building.
 • Envelope refers to the construction technologies and materials used in the building, providing a
 description of the thermophysical properties of the building envelope.
 • System mainly concerns the HVAC systems.
 • Operation consists of the operational parameters affecting the usage of the building, expressed
 through a set of schedules (occupancy, lighting, equipment, heating schedules).
There exist three types of reference buildings which differ by the way data about those four categories are
collected.
 • An Example reference building consists in an ideal building model defined based on experts’
 inquiries and assumptions. This methodology is used when no statistical data are available.
 Information come from various sources and are properly combined to provide the most probable
 building, within a selected location and usage.
 • A Real reference building is based on a real existing building with average characteristics that
 represent a specific building category. The advantage is that it allows to validate and calibrate the
 building model by carrying out a testing campaign.
 • A Theoretical reference building is an ideal building model defined by processing statistical data.
 The building is therefore made of the most commonly used materials and systems. It represents the
 average building of the studied category, but it requires enough data to generate a strong reference
 building, hence more time for data processing.
The characteristics of the nZEB dwelling used in the present work are presented in section 2.3. Section 2.4
discussed the reasons for considering the chosen dwelling as a reference building.
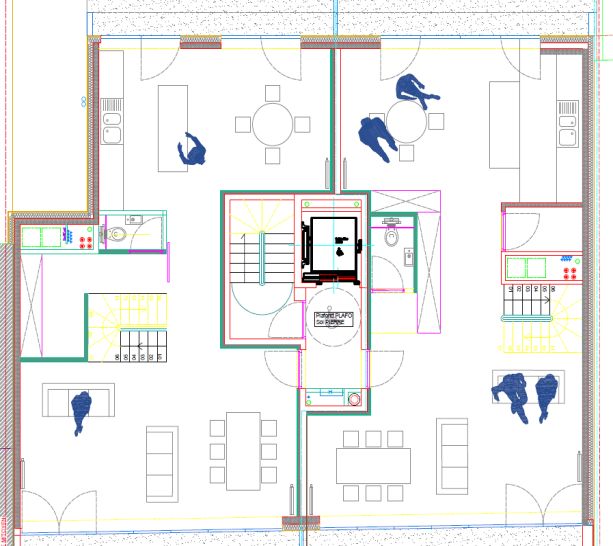
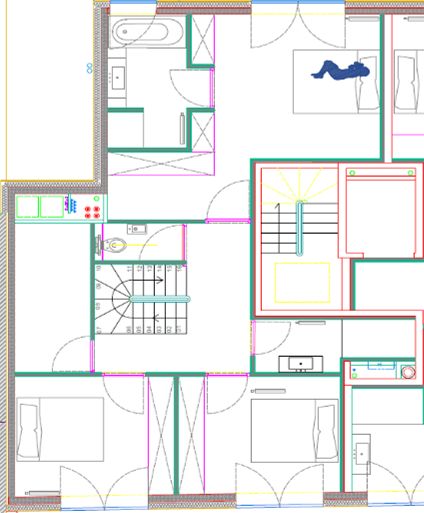
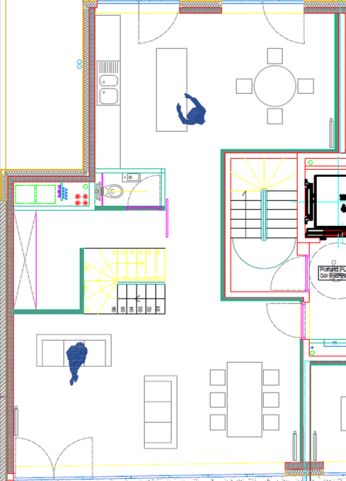
5

 2.2. Presentation of used software

 EES
EES (Engineering Equation Solver, pronounced ‘ease’) is a general equation-solving program that can
numerically solve thousands of coupled non-linear algebraic and differential equations. The program can
also be used to solve differential and integral equations, solve optimization problems, provide uncertainty
analyses and perform linear and non-linear regression. A major feature of EES is the high accuracy
thermodynamic and transport property database provided for hundreds of substances that can be used
with the equation solving capability. Moreover, EES automatically identifies and groups equations that
must be solved simultaneously. This feature simplifies the process for the user and ensures that the solver
always operates at optimum efficiency [11].
Since all the equations should be hand-written, the limitations of the software rapidly appear. The heat
transfer models and physical phenomena should remain simple enough to ensure the convergence of the
model. In the same way, it is important to limit the number of thermal zones to prevent being
overwhelmed by the number of equations to handle. The model created with EES thus gives a more
physical approach of the building model and is used to understand the impact of the various variables.

 IES VE
Contrary to EES, VE by IES is a software that has been specifically developed for building performance
simulation. It includes several modules that handle different features of the building. ModelIT is the tool
with which the geometry of the building is created, and the building location and weather file are set.
SunCast is a simulation tool used for shadow analysis based on the building geometry and the irradiation
from the weather file. From the position of the Sun, it determines the solar irradiation entering the
building at every hour of the year. ApacheSim is the core of the model. In this module the building
envelope characteristics are defined, as well as the operation schedules, the heating and ventilation
systems, etc. It is also the module from which the simulation is launched. Finally, the MacroFlo module
is used to model natural ventilation inside the building by defining a window opening schedule and some
opening characteristics.
VE has been approved by international standards such as ASHRAE 140, BESTEST, CIBSE, EU EN13791
and ISO, which all set criteria to respect to be recognised as a trustable BPS software.
Unlike EES, VE must be taken as a black box and the underlying equations are not accessible nor
modifiable by the user. It is thus more difficult to feel the physics of the model and the errors possibly
made when entering the parameters of the model are harder to detect.

 2.3. Description of the building characteristics and simulation model parameters
To generate the BPS model, information about the dwelling geometry, envelope, systems, and operation
are required. This section details the characteristics of the studied dwelling as well as the hypotheses made
when creating the thermal models.
The studied dwelling has not yet been built, but the building’s blueprint has already been drawn and the
EPB (energy building performance) file has already been encoded. The EPB file is generated by a software
based on the EPBD. It consists in a static analysis of the building and contains information about the
envelope, ventilation and heating systems, standard values of infiltration rate, and so on.

 Building geometry
The studied building will be located in Liege. The current existing dwelling will be demolished to free up
the space for the new building. The latter is 10-storey high with a cultural centre on the ground floor,
apartments from 1st to 7th floor and two duplexes on the last two floors. This study focuses on one of the
two duplexes. The living room of the duplexes is South-oriented, and the South-facing wall is constituted
6

of a bay window. Most recent constructions have a high window-to-wall ratio (WWR), mainly for aesthetic
reasons. For this building, the WWR is 0.36.
As shown on the 3D model of the duplex (see Figure 2), it is South-oriented and surrounded on the East
and West sides by adjacent buildings (shown in pink). It lies above another storey, so it is not in direct
contact with the ground. Figure 3 is a 2D view of the inside of the duplex. It has a total surface area of
173 m² and spreads on two floors. On the first floor, there is a living room, communicating with the
kitchen, as well as a laundry and toilets. The living room is South oriented, facing the Meuse and the
external wall is entirely constituted of a bay window. The second floor is composed of three rooms, two
South-facing and one North-facing, two bathrooms, toilets, and a storage room.

 Figure 2 – 3D model of the studied building (a) South view (b) North view.

 N N

 (a) (b)

 Figure 3 – Upper view of the studied duplex (a) first floor (b) second floor

 N

 Right Duplex Right Duplex

 (a) (b)

 Building envelope
One of the most important information about a building is its envelope. The wall composition plays a
major role in the heat losses to the external environment and in the thermal capacity of the building. The
wall materials and thicknesses determine its U-value (W/m²·K). The smaller the U-value the better the
building insulation. The Walloon Region imposes energy performance standards for buildings through
the EPBD, which is reviewed each year. Table 1 shows a comparison between the U-values of the building
walls and the U-value requirements of the EPBD 2020 [12]. All the walls are compliant with the EPBD
2020 and almost all of them also meet the standards of the passive house which impose a maximum U-
7

value of 0.15 W/m²·K for external walls [13]. More information about the building envelope can be found
in Appendix A.1.
The glazing has been defined in the EPB file of the building as triple-glazing. The frame of the window,
made of wood and aluminium, has a U-value of 0.9 W/m²·K, resulting in a net U-value of 0.6 W/m²·K,
in compliance with the EPBD. The U-value is even lower than the standard value of 0.8 W/m²·K for the
passive house.
The solar factor of the glazing is a ratio between the solar irradiation that actually enters the building and
the solar irradiation that reaches the outer surface of the window. The solar gains thus consist in the
irradiation that is directly transmitted through the window and the irradiation that is absorbed by the
window and re-emitted inside the room. The solar factor should be at least 50% to ensure that the gains
through the glazing are larger than the losses. For a passive house, a South-orientation is recommended
to maximise the solar gains. They should compensate for 40% of all the heat losses of the building [13].

 Table 1 – U-values of the building envelope.

 Maximum U-value
 U-value encoded in the
 authorised by the EPBD
 EPB [W/m²·K]
 [W/m²·K]
 External walls 0.152 0.24
 Wall between two
 0.198 1
 adjacent buildings
 Internal wall 0.452 1
 Roofing 0.081 0.24
 Floor/ceiling 0.132 0.24
 Window:
 Net U-value 0.6 1.5
 Glass only 0.6 1.1

 Furniture model
The room furniture can store energy which is released afterwards and can prevent overheating in summer.
Furniture adds inertia to the room and its global inertia is written as
 = (1 + )
with the furniture mass factor. Generally, the room thermal capacity is supposed to be 5 or 6 times
higher than that of air. This factor is mostly used in simulations that can be compared to measured data
to consider the change of density of heated air. When the room is heated, the air expands and its density
decreases. Hot air rises and creates a vertical temperature difference. There is a delay before the sensor
measures the rise in temperature of the room and this delay is taken into account by artificially increasing
the thermal capacity of the room in the simulation.

 Systems

2.3.4.1. Ventilation system
There are three contributions to air renewal in a building. Natural ventilation consists in opening windows
to guarantee a good indoor air quality. The air is renewed 5 to 40 times more than required. This non-
permanent action is desired but cannot be controlled. On the contrary, mechanical ventilation is a desired
and controlled action taken permanently to ensure a good indoor air quality. Finally, infiltration is an
undesired, uncontrolled and permanent phenomenon due to air flow through cracks.
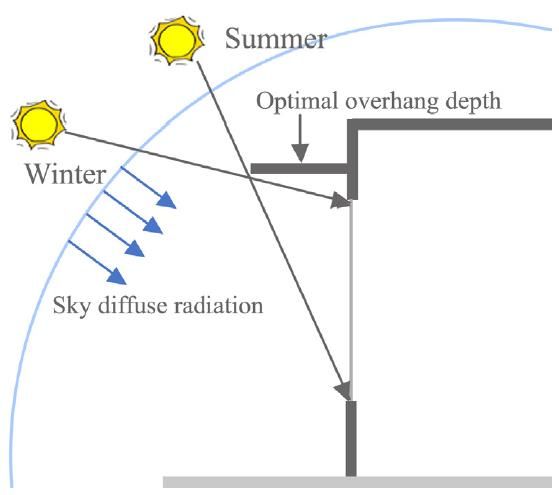
8

 a. Mechanical ventilation
The duplex is equipped with a type D ventilation system with a heat recovery module. Stale air should be
extracted from humid rooms, such as the bathrooms, toilets and kitchen, and fresh air must be supplied
in the living room and the bedrooms to ensure a good indoor air quality. The residential ventilation air
flow rates are given in norm NBN D50-001 and are specified in Table 2.

 Table 2 – Ventilation system: supply and exhaust air flow rates.

 1st FLOOR 2nd FLOOR
 Supply Exhaust Supply Exhaust
 m³/h (m³/h·m²) m³/h m³/h (m³/h·m²) m³/h
 Living 150 (3.6) Bedroom 165 (3.6)
 Kitchen 75 Bathroom 50 x 2
 Laundry 50 Toilet 25
 Toilet 25 Corridor 40
 Total 150 150 Total 165 125 +40

If the ventilation flows specified by the norm are used, the equilibrium between supply and exhaust is not
reached. It is necessary to add exhaust in some rooms to avoid having an over-pressurized building. For
the simulations, it has been decided to add an exhaust air flow rate of 40 m³/h in the corridor, as marked
in red in the table.
Table 2 also shows that the air flows at each floor are balanced. It is assumed that there is no ventilation
coupling through the stairs between both floors. In practice, there could be a coupling through the stairs
since the living room is South-oriented, hence has important solar gains, contrary to the corridor. The
warmer and lighter air of the living room could rise while the cooler and heavier air of the corridor would
tend to go down. However, the air exchange due to buoyancy forces is neglected.
The heat recovery module has an efficiency of 85% and is equipped with a by-pass system, as required by
the EPBD. In winter, the heat from the exhaust air is recovered to heat up the fresh supply air directly
coming from the outside and to avoid creating a local thermal discomfort due to cold air draught.
During transition seasons, the heat recovery module can be by-passed to perform free cooling. When the
indoor temperature becomes too high due to high internal or solar gains, the heat from the exhaust air is
not recovered and fresh air is supplied directly into the rooms. It allows to increase the heat losses through
ventilation, hence decrease the indoor temperature and improve thermal comfort. However, if the indoor
temperature becomes too high while the outdoor temperature is low, for example during a particularly
sunny winter day, the heat recovery module can be partially by-passed.
In summer, when the outdoor temperature is higher than the indoor temperature, it can be useful to stop
by-passing the heat recovery module to remove the excess heat from outdoor air and slow down the heating
process by preventing heat from entering the building for as long as possible. Figure 4 shows the flow chart
diagram used to compute the supply ventilation temperature, , , based on the indoor and outdoor
temperatures, respectively and . , is the exhaust air temperature.
9

 Figure 4 – Flow chart diagram of the supply ventilation temperature.

 YES NO
 < 23°

 YES NO
 > 16°
 Partial heat
 recovery

 YES NO
 > , = 16°
 Heat Remove excess
 HEX
 recovery heat from
 fully by
 outdoor air
 passed

 , = + 0.85 ( , − ) , =

 b. Natural ventilation
Several methods can be used to take advantage of natural ventilation in a building and their efficiencies
can be compared. The considered methods are described in more details in Chapter 5.
To model the natural ventilation in VE, the MacroFlo module shall be used. The required characteristics
to compute the air flow entering through the opening are the openable area, the exposure to the outside
environment and the opening category. Those parameters are presented in Table 3. In the case of the
studied building, the Southern facade is facing the Meuse and is exposed to wind while the North facade,
facing a building block, is considered as semi-exposed. Since the duplex is at the 8th floor of the building,
the building type is high-rise, and the wind speed is adapted accordingly.
The parameters that determine the opening schedule of the window are discussed in section 5.4.

 Table 3 – Definition of the opening types in MacroFlo.

 Living Kitchen Bedroom 1 Bedroom 2
 High-rise High-rise semi- High-rise semi- High-rise
 Exposure type
 exposed wall exposed wall exposed wall exposed wall
 Bottom-hung Bottom-hung
 Opening category Sliding window Sliding window
 window window
 Openable area 50% 50% 95% 95%
 Max angle open - - 10° 10°

 c. Infiltration
The infiltration rate inside the building cannot be known in advance. It can be obtained by performing a
blower door test. The building is pressurised to 50 Pa and the necessary air flow rate to maintain the
pressure difference is measured. This value is called the leakage rate at 50 Pa and is noted q50 (m³/h).
Commonly, the leakage rate is rather expressed in ach (air change per hour) and is noted n50. For a new
residential construction, the EPBD requires a value of n50 in the range of 0.6 to 1 ach [12], [13].
MacroFlo also offers the possibility to model the infiltration by defining a crack flow coefficient and a
crack length for each opening. However, since those values cannot be measured and the infiltration losses
are negligible, the infiltration rate is chosen to the theoretical value of 0.6 ach at 50 Pa.
10

2.3.4.2. Heating system
The duplex is heated through a traditional heating system composed of water radiators fed by a gas boiler.
The gas boiler feeds the whole building, but in the context of this study it will be assumed that it is unique
to the duplex. The radiators have not been dimensioned yet; their nominal power is deduced from the
simulations. The radiators are made of aluminium and their temperature regime is 70/50 °C.
 a. Temperature set point
The temperature set point is the temperature at which a room should be maintained during occupancy
period. Depending on the room purpose and on occupants’ clothing, the temperature set point can vary.
They are specified in norm EN 12831 [14] (see Table 4). Since those temperatures should only be reached
when the room is occupied, two heating strategies can be applied. The first strategy consists in keeping
the set point temperature all the time, even when the room is unoccupied. The second strategy is to turn
off the heating system during the night and to rely on the building inertia to keep the room temperature
near the set point. However, it is important to prevent temperature from dropping under 18°C, otherwise
it would take a larger heating power to bring the room back to the set point temperature. In this case,
since the building is properly insulated, meeting such a requirement does not cause major problems.

 Table 4 – Definition of the temperature set points for heating.

 Temperature
 Type of activity/clothing Room
 set point [°C]
 Room with normally dressed Kitchen
 Living 20
 people doing sedentary activity
 Sleeping Bedroom 18
 Room with under dressed people
 Bathroom 23
 doing sedentary activity
 Room with normally dressed Laundry
 people doing a short activity or Corridor 16
 simply passing through

 b. Heat load of the radiators
The rooms are heated up with aluminium radiators, but their heat load has not yet been sized. Several
methods can be used to size the radiators. Generally, some norms impose guidelines at a regional level
that should be carefully followed. For example, in Belgium, a software based on norm EN 12831 has been
developed. It realises a steady-state analysis of the heat losses when the outside temperature is -8 °C. The
radiators should be sized to compensate those losses. This design ignores the internal gains brought by
people, equipment, and lighting, as well as the solar gains. It thus consists in a worst-case scenario that
ensures that the building can always be heated at the desired set point temperature.
The heat load can also be computed through the dynamic simulation. The software adds the internal
gains, subtracts the heat losses, and deduces the heat load that must be applied to maintain the
temperature set point.
 c. Annual energy consumption
As far as the annual energy consumption of the building is concerned, there are binding limitations to be
respected for a building to be considered as an nZEB. On the one hand, according to the EPBD 2020,
the annual energy consumption of a new residential building should not exceed 115 kWh/m² ·year. On
the other hand, the passive house standard requires an annual energy consumption for domestic heating
of 15 kWh/m²·year, or 10 W/m² peak demand, and the overall energy needs should not exceed
42 kWh/m²·year [15], [12], [13].
11

 Operation
The building operation is characterised through a set of schedules describing occupancy, electric
appliances, lighting, heating, and consumption of domestic hot water. Since the building has no
characteristic operation, the operation schedules and consumptions should be defined based on
representative norms, i.e., norms ISO 17772, NBN EN 15193 and NBN EN 15251 [16]. More information
about norm ISO 17772 can be found in Appendix A.2.

2.3.5.1. Internal gains
Some internal gains can be added in the model to consider the heat produced by the occupants or the
energy gain of equipment such as television, fridge, oven, washing machine, dishwasher and other
domestic appliances that consume electricity and can release energy in the surrounding atmosphere. The
internal gains are divided into three categories: occupancy heat gain, lighting gain and equipment gain.
The heat production from lighting and equipment is strictly related to their power consumption. For each
type of internal gain, a schedule is specified as well as a power consumption/production.
 a. Occupancy heat gain
The occupancy heat gain corresponds to the heat produced by the occupants. Each occupant is supposed
to produce a certain amount of heat which depends on its metabolic rate. To describe the occupancy heat
gain, a heat rate production as well as an occupancy schedule are required.
The occupants’ metabolic rate is influenced by their activity, age and sex. For example, young children are
assumed to have a metabolic rate of 60 W while 100 W are generally considered for teenagers or adults
doing a sedentary activity [17]. According to norm ISO 17772, an average person is supposed to produce
70 W while sleeping and 100 W while doing a sedentary activity such as reading, watching TV, or eating.
One third of the energy emitted by an average person is released as latent energy.
The number of people occupying the building can be deduced based on the number of bedrooms. In this
case, the apartment is designed for four people. And they are all supposed to have an adult metabolic rate.
Contrary to a tertiary building such as an office or a school, the occupancy profile of a residential building
strongly varies depending on the occupants’ behaviour and occupation. ISO 17772 specifies the
occupancy schedule that should be used by default (see Figure 5). It is expressed as a modulating profile,
meaning that when the value of the occupancy profile at hour h is 1, all the occupants are present in the
apartment. The shape of the occupancy schedule suggests that the occupants are an active couple with two
children attending school. During daytime (from 6am to 10pm), the occupants are supposed to be evenly
distributed in the living areas, i.e., the kitchen and the living room.

 Figure 5 – Occupancy schedule.

 Bedroom Living rooms - Week Living rooms - Weekend
 1
 0.8
 0.6
 0.4
 0.2
 0
 0 1 2 3 4 5 6 7 8 9 10 11 12 13 14 15 16 17 18 19 20 21 22 23 24
 h

 b. Lighting gain

The second source of internal gain is lighting. The energy consumption related to luminaires can be found
in the norm NBN EN 15193, specifically dedicated to lighting [18]. A good approximation of the average
energy consumption of the building for lighting is to consider 6 W/m² in each room. Then the modulating
12

profile of Figure 6 can be applied. The lighting profile, found in norm ISO 17772, is supposed to be the
same during week and weekend.
 c. Equipment gain
The last internal gain to be considered is equipment gain. Just as in the case of occupancy profile, there
can be as many equipment profiles as equipment users. Norm ISO 17772 gives a default equipment
schedule for residential buildings, which is also shown in Figure 6. The energy consumption related to
equipment is supposed to be 3 W/m² in the living room, the kitchen, and the laundry, which are the
room where most of the electricity is consumed. The bedrooms and bathrooms are supposed to have an
energy consumption of 2 W/m². Those values are consistent with the annual consumption of electricity
of a 4-person residential building in Belgium, which has been estimated at 3 200 kWh/year in 2018 [19].
The total energy consumption of this dwelling is 2 850 kWh/year, or 16 kWh/m²·year.

 Figure 6 – Equipment and lighting schedules.

 Appliances Lighting
 1

 0.8

 0.6
 0.4

 0.2

 0
 0 1 2 3 4 5 6 7 8 9 10 11 12 13 14 15 16 17 18 19 20 21 22 23 24
 h

2.3.5.2. Domestic hot water consumption
Still according to norm ISO 17772, the global hot water (DHW) consumption of a residential apartment
is supposed to be 100 L/m²·year, for a total of 17.3 m3/year. 80% of the water is used in the bathrooms
and 20% in the kitchen.

 Thermal zoning
Sometimes, modelling all the physical zones of a building is too difficult and time-consuming. Zones that
are thermally similar can be gathered in one single thermal zone, reducing calculation time. To be gathered
in a thermal zone, rooms must have the same behaviour when it comes to:
 • Usage: all the rooms should have similar internal loads and usage schedules.
 • Temperature control: all rooms should have the same temperature set point.
 • Solar gains: all rooms should have the same orientation, solar shading, and glazing characteristics.
 • Ventilation: all rooms should be either humid (air exhaust) or dry (air supply).
The thermal zoning of the studied building and the attributed names are shown in Figure 7.

 2.4. Assessment of the representativeness of the building
The building studied in the present work belongs to the Belgian nZEB stock. It has been demonstrated
that its envelope is compliant with all the EPBD requirements, and the operation of the building has been
standardised following the specifications of norm ISO 17772. The only reason for which this dwelling
could not be considered as representative of other nZEBs is because of its geometry. The dwelling is a four-
person duplex located on the last floor of a 10-storey building. This case study is interesting since it gathers
all the conditions that could lead to overheating. First, the duplex is designed to be a family duplex, which
increases the internal gains. Then, as most passive houses, it is South-oriented to maximise the solar gains.
Because of its South-orientation, the high window-to-wall ratio and the fact that it is on the last floor of
the building, this duplex is prone to overheating. The results might not be generalised to the whole
13

building stock, even though nowadays new constructions tend to have a high South window-to-wall ratio.
But most of the conclusions of this work could be extended to other nZEBs to prevent overheating during
the design phase.
The reference building proposed in this study is thus a mix between a real and an example reference
building. The form and envelope of the building are based on a real existing building while systems and
operation are based on norms.
 Figure 7 – Division in thermal zones.

 Kitchen
 Bathroom 1
 Bedroom
 1

 Laundry Bathroom 2

 Corridor

 Living Bedroom 2

 2.5. Location and climate
Climate plays a key role in the energy consumption of any building, so it is important to use the
appropriate location settings for any analysis. The studied building is in Liege. According to the ASHRAE
climate zones, Belgium is part of zone 4A, meaning that the climate is considered as mixed humid.

 Description of 2020 climate
The Royal Institute of Meteorology (IRM) describes the year 2020 as exceptionally warm and sunny but
with precipitation close to normal in frequency and quantity [20]. The spring months and September were
particularly sunny compared to the average of 1991 to 2020. Globally, each month experienced higher
temperatures than average, making 2020 the warmest recorded year since measurements began in Uccle
in 1833, with an annual average temperature of 12.2°C. The previous record was 2018 with 11.9°C while
the average is 10.9°C.

 Figure 8 – Evolution of the temperature along the year in Belgium.

 2000 2011 2018 2019 2020
 25

 20
 Temperature [°C]

 15

 10

 5

 0
 JAN FEB MAR APR MAY JUN JUL AUG SEP OCT NOV DEC

Since 2010, the annual temperature tends to increase. The average annual temperature has increased from
10.5°C between 1981 and 2010 to 10.9°C between 1991 and 2020. Moreover, 2020 is the 6th consecutive
year experiencing a heat wave. Figure 8 shows the evolution of the monthly temperature since 2000. The
monthly temperatures in 2000 and 2011 are similar and close to the normal temperatures. 2018, 2019
14

and 2020, as a consequence of the global warming, have been warmer in summer than the beginning of
the century. The winter period on the other hand seems to remain stable.
Those observations from the IRM in Belgium have also been reported at a bigger scale in the Third
Assessment Report of the Intergovernmental Panel on Climate Change (IPCC) in 2001 [21].

 Obtaining weather conditions with the MAR model
When performing a dynamic simulation, information about the weather is required. VE gives access to
some Energy Plus weather files containing data for variables such as dry bulb and wet bulb temperatures,
wind speed and direction, direct and diffuse solar irradiation, or cloud cover for each hour of the year at
various locations. The nearest location for which VE has a weather file is St-Hubert, about 70 km South
of Liege. The available weather files are often TMY files. A Typical Meteorological Year is not a real year
but an average of the measured data over a 10-to-20-year period to smoothen the weather anomalies.
However, those files are generally old and with global warming, they can be obsolete. The files used in this
work have been generated at the Laboratory of Climatology and Topoclimatology of the University of
Liege with a regional climatic model called Modèle Atmosphérique Régional (MAR) that is used to make
projections of climate change in the greatest cities of Belgium.
Projections of climate change due to anthropogenic forcing, i.e. the increasing greenhouse gas (GHG)
concentration, are generated with modelling tools called coupled Atmosphere-Ocean General Circulation
Model (AOGCM). An AOGCM is a climatic model based on the Navier-Stokes equations applied to a
rotating sphere and on thermodynamics balance equations to include the energy sources. This model
allows to predict the atmosphere circulation as well as the ocean circulation. However, to give a good
representation of the ocean circulation, timescales of the magnitude of 0.01 to 0.001 seconds are required.
To avoid too long computation times while respecting the convergence condition of Courant-Friedrichs-
Lewy [22], the horizontal spatial resolution of AOGCMs is relatively coarse (150 to 600 km). AOGCMs
provide a good representation of the global average climate. However, regional climate is often influenced
by forcing and circulations that occur at the sub-AOGCM horizontal grid scale. Consequently, some
“regionalisation” techniques have been developed to create regional climate models (RCM), which are
AOGCMs nested in a limited area [21]. Compared to global circulation models, RCMs are calibrated for
a specific region, with a detailed physics developed for it. RCMs thus increase spatial resolution for an
identical computation time [23].
The AOGCM has been downscaled to an RCM by the University of Liege using the MAR. The MAR was
created in the end of the 20th century and was initially designed for polar regions. Since then, it has been
further developed at the University of Liege and adapted specifically for Belgium [24]. It allows to perform
high-resolution (5 km) simulations over Belgium [25] and it was used to create global warming simulations
for the largest Belgian cities from 2012 to 2100.
The RCM MAR characterises the current and future evolution of hydroclimatic conditions and global
irradiation [26]. However, even though the model was perfect, it could not make accurate predictions if
the initial conditions were not correct. Errors in the initial conditions would eventually be amplified,
pulling the prediction away from reality. To limit the risk of such errors, the climatic model is reanalysed,
meaning that it is adjusted to provide results as close as possible to the observations. Hersbach et al. define
a reanalysis model as an optimal combination of models and observations that provides consistent climate
variables and strives to ensure integrity and coherence in the representation of the main Earth system
cycles [27]. Historical simulations were performed with the MAR over the period 1980-2014.
Once the initial conditions have been determined, the climatic model also requires boundary conditions
and a plausible scenario for climate change predictions. As already stated, the regional circulation model
is nested in a limited area and the boundary conditions are provided by a larger scale climatic model,
called a global circulation model (GCM). There exist over thirty GCMs which better describe some regions
of the world. The MAR was forced at its boundaries with the three GCMs that best represent the current
atmospheric circulation over Western Europe.
Vous pouvez aussi lire