Using ensemble weather forecast in a risk based real time optimization of urban drainage systems
←
→
Transcription du contenu de la page
Si votre navigateur ne rend pas la page correctement, lisez s'il vous plaît le contenu de la page ci-dessous
La Houille Blanche, n° 2, 2015, p. 101-107                                                                                           DOI 10.1051/lhb/20150025
DOI 10.1051/lhb/20150025

                                            Using ensemble weather forecast in a risk based
                                           real time optimization of urban drainage systems
                           Vianney COURDENT1, Luca VEZZARO1,2, Peter Steen MIKKELSEN1, Ane Loft MOLLERUP3, Morten GRUM2

1.
   Department of Environmental Engineering ‑ Technical University of Denmark, Anker Engelunds Vej 1, 2800 Kongens Lyngby, Denmark ‑
s111535@student.dtu.dk, luve@env.dtu.dk, psmi@env.dtu.dk
2.
   Krüger A/S ‑ Veolia Water Solution and Technologies, Gladsaxevej 363 2860 Søborg, Denmark ‑ mg@kruger.dk
3.
   HOFOR A/S ‑ Ørestads Boulevard 35, 230 Kbh. S., Denmark ‑ molle@hofor.dk

                             ABSTRACT. – Global Real Time Control (RTC) of urban drainage system is increasingly seen as cost‑effective solu‑
                             tion in order to respond to increasing performance demand (e.g. reduction of Combined Sewer Overflow, protection of
                             sensitive areas as bathing water etc.). The Dynamic Overflow Risk Assessment (DORA) strategy was developed to oper‑
                             ate Urban Drainage Systems (UDS) in order to minimize the expected overflow risk by considering the water volume
                             presently stored in the drainage network, the expected runoff volume based on a 2‑hours radar forecast model and an
                             estimated uncertainty of the runoff forecast. However, such temporal horizon (1‑2 hours) is relatively short when used
                             for the operation of large storage facilities, which may require a few days to be emptied. This limits the performance
                             of the optimization and control in reducing combined sewer overflow and in preparing for possible flooding. Based
                             on DORA’s approach, this study investigated the implementation of long forecast horizon using an ensemble forecast
                             from a Numerical Weather Prediction (NWP) model. The uncertainty of the prediction is characterized by an ensemble
                             of 25 forecast scenarios. According to the status of the UDS and the forecasted runoff volumes, the objectives for the
                             control strategies might vary from optimization of water volumes to reduction of CSO risk. Thus different modes are
                             implemented in DORA‑LF (Long Forecast) in order to adjust the control strategies to the situations. In order to handle
                             the long forecast, the horizon is divided into multiple and variable time step. This new approach was tested on selected
                             rain events and shows an improvement in the protection of sensitive areas during long or/and coupled events by allowing
                             anticipated CSO in low sensitivity areas.

                             Key‑words: Overflows risk, Model Predictive Control, Urban water management, Numerical Weather Prediction model

                                        Utilisation de prévisions météorologiques longue durée pour améliorer
                                                    la gestion dynamique du réseau d’assainissement

                             RÉSUMÉ. – La gestion en temps réel des réseaux d’assainissement représente une solution économique pour répondre
                             à la recherche croissante de performance (e.g. réduction des rejets de réseaux unitaires, protection des milieux aqua‑
                             tiques etc.). La stratégie DORA (Dynamic Overflow Risk Assessment) a été développée pour contrôler les réseaux
                             d’assainissement dans le but de réduire les rejets d’eau usée en opérant le système de façon à utiliser sa capacité de
                             stockage totale. Pour ce faire DORA prend en considération le volume d’eau initialement présent dans le système et
                             les prévisions de ruissellement basées sur 2 heures de prévisions météorologiques provenant de radars. L’incertitude
                             des prévisions météorologiques est prise en compte dans l’optimisation via une distribution gamma. Pour chaque plan
                             d’eau, le volume d’eau usée rejeté est associé à un coût par mètre cube représentant sa vulnérabilité. Cependant, une
                             période de prévision de 2 heures est relativement courte lorsqu’utilisé pour la gestion de grands bassins de rétention
                             pouvant nécessiter plusieurs jours à vider. Cette étude a pour objectif de développer l’utilisation de prévisions météo‑
                             rologiques de longues durées en se basant sur la stratégie de DORA. Pour ce faire, un ensemble de 25 scénarios de
                             55 heures provenant d’un modèle de Prévision Numérique du Temps (PNT) est utilisé. Plusieurs stratégies de gestions
                             sont utilisées, elles varient en fonction des conditions du réseau d’assainissement et des prévisions météorologiques.
                             Ainsi, 3 différents configurations ont été créées dans DORA‑LF pour ajuster les objectifs de contrôle en fonction des
                             données (« Dry », « No CSO » et « CSO »). Afin de simuler les variations temporelles des contrôles lors de l’optimisa‑
                             tion, l’horizon temporel est divisé en intervalles de temps de durées variables. Cette nouvelle approche a été testée sur
                             un exemple théorique inspiré du bassin versant d’Amager, Copenhague, Danemark. Sur le panel d’évènements pluvieux
                             testés, l’utilisation de longues prévisions météorologiques ne permet pas de réduire les volumes de rejets liés aux
                             événements de courtes durées avec une forte intensité. Par contre lors d’évènements de longues durées et/ou couplés,
                             l’utilisation de longues prévisions météorologiques permet, grâce à des rejets anticipés dans des zones peu vulnérables,
                             d’améliorer la protection de zones sensibles.

                             Mots‑clés : Contrôle en Temps Réel, Prévision Numérique du Temps (PNT), Commande Prédictive, Rejets polluants

                                                                                         101
                             Article published by SHF and available at http://www.shf-lhb.org or http://dx.doi.org/10.1051/lhb/20150025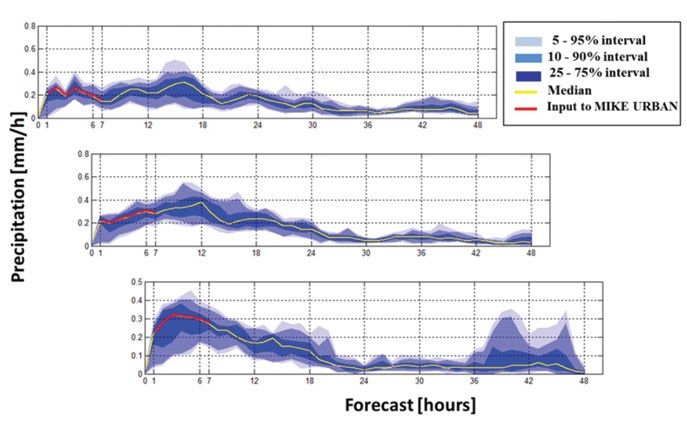
DOI 10.1051/lhb/20150025 La Houille Blanche, n° 2, 2015, p. 101-107
I. INTRODUCTION (upper part of Figure 1), and (ii) the current measurements
from the UDS (lower part of Figure 1)
Real Time Control (RTC) can be used to optimize the This proposed new control strategy, DORA‑LF, was
operation of the Urban Drainage System (UDS) and hence tested on a semi‑hypothetical catchment, inspired by a sub‑
leads to a better performance. Therefore, RTC offers a rel‑ catchment in Copenhagen, Denmark. The catchment was
evant alternative to the construction of expensive storage simulated by using a deterministic hydraulic model (MIKE
facilities by optimizing the use of current available storage. URBAN – www.mikebydhi.com) which was connected with
Weather radar nowcasts can provide information about the a Matlab implementation of DORA. The results of this study
future evolution of rainfall, enabling RTC strategies to opti‑ provide the basis for a full integration of NWP models into
mize the UDS based on the expected runoff volumes. For global RTC strategies, contributing to a further improvement
example, the Dynamic Overflow Risk Assessment (DORA) of the performance of UDS systems.
approach [Vezzaro and Grum, 2012] includes a two hour
radar‑based rainfall forecasts, along with their estimated
uncertainty in the UDS optimization process. DORA is II. METHODOLOGY
under implementation in two Danish urban catchments in
the city centre of Aarhus and Copenhagen (see [Grum et al. II.1. Dynamic Overflow Risk Assessment (DORA)
2011]) and it represents the most recent example of integra‑ The Dynamic Overflow Risk Assessment (DORA) strat‑
tion of radar‑nowcasts into schemes. egy (see [Vezzaro and Grum, 2012] for further details) aims
However, the temporal horizon of radar‑based predictions at reducing the risk of overflow (quantified as the product
(1‑2 hours) used in DORA is relatively short when used for of overflow cost and its probability) by minimizing a global
to the operation of large storage facilities, which may require cost function through an optimization routine. The global cost
longer time intervals (up to days) to be emptied. This limits function considers:
the performance of the RTC in reducing combined sewer • The current water volume stored in the entire system,
overflow and in preparing for possible flooding. allowing for a better usage of the storage capacity across
The objective of this study is to develop a control strategy the entire drainage network. This information is provided by
based on long forecasts and assess its potential with respect online measurements from the system (water levels in the
to mitigation of Combined Sewer Overflow (CSO). This is storage basins).
achieved by incorporating long forecasts (up to 55 hours) • The expected runoff volume in each sub‑catchment in the
from a Numerical Weather Prediction (NWP) model into an near future (2 hr), thus allocating greater storage in the sys‑
integrated control scheme for the UDS. The NWP forecasts tem where needed. Radar‑based runoff nowcasts [Thorndahl
(an ensemble of model simulations developed by the Danish et al., 2012], which are updated every 10 minutes, are used
Meteorological Institute) are integrated in the existing for this purpose.
radar‑based DORA control scheme. This new control strat‑ • The uncertainty in the runoff volume nowcasts, which is
egy, DORA‑LF (Long Forecast), was implemented in Matlab used to estimate the overflow risk at each basin. Currently,
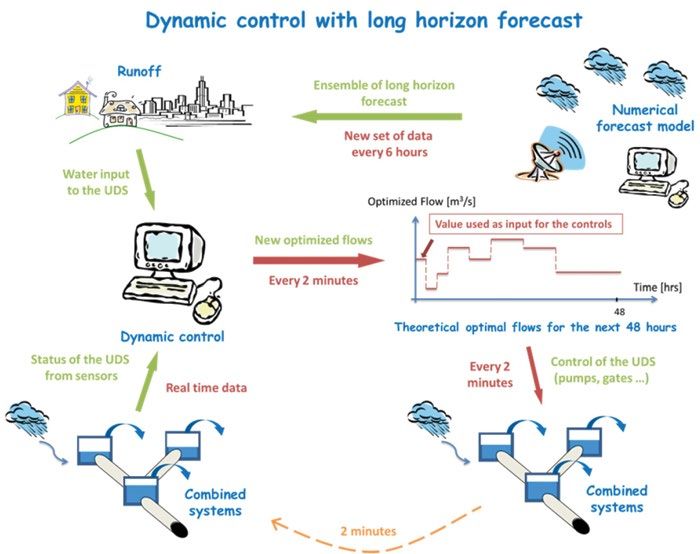
according to the scheme outline in Figure 1. DORA‑LF uncertainty is described by a fixed gamma distribution, but
identifies the optimal flows between the storage basins by a dynamic description based on grey‑box models is currently
using (i) the NWP forecast processed by a runoff model in the testing phase (see for example [Vezzaro et al., 2013]).
Figure 1: Schematic of dynamic control process with long forecast horizon.
102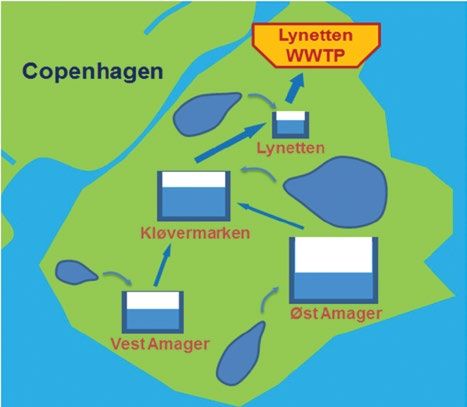
La Houille Blanche, n° 2, 2015, p. 101-107                                                                  DOI 10.1051/lhb/20150025

• The sensitivity of the receiving water body is expressed            For simulation purpose the first 6 hours are used as input to
for each basin by the cost in [€/m3], which is linearly pro‑          the MIKE URBAN model, while the 48 hours forecasts are
portional to the overflow volume. Higher prices are assigned          used as input to the Model Predictive Control (MPC).
to sensitive points (such as bathing areas in summertime),
while lower prices are used at less sensitive points, such as
                                                                      II.3.  New control strategy
bypass of Wastewater Treatment Plant (WWTP).
  The optimization routine is run every 2 minutes, i.e. every            The proposed approach (DORA Long Forecast –
time new measurements from the drainage network are avail‑            DORA‑LF) extends the optimization horizon of DORA
able. The algorithm thus estimates the optimal average flows          by using the 25 scenarios ensemble from the NWP model.
for next 2 hours between the retention basins that ensure the         DORA‑LF schematized the controlled system into a simple
minimum overflow risk across the entire catchment.                    model which only includes the available storage units. As
                                                                      mention in section II.1, a sensitivity cost, (linearly dependant
                                                                      to the CSO volume), is associated to each basin to reflect
II.2.  Numerical Weather Prediction model
                                                                      the vulnerability of the receiving water. In the current ver‑
   The main input of the proposed new control strategy con‑           sion, transport time between basins is neglected. The runoff
sists of 25 scenarios generated by the HIRLAM model, devel‑           generated in each sub‑catchment during each time step is
oped by the Danish Meteorological Institute (for more details         directly connected to the basin and a water balance in done
see [Du, 2007]). Model results are generated on a 5 km2 grid,         between each time step, as schematised in Figure 3.
with a forecast horizon up to 55 hours. New forecasts are                It has been found necessary to differentiate between three
generated every 6 hours, as shown in Figure 2 (where the              different modes of operation that each has a different objec‑
combination of the 25 ensembles is expressed as quantiles).           tive function: “dry”, “No CSO” or “CSO”.

Figure 2: Quantiles distribution of the 25 scenarios ensemble from the NWP forecast model renewed every 6 hours.

Figure 3: Schematic diagram of a detention basin and its evolution after one time step. The optimization variables for this first
time step are Qout,1 and Qin,1. Where Vw is the initial volume of water in the basin, VQ is the variation of volume from the sewage
inflow and outflow, VF is the volume of runoff from the reduced area Ar and Vav is the volume available for storage.

                                                                103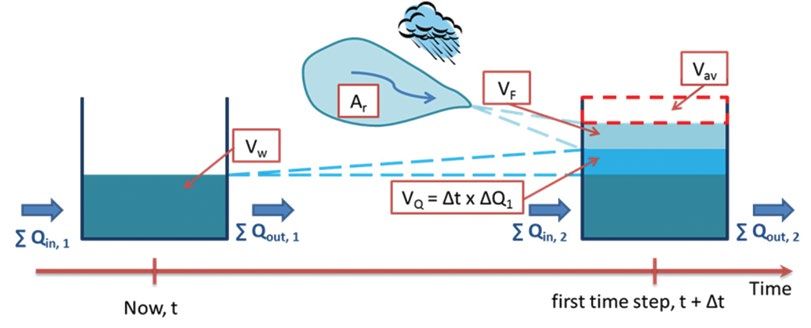
DOI 10.1051/lhb/20150025 La Houille Blanche, n° 2, 2015, p. 101-107
Based on the current status of the UDS and the fore‑ Nbre b
casted precipitation, the control algorithm chooses which Risk _ Cost1 = kempty * ∑ VW i
(2)
of the modes of operation, and thus objective function, is i =1
most appropriate for the current situation, as described in
Figure 4. The criteria to switch between the different opera‑
Nbre b
tional modes were adjusted to avoid instability.
Risk _ Cost2 = ∑ f ( Degree of fillingi )
i =1
II.3.1. Dry Mode
Average Relative Capacity
* (3)
The Dry Mode covers 2 situations: (i) When no risk of Relative Capacityi
overflows are forecasted (ii) When the possibility of CSO
Sensitivity Costi
events are forecasted, but there is no anticipation capacity at *
the present time (e.g. the forecast suggest an intense events, Average Sensitivy cost
basins are empty and there is no stored volume to optimize).
In both situations, there is either no need or no degrees of As displayed above, this mode has 2 cost functions to be
freedom for CSO mitigation; optimized. The emptying of the UDS towards the
WWTP should be prioritized over water distribution; this
II.3.2. No CSO Mode is done through the weighting factor Kempty.
The “No CSO Mode” is used when a basin reaches a cer‑
II.3.3. CSO Mode
tain degree of filling or when the number of scenario leading
to CSO events is too low to deem it to base the control strat‑ The DORA‑LF control scheme switches to the “CSO
egy on CSO volume. The purpose of this control strategy is mode” if at least 3 scenarios of the NWP ensemble (corre‑
to optimise the distribution of the relative storage capacity sponding to a probability higher than 12%) lead to forecasted
throughout the sewer system according to the vulnerability CSO events. Compared to the “No CSO” mode (optimizing
of the receiving water body (and thus prepare the system volumes), the optimization algorithm here aims at reducing
in an optimal way in case CSO events become likely). As the CSO risk. To do so, the “CSO mode” utilizes the fore‑
displayed in equation (1), the relative capacity of a basin casted CSO volume, along with the sensitivity of the receiv‑
is defined as the relationship between its current available ing water, as displayed in equation (4). The uncertainty of
capacity (Vav) in relation to the size of the reduced area con‑ the forecast is calculated over the full range of the ensemble;
nected (Ar) to it. the water balance for each basin is calculated for each time
step (ts) and for all the 25 NWP scenarios. The risk‑cost is
Vav subsequently calculated by multiplying the estimated CSO
RelativeCapacity
� �= (1) volumes (Vcsoi,j,k) by the cost of the individual overflow
Ar
locations (Costk). The algorithm optimises the flows rate
between the basins in order to minimize this risk‑cost.
This optimization strategy is mainly based on the current
status of the UDS and hence does not require long forecast
Scenarios Nbre ts Nbre b
data input. Furthermore in order to minimise the computa‑
tion time the algorithm is based on one time step horizon of
Risk _ Cost = ∑ ∑ ∑ Vcsoi, j,k (4)
i =1 j =1 k =1
2 hours.
Two cost functions are minimized: the first one (equa‑ j −1
*Costk * 1 − khorizon *
tion (2)) aims at emptying the UDS towards the WWTP Nbre ts
as fast as possible, while the second (equation (3)), aims
at reducing the risk of CSO due to coupled rain events by If the cost of an overflow is considered constant over the
optimizing the distribution of the available storage capacity. predicted horizon, a possible solution to the optimisation
The degree of filling is used to represent the potential for could be to allow excessive CSO volume in a low sensitive
optimising a basin. Indeed the relative capacity of an empty basin in order to protect a sensitive basin from an uncertain
basin cannot be improved. CSO event. In order to avoid this and balance CSO events
Figure 4: Decisions tree for switches between control strategies modes.
104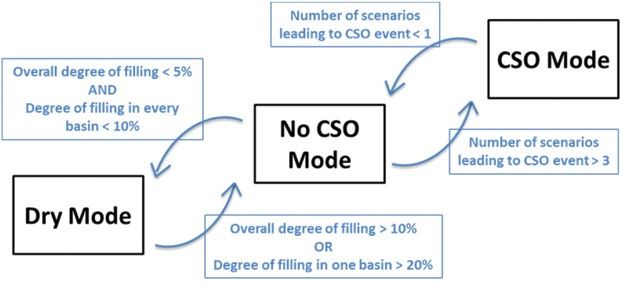
La Houille Blanche, n° 2, 2015, p. 101-107                                                                       DOI 10.1051/lhb/20150025

taking place in the near, more certain future (1‑2 hours) with            Amager Strandpark (Amager Beach Park), a bathing area,
CSO events forecasted in the distant, less certain, future (up            is located at the east coast of Amager and Kalvebod Fælled,
to 48 hours) a horizon discount function, khorizon, is applied            a park under the Natura 2000‑scheme as an EU‑recognized
to the equation. khorizon can then be adjusted according to the           bird protection area, is located in the western part of
balance one wishes to obtain.                                             Amager. Thus the two Amager basins are characterized by
  Both the relative cost between basins and the horizon                   a high CSO cost, while bypass of the biological treatment at
discount can impact significantly the optimization and they               the Lynetten WWTP has a low CSO cost.
must be assessed carefully according to the objectives of the
control strategy.                                                         III.2.  Results

                                                                             The performance of DORA‑LF was assessed based on two
III.  STUDY CASE ‑ EVALUATION                                            setups: (i) a short horizon of 2 hours divided in 2 time steps
       OF THE PERFORMANCE                                                 of 1 hour each; and (ii) a long horizon of 13 hours divided
                                                                          on 7 time steps of 1, 1, 1, 2, 2, 3 and 3 hours, respec‑
III.1.  Simplified Kløvermarken catchment                                tively. These two set up were tested on long and coupled
                                                                          rain events. The CSO discharges resulting from an 11 hours
   The performance of DORA‑LF control strategy is                         coupled event are displayed in Figure 6.
evaluated on a semi‑hypothetical model inspired by the                       Figure 6 shows that in the early stage of the rain event
Kløvermarken catchment (Figure 5), located in Southern                    both setups lead to the same CSO. Indeed, the control could
Copenhagen. The total reduced area is estimated to                        not operate because the UDS was in dry conditions. After
be 16.6 km2, which is subdivided into 4 sub‑catchments                    this first pick of rain intensity, the short forecast manage‑
(Table 1). There are 4 detention basins with a total storage              ment operate the UDS in order to minimize the short term
capacity of about 86,150 m3. The catchment discharge to                   CSO in Lynette (red circle) while the long forecast manage‑
Lynetten WWTP, which has a maximum biological treatment                   ment maintain a high CSO discharge in order to protect
capacity of 6.4 m3/s.                                                     more sensitive basin and decrease the CSO risk in those
   The CSO structures discharge to water bodies with different            points (green circle). As displayed in Table 2, the long fore‑
vulnerability. Thus, different costs are assigned to each over‑           cast strategy increase the total CSO volume by 1.4%, while
flow structure according to the sensitivity of the recipient.             reducing the risk‑cost, which represents the impact to the
                                                                          environment, by 11%. This shows that the long forecast
                                                                          considerably improved the protection of sensitive waters, as
                                                                          overflows are avoided in Øst Amager and mitigated by 87%
                                                                          in Vest Amager.

                                                                          IV.  DISCUSSION
                                                                             The implementation of long forecast in DORA‑LF
                                                                          enhances the UDS management by improving the protec‑
                                                                          tion of sensitive areas in relation to long and/or coupled rain
                                                                          events. Nevertheless, the information provided by the long
                                                                          forecast does not improve significantly the CSO mitigation
                                                                          of short and intense events as cloudburst in comparison to
                                                                          short forecast. Indeed if the UDS is already empty there is
                                                                          not early preventive action available to reduce the future
                                                                          CSO volume.

                                                                          IV.1.  Limitations

                                                                             The potential benefit of using a long forecast horizon in
                                                                          addition to radar‑based nowcast with respect to CSO reduc‑
                                                                          tion, is depending on the UDS characteristics and the type of
Figure 5: Scheme of the simplified Kløvermarken catchment.                rain event. The larger the UDS is, the higher the potential.

                                  Table 1: Key data of Kløvermarken catchment used in the study.

                   CSO          Volume       Reduce area          Relative capacity             Maximal pumping              Minimal
                Sensitivity       [m ]
                                     3
                                                [ha]         [m /ha]
                                                                   3
                                                                               [mm/m ]   2
                                                                                                 capacity [m /s]
                                                                                                             3
                                                                                                                       emptying time
 Vest A.           High         13 490           97           139.07             13.91                 1.0             3.7       hours
 Øst A.            High         44 400          228           194.85             19.48                 0.7            17.6       hours
 Kløver.         Medium         27 500          777               35.39           3.54                 7.5             1.0       hours
 Lynetten          Low            760           564               1.35            0.13                 6.4              2       minutes

                                                                   105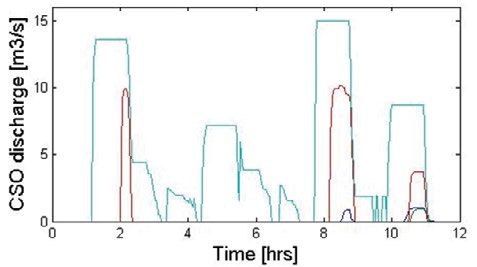
DOI 10.1051/lhb/20150025                                                                     La Houille Blanche, n° 2, 2015, p. 101-107

                               (a)                                                               (b)

Figure 6: CSO discharge in the different basin with short horizon forecast management (a) and with long horizon forecast (b).

                                Table 2: Results of the short and long forecast horizon strategies.

                                            CSO Volume [m3]                                               Mitigation
                         Short horizon simulation         Long horizon simulation                   [%]              Sensitivity
 VA                               2 930                                 380                        ‑87%                 High
 OA                               1 500                          0 ‑ 97 % filling                 ‑100%                 High
 Kløver                          37 680                                23 870                      ‑37%                Medium
 Lyn                             209 360                               230 860                    +10%                   Low
 TOTAL CSO                       251 470                               254 920                    +1.4%
 Risk‑Cost                       340 190                               303 030                     ‑11%

Nevertheless the transportation time between the basins                V.  CONCLUSION
increases with the UDS scale, therefore neglecting it can be
an issue for large systems.                                               A centralised model predictive control application
   The worse scenarios from the NWP ensemble lead to a                 (DORA‑LF), using long ensemble forecast data from NWP
high risk‑cost and thus have a higher impact on the control            model in order to improve the performance of urban drain‑
strategy, which results to an overprotection of the sensitive          age system, was presented in this study. Based on long fore‑
areas. According to the UDS management objective, this                 casts (up to 48 hours) DORA‑LF choose an appropriate
tendency can be balance by weighting the scenarios.                    control scheme (“Dry”, “No CSO” or “CSO”) according
                                                                       to the current status of the UDS and the forecasted runoff.
                                                                       Then optimal flows between the basins are calculated in
IV.2.  Future outlook
                                                                       order to minimize the associated cost function.
   This study focuses on CSO mitigation, but long a forecast              Apart for in the decision of switching between the differ‑
can also improve the UDS management during dry weather                 ent operational modes, the entire forecast horizon is used in
periods. Indeed by knowing when no overflows are expected              the CSO mode. In the CSO mode the optimisation considers
across the UDS, the control strategy can be used to optimise           multiple and variable time steps. A water balance is done for
the inflow to the WWTP or to reduce power cost by using                each basin for each of those time step and for the 25 sce‑
the pumps during periods with low electricity costs.                   narios of the ensemble; thereby the CSO is estimated at all
   Furthermore, knowing in advance if there is a risk of               localization over the entire horizon and full ensemble. The
overflow can allow a better management of the WWTP, if                 different sensitivities of the receiving water bodies are taken
the WWTP has a possibility for adjusting the operation to              into account as a cost per volume of CSO.
allow a larger flow of water through the plant during wet                 The rain events tested with DORA‑LF suggest that the
weather. In that case the forecast can also be used at the             implementation of a long forecast improves the protection
WWTP to switch between wet and dry mode according to                   of sensitive areas by allowing preventive CSO events in low
the forecasted inflow (as illustrated with radar‑based predic‑         sensitive areas and thus mitigate the CSO threat in vulner‑
tion in [Heinonen et al., 2013]).                                      able areas.
   A long forecast horizon has also potential for flooding                The implementation of an ensemble forecast from a
mitigation, as the forecasted CSO volume can be used for               NWP model opens many other possibilities for the UDS
issuing warnings to the authorities. Furthermore, a control            management from flood events mitigation to dry weather
strategy can be implemented in regards to flood event. For             period management. Furthermore, using an ensemble of
example by using a different set of overflow costs in order            scenarios allows to quantified and handle the uncertainty
to protect human properties instead of bathing areas.                  of the forecast.

                                                                 106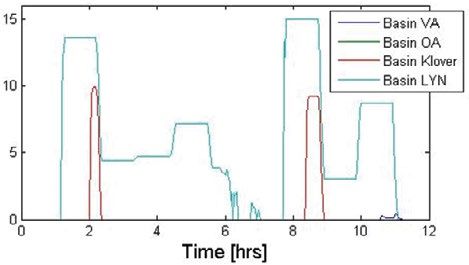
La Houille Blanche, n° 2, 2015, p. 101-107                                                                  DOI 10.1051/lhb/20150025

VI.  AKNOWLEGMENT                                                        Drainage Catchments. Proceedings of the 12th International
                                                                          Conference on Urban Drainage (12 ICUD), Porto Alegre, RS.
  The results presented in this study are obtained under                  Brazil, 11th ‑16th September 2011
the framework of Luca Vezzaro’s Industrial Postdoc pro‑               Heinonen M., Jokelainen M., Fred T., Koistinen J., Hohti H.
ject “MOPSUS ‑ Model predictive control of urban drain‑                   (2013) — Improved wet weather wastewater influent model‑
age systems under uncertainty”, which is financed by the                  ling at Viikinmaki WWTP by on‑line weather radar informa‑
Danish National Advanced Technology Foundation. The                       tion. Water Science and Technology. 68 : 499‑505
DORA control strategy was developed within the SWI                    T horndahl S., P oulsen T. S., B øvith T., B orup M., A hm
project (Storm‑ and Wastewater Informatics), a strategic                   M., Nielsen J. E., Grum M., Rasmussen M. R., Gill R.,
Danish Research Project financed by the Danish Agency for                  Mikkelsen P. S. (2012) — Comparison of short term rainfall
Science Technology and Innovation under the Programme                      forecasts for model based flow prediction in urban drainage
Commission on Sustainable Energy and Environment.                          systems. 9th International Conference on Urban Drainage
                                                                           Modelling, Belgrade, Serbia, 4‑6 September 2012
                                                                      V ezzaro L. A nd G rum M. (2012) — A generalized Dynamic
                                                                           Overflow Risk Assessment (DORA) for urban drainage RTC.
VII.  REFERENCES                                                          Proceedings of the 9th International Conference on Urban
                                                                           Drainage Modelling, Belgrade, Serbia, 4th‑6th September 2012
Du J. (2007) — Uncertainty and Ensemble Forecast. Science and
                                                                      Vezzaro L., Löwe R., Madsen H., Grum M., Mikkelsen P.S.
    Technology Infusion Lecture Series. december
                                                                          (2013) — Investigating the use of stochastic forecast for RTC
G rum M., T hornberg D., C hristensen M. L., S hididi S. A.,              of urban drainage systems. 8th Novatech 2013 ‑ Sustainable
    And Thirsing C. (2011) — Full‑Scale Real Time Control                 techniques and strategies in urban water management, Lyon,
    Demonstration Project in Copenhagen’s Largest Urban                   France, 23‑27 June 2013

                                                                107
Vous pouvez aussi lire