Histoire - Leefmilieu Brussel
←
→
Transcription du contenu de la page
Si votre navigateur ne rend pas la page correctement, lisez s'il vous plaît le contenu de la page ci-dessous
Véhicules électriques départ immédiat :
                      Présentation de modèles de voitures, d’aspects
                      environnementaux et financiers

                       Prof. Joeri Van Mierlo,
                       Quentin De Clerck &
                       Philippe Lebeau

                                                             Histoire

                                              1899                      70ties

                                                                        Today
                                                90ties

Prof. Joeri Van Mierlo - Vrije Universiteit Brussel - MOBI
9/06/2015     Pag.2

                                                                                 1
3
Today Tesla Model S

                                          0 – 96 km/h en 4.4s
                                          209 km/h
                                          260-370-480 km
                                          autonomie
                                          A partir de €43.000

9-6-2015

                                                           J. Van Mierlo - VUB

                                                                             4

Battery electric vehicles

                                          Nissan Leaf
           Tesla Roadster

     Citroën C-Zero    Mitsubishi iMiev Peugeot iOn

9-6-2015

                       Status February 2012                J. Van Mierlo - VUB

                                                                                 2
5
     Battery electric vehicles

Renault Fluence Renault Twizy       Smart ED   Mia Electric

Ford Focus BEV   VW e-Golf      Renault Zoe Tesla Model S

     9-6-2015

                       Status February 2012          J. Van Mierlo - VUB

                                                                       6

     Battery electric vehicles
     (transport de marchandises)
    Buddy         Philco     Peugeot Partner   Newteon

  Green Wako      Goupil         Spijkstaal      Smile

     9-6-2015

                       Status February 2012          J. Van Mierlo - VUB

                                                                           3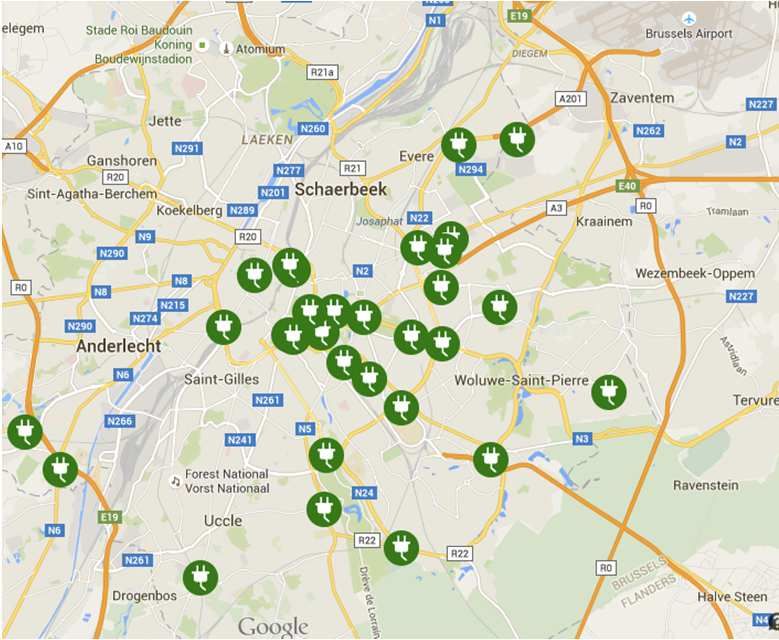
7
Battery electric vehicles
(transport de marchandises)

9-6-2015

                            Status February 2012            J. Van Mierlo - VUB

                                                                              8

Battery electric vehicles
(transport de marchandises)
                    Smith electric vehicles
           Newton                                  Edison
                            Specifications

                      Masse Maximale Autorisée
                    7.5 – 12 ton    3.5 – 4.6 ton

                               Charge utile
                    2.8 – 7.4 ton      0.7 – 2.3 ton

                              Autonomie
                    65 – 190 km      64 – 160 km

9-6-2015

                            Status February 2012            J. Van Mierlo - VUB

                                                                                  4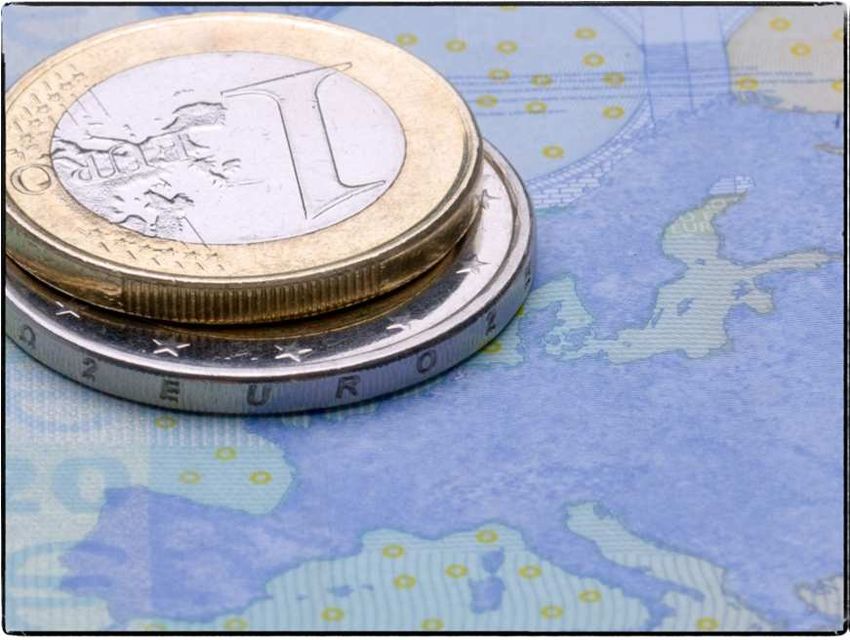
9
    Electric 2-wheelers

    9-6-2015

                                     Status February 2012            J. Van Mierlo - VUB

                                                                                       10

    Hybrid electric vehicles
Toyota Prius              Lexus RX 450h Honda Insight             Audi Q5h

 Toyota Auris Peugeot 3008 Mercedes S-Class BMW X6h
    hybrid      Hybrid4         Hybrid

    9-6-2015   J. Van Mierlo - VUB

                                                            Status November 2012

                                                                                            5
11
     Hybrid electric vehicles
Honda Jazz                 Lexus GS450h         Honda CR-Z        Lexus
  Hybrid                                          Hybrid         CT200h

 Volkswagen                     Lexus LS600h BMW 7 Hybrid       Porsche
Touareg Hybrid                                               Cayenne Hybrid

     9-6-2015   J. Van Mierlo - VUB

                                                             Status November 2012

                                                                               12

     Plug-in hybrid electric vehicles

   Opel Ampera                         Chevrolet Volt

 Toyota Prius PHEV                    Volvo V60 Plug-in Mitsubishi Outlander

     9-6-2015

                                                             Status November 2012

                                                                                    6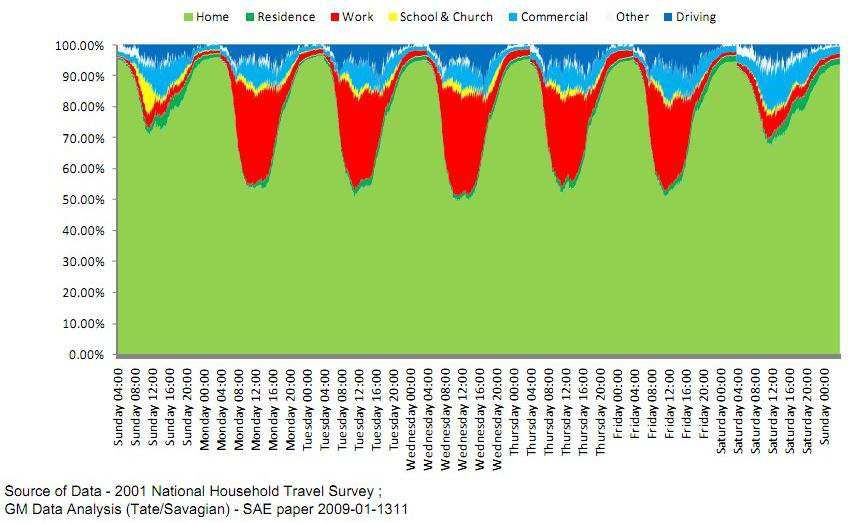
J. Van Mierlo - VUB
             Electric Vehicles
             with Range extender

               Fisker Karma                     BMW i3

                                                                     13

                   BEV and PHEV registrations
                              (Europe, status Q2 2014)

Prof. Joeri Van Mierlo                   14              9/06/2015

                                                                                            7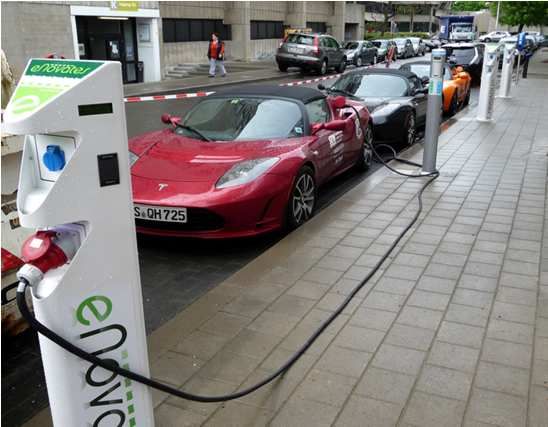
Charging infrastructure
                                                           (Europe)

             10000
                                     Fast charging posts           Normal & semi-fast charging posts
              9000
              8000
              7000
              6000
              5000
              4000
              3000
              2000
              1000
                  0
                         AT     BE                CZ          ES           NL              NO          SE

Prof. Joeri Van Mierlo                                        15                                            9/06/2015

                              BEV sales per model
                                      (Europe, 2009 – 2014 H1)

Prof. Joeri Van Mierlo                                        16                                            9/06/2015

                                                                                                                        8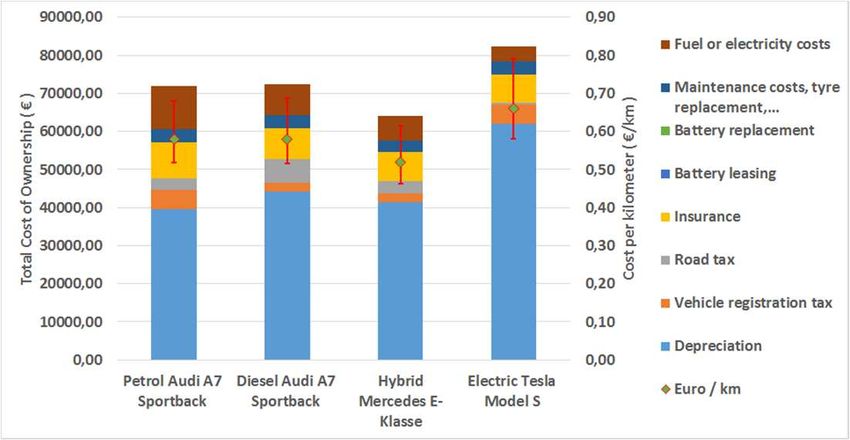
PHEV sales per model
                              (Europe, 2009-2014 H1)

Prof. Joeri Van Mierlo                  17                            9/06/2015

                         Quel marché voulons
                               nous?

   9/06/2015                                 Prof. Joeri Van Mierlo

                                                                                  9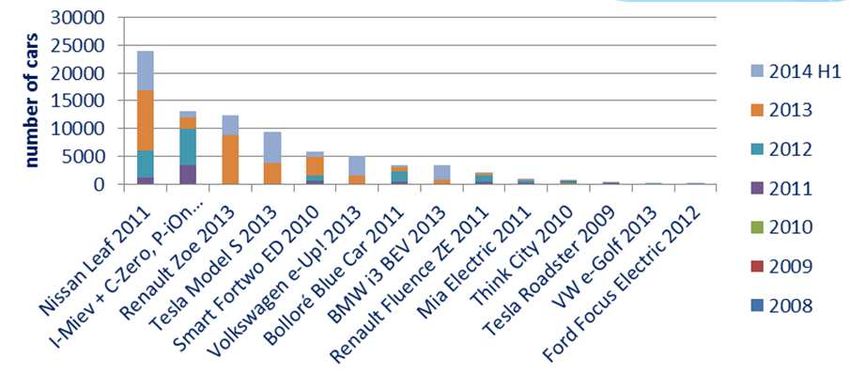
Evolution des émissions à effets de serre du secteur
                des transports en EU27 et objectifs à 2050

                                  1,200
CO2 emissions from transport in

                                  1,000
                                                                          -20%
     the EU27 (Mtonnes)

                                   800

                                                                                                          -60%                       -95%
                                   600

                                   400
                                              emissions 1990-2009
                                   200
                                              White Paper objectives
                                      0
                                       1990    2000    2010    2020        2030      2040              2050
                                                                Vehicle Life

Prof. Joeri Van Mierlo - Vrije Universiteit Brussel - MOBI
9/06/2015                           Pag.19                                        Based on White Paper – Roadmap to a Single European Transport
                                                                                  Area Towards a competitive and resource efficient transport system

                                    Pag.

                                                                                                                                                       10
Life Cycle Assessment
Matières Raffinage et Distribution
premières transport
Utilisation Déchets
Matières Production des Assemblage et
premières composants distribution
Prof. Joeri Van Mierlo - Vrije Universiteit Brussel - MOBI
See CLEVER project
9/06/2015 Pag.21 @ http://www.belspo.be/belspo/SSD/science/pr_transport_nl.stm
Réchauffement climatique
(Life Cycle Assessment en g CO2 eq)
See CLEVER project
@ http://www.belspo.be/belspo/SSD/science/pr_transport_nl.stm
Prof. Joeri Van Mierlo - Vrije Universiteit Brussel - MOBI
Ref: Van Mierlo J., Macharis C., Boureima F., Messagie M., Turcksin L.
9/06/2015 Pag.22 Vrije Universiteit Brussel
11Le rôle de la production d’électricité
Prof. Joeri Van Mierlo - Vrije Universiteit Brussel - MOBI
9/06/2015 Pag.23
Au delà du réchauffement
climatique, il y a d’autres
impacts environnementaux
sur la santé publique par
exemple.
Prof. Joeri Van Mierlo - Vrije Universiteit Brussel - MOBI
9/06/2015 Pag.24
12Il n’y a pas que le réchauffement climatique
Particules fines: NOx:
Moyenne belge:12 µg/m³ Moyenne belge:23 µg/m³
RBC, Anvers, Gent: RBC, Anvers:
Plus élevé que 20 µg/m³ Plus élevé que 40 µg/m³
Bron: (VMM 2012), (EEA, 2014)
MOBI - Mobility, Logistics and Automotive Technology
Pag.25
Le score environnemental global
Prof. Joeri Van Mierlo - Vrije Universiteit Brussel - MOBI
9/06/2015 Pag.26
13Plus de raisons encore
pour changer le futur?
9/06/2015 Prof. Joeri Van Mierlo
Plus de raisons encore pour changer le futur?
1 milliard d’euros par jour pour l’importation du
pétrole
Le cout de la faible qualité de l’air
Europe: 1,2 billion d’euros (10% du PIB)
Belgique: 15 milliard d’euros (4,6% du PIB)
48% du soutien public va à des exonérations
fiscales sur les produits pétroliers (seulement 6%
d'économies d'énergie)
1 million de jobs supplémentaires en 2030
si le véhicule électrique se développe
Prof. Joeri Van Mierlo - Vrije Universiteit Brussel - MOBI
9/06/2015 Pag.28
14Les 3 freins les plus
importants pour les EVs
9/06/2015 Prof. Joeri Van Mierlo
Les 3 freins les plus importants
pour les EVs
Cout à l’achat élevé
Autonomie limitée
Infrastructure de
recharge limitée
Prof. Joeri Van Mierlo - Vrije Universiteit Brussel - MOBI
9/06/2015 Pag.30 Source: MOBI – VUB – 2012
15Distance moyenne parcourue par jour
7%
Less than
40km
More than
93% 40km
Belgium context
Ref: BELDAM, 2012 - Cornelis, E., Hubert, M., Huynen, P., Lebrun, K.,
Prof. Joeri Van Mierlo - Vrije Universiteit Brussel - MOBI Patriarche, G., De Witte, A., Creemers, L., Declercq, K., janssens, D.,
Pag.31 Castaigne, M., Hollaert, L. & F. Walle (2012) “La mobilité en Belgique en
9/06/2015 2010: résultats de l’enquête BELDAM » Rapport final, Septembre 2012.
L’infrastructure de recharge
Recharge normale (95%) Recharge Wireless par induction
(la nuit, bon marché, disponible, efficace)
Recharge rapide (5%)
Prof. Joeri Van Mierlo - Vrije Universiteit Brussel - MOBI
9/06/2015 Pag.32 Source: MOBI – VUB – 2012
16Les besoins en infrastructure
Où se trouve votre voiture pendant une semaine?
Work Home
Prof. Joeri Van Mierlo - Vrije Universiteit Brussel - MOBI
9/06/2015 Pag.33
L’infrastructure de recharge
3.4 millions de garages, de parkings ou d’emplacement privés
5.2 millions de voitures et de camionnettes
Bron: Joeri Van Mierlo – VUB op basis van FOD Economie
17L’infrastructure de recharge
Domestics IEC 62196-2 type 1
SAE J1772 Yazaki
VUB-MOBI actif dans:
- IEC TC69
IEC 62196-2 type 2 - ISO TC22 SC21
Mennekes 16A/63A 3f - CEN TC301
IEC 62196-2 type 3 - French/Italian - CENELEC TC69X
Ref: Peter Van den Bossche: IEC TC69, ISO TC22 SC21, CEN TC301,
CENELEC TC69X
EV Roadshow
Deel II
drs. Quentin De Clerck & drs. Philippe Lebeau
8 juni 2015
18Een elektrisch voertuig opladen
• Gratis
• Cash
• SMS
• PingPing
• RFID-kaarten
• Invoicing
• Abonnementskaart
Online data infrastructuur Brussel
• 102 verschillende laadstations gevonden
• 70 via de databanken
• 32 via de providers
19Resultaat veldonderzoek
Betrouwbaarheid databanken
60
49 46
50
Amount of charging stations
40 36
31
30 24 21 27
22 22 22
20 17 16 16
11 10
10
0
# charging stations # visited # found
20En het financiële plaatje?
Total cost of
ownership (TCO) Acquisition cost
Road tax
(Iceberg effect) Registration tax
Insurance
Maintenance Tires
Fuel of Technical
electricity control
cost
Battery
leasing
Battery
replacement
21Total Cost of Ownership (TCO)
TCO methode
Total Cost of Ownership
• Ownership: 8 jaar en 45 dagen
• Afgelegde afstand per jaar: 15.284km
• Depreciatie
• Brandstof- en elektriciteitskosten: €1.5959/l voor benzine, €1.4158/l
voor diesel, €0,1809/kWh voor elektriciteit en €0.87/kg voor CNG
• Belastingen
– Jaarlijkse verkeersbelasting
– Eenmalige belasting op inverkeerstelling
• Verzekeringen
– Eerste 3 jaar omnium dan burgelijkaansprakelijkheid
• Batterijkosten (batterij om de 6 jaar vervangen)
– Prijs vervanging hangt af van de garantie
– Leasing
• Onderhoudskosten
22Total Cost of Ownership
Electric Nissan Leaf
€ 3.704
Depreciation
€ 1.911
Vehicle registration tax
Road tax
€ 7.057
Insurance
Battery replacement
€ 5.537 € 20.976 Maintenance costs, tyre
replacement,…
€ 616 Fuel or electricity costs
€ 123
TCO City cars
23TCO City Cars: concreet voorbeeld
TCO Medium cars
24TCO Medium Cars: concreet voorbeeld
TCO Premium Cars
25TCO Premium Cars: concreet
voorbeeld
En logistiek?
26De rol van EV’s in stadsdistributie
Impact op luchtkwaliteit Impact op Impact op opwarming
geluid van de aarde
33% van PM2.5 emissies Meer geluid dan 25% van CO2
32% van PM10 emissies gewoon verkeer emissies
31% van NOx emissies
5 Source: Bruxelles Environnement (2014)
3
De rol van EV’s in stadsdistributie
Impact op luchtkwaliteit Impact op Impact op opwarming
geluid van de aarde
Nul emissies in de stad Stille motor Afhankelijk van de
energiemix
5 Source: Bruxelles Environnement (2014)
4
27De rol van EV’s in stadsdistributie
• Beperkte autonomie is geen probleem voor de last
mile
• Energieverbruik is meer efficiënt in de stedelijke
context
• Kosten van EV’s kan gecompenseerd worden door
lager operationele kosten
Vierwielers
28Bestelwagen (MTM van meer dan 2,3t)
Bestelwagen (MTM van meer dan 2,3t)
29Total Cost of Ownership voor
bestelwagen
• Ownership periode: 12 jaar
• Afgelegde afstand per jaar : 15.429km
• Afschrijvingspercentage : 24,43% voor BEVs, 18,57% voor conventionele wagens
• Energieprijzen : €1.59/l voor benzine, €1.47/l voor diesel en €0,0653/kWh voor elektriciteit
• Vervanging van de batterij : hangt af van de type batterij en van de garantie
• Residuële waarde op de batterij : None
• Reële disconteringsvoet : 2,43% (lange termijn interestvoet van de Belgische staatsobligaties)
– 1,5% (verwachte inflatie)
• Reparatie, onderhoud en banden kosten : helft van de diesel kosten
Sensitiviteit van kleine bestelwagen
op de afgelegde afstand per jaar
100
90
80
TCO (€urocents per km)
70
60
50
40
30
20
10
0
5000 6000 7000 8000 9000 10000 11000 12000 13000 14000 15000 16000 17000 18000 19000 20000
Number of kilometers per year per vehicle (km)
30Sensitiviteit van kleine bestelwagen
op de ownership periode
50
45
40
TCO (€urocents per km)
35
30
25
20
15
10
5
0
5 6 7 8 9 10 11 12 13 14 15
Number of years of ownership per vehicle (years)
Sensitiviteit van kleine bestelwagen
op afschrijvingspercentage van BEV
35
30
TCO (€urocents per km)
25
20
15
10
5
0
0% 5% 10% 15% 20% 25%
Annual depreciation rate of BEVs (%)
31Merci!
Prof. Joeri Van Mierlo 63 9/06/2015
Prof. Cathy Macharis Naam Quentin De Clerck
Phone +32 2 629 22 86 Phone +32 629 20 52
Email cathy.macharis@vub.ac.be Email quentin.de.clerck@vub.ac.be
Office Building B (B2.20) Office Building B (B2.06)
Prof. Joeri Van Mierlo Naam Philippe Lebeau
Phone +32 2 629 28 03 Phone +
Email joeri.van.mierlo@vub.ac.be Email @
Office Building Z (ZE109) Office Building ()
Naam Prof. Lieselot Vanhaverbeke
Phone +32 2 629 21 15
Email lieselot.vanhaverbeke@vub.ac.be
Office Building B (B2.12a)
Pleinlaan 2, 1050 Brussels
mobi.vub.ac.be
twitter.com/MOBI_VUB
32Vous pouvez aussi lire