Le Pétrole et son avenir ? Une approche pragmatique - Charles Thiemele - 3 Juin 2021 - Ampersand World

La page est créée Nicolas Barbier
 
CONTINUER À LIRE
Le Pétrole et son avenir ? Une approche pragmatique - Charles Thiemele - 3 Juin 2021 - Ampersand World
Le Pétrole et son
avenir ?
Une approche
pragmatique….

                          Charles Thiemele – 3 Juin 2021

      To : Aurelien SIX
Le Pétrole et son avenir ? Une approche pragmatique - Charles Thiemele - 3 Juin 2021 - Ampersand World
CO2 taxes to reduce greenhouse gas (GHG) emissions.

                                            Embryonic                 Growth               Mature                     Aging
                                              pre -1900s              1900 - 2000        2000 - 2050?               Post 2050?

  Où en-est–                               Discovery of            International       End-user switch to       Low wind & PV LCOE

  on                                       petroleum
                                           First steps in E&P
                                           activities
                                                                   combustion market
                                                                   growth
                                                                   Periods of cheap
                                                                   oil promoted
                                                                                       electricty
                                                                                       Natural gas displacing
                                                                                       oil for generation
                                                                                                                Storage-cost reductions
                                                                                                                Electric vehicles
                                                                                                                mandatory in large cities

  aujourdhui ?
                                           Beginnings of the                           Renewables sources
                                                                   displacement of                              Aggressive CO2
                                           refining industry                           penetration
                                                                   wood and coal                                taxation

                                        Figure 1: Oil industry maturity curve

• Les prédictions annoncent : la fin du pétrole et un • L’actualité :
  nouveau monde sans pollution à l’horizon 20X0 ?             • Annonce de la taxation du CO2
  Quid du X0 ?                                                • Votation en Suisse du 13 Juin ( loi sur le CO2)
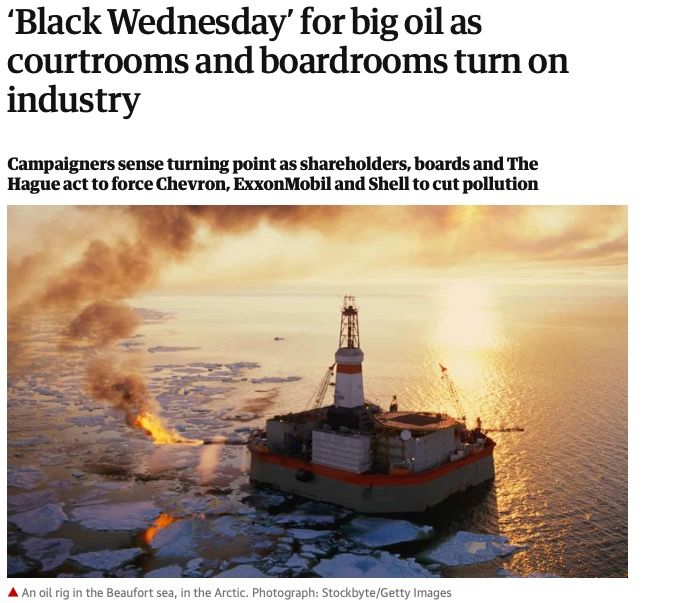
                                                              • Les décisions du Mercredi 26 Mai – Black Wednesday
20 : Presque Business As Usual                                • Décision de la Cour Suprême Allemande pour 2050
30 : Peak Oil annoncé pour 2035 par certains experts          • Prédictions post COVID
40/50 : Plus réaliste et en ligne avec les différents targets
!
Le Pétrole et son avenir ? Une approche pragmatique - Charles Thiemele - 3 Juin 2021 - Ampersand World
Où en-est–
  on
  aujourdhui ?
• Le Syndrome du Black Wednesday….plus rien ne
  sera plus jamais comme avant :
    • La responsabilité des Boards
    • Le concept du pollueur-payeur
    • Les activistes sont écoutés et gagnent des
      batailles
    • La fin de la toute puissance du Big Oil ?
Le Pétrole et son avenir ? Une approche pragmatique - Charles Thiemele - 3 Juin 2021 - Ampersand World
Quelles
influences ?
                                                                Renewable / Clean
  Fossil Fuel based World               2035….2050
                                                               Energy based World

                            1/ Les lobbys ‘ verts’ :
                                     Greenpeace
                                     Greta Thunberg etc.
                                     Accord de Paris ( COP…)

                            2/ Les anti-pétroles

                            3/ Les facteurs influenceurs
Embryonic                 Growth               Mature                     Aging
                                                         pre -1900s              1900 - 2000        2000 - 2050?               Post 2050?

Quelles
influences ?                                          Discovery of
                                                      petroleum
                                                                              International
                                                                              combustion market
                                                                                                  End-user switch to
                                                                                                  electricty
                                                                                                                           Low wind & PV LCOE
                                                                                                                           Storage-cost reductions
                                                                              growth
                                                      First steps in E&P                          Natural gas displacing
                                                                                                                           Electric vehicles
                                                      activities              Periods of cheap    oil for generation
                                                                                                                           mandatory in large cities
                                                                              oil promoted
                                                      Beginnings of the                           Renewables sources
                                                                              displacement of                              Aggressive CO2
                                                      refining industry                           penetration
                                                                              wood and coal                                taxation

1/ La demande                                      Figure 1: Oil industry maturity curve
2/ La production
3/ Les facteurs internes :

        * La reprise post-COVID
        * La reduction des stocks
        * La lenteur des investissements de conversion

3/ Les facteurs externes :

        * Accords Opec / Opec +
        * Les électrons libres : Iran / Lybie / Iraq / Nigéria etc. ( Géopolitique / Résolution des conflits)
        * Les nouvelles productions : découvertes et investissements Greenfield
La
demande?
1/ LA CONSOMMATION MONDIALE

LE FACTEUR LE PLUS IMPORTANT ET LE PLUS INFLUENT SUR LE MONDE DU PETROLE
       * IL IMPACTE LE PRIX PLUS QUE TOUT AUTRE FACTEUR - EX. MARS 2020
       * C’EST LE DRIVER PRINCIPAL DE L’ACTIVITÉ ET CELUI VERS LEQUEL SE TOURNENT LES
       GROS PRODUCTEURS ( PRIX, PART DE MARCHE ETC.)

SON EVOLUTION SUR LES PROCHAINES PÉRIODES DÉTERMINERA :

       * LE PRIX DU PÉTROLE A MOYEN/LONG TERME
       * LE COMPORTEMENT DE L’OPEC/OPEC+ ET DES GROS PRODUCTEURS
       * LA DIMENSION DES INVESTISSEMENTS DANS L’UPSTREAM (-5% si 0 investissement )
               * Entre $3T et $20T pour compenser la demande actuelle sur 30 ans
       * L’IMPORTANCE RELATIVE DE CERTAINS PAYS ET CERTAINES ECONOMIES
               * EXEMPLE : INDE / CHINE / ARABIE SAOUDITE

AUJOURD’HUI, ON RESTE DANS UN MONDE A PLUS DE 80% DE CONSOMMATION ‘OIL&GAS’
The 10 largest oil1 producers and share of total world oil production2 in 20203

La
                                                                                  Country                        Million barrels per day      Share of world total
                                                                                  United States                           18.60                      20%
                                                                                  Saudi Arabia                            11.01                      12%
                                                                                  Russia                                  10.50                       11%

production?
                                                                                  Canada                                   5.29                        6%
                                                                                  China                                    4.93                        5%
                                                                                  Iraq                                     4.16                        4%
                                                                                  United Arab Emirates                     3.79                        4%
                                                                                  Brazil                                   3.78                        4%
2/ Quelques faits sur la production :                                             Iran
                                                                                  Kuwait
                                                                                                                           2.81
                                                                                                                           2.66
                                                                                                                                                       3%
                                                                                                                                                       3%
                                                                                  Total top 10                            67.52                       72%

• Des découvertes importantes continuent…..                                       World total                             94.24

alors que l’on annonce la fin du Pétrole : elles sont nécessaires12 Oil
                                                                    pour      soutenir
                                                                        includes crude oil, alllaother
                                                                                                   demande.
                                                                                                       petroleum liquids, and biofuels.
                                                                                   Production includes domestic production of crude oil, all other petroleum liquids, biof
                                                                                 processing gain.
     • Investissements de plusieurs centaines de Milliards                    par3 Source:
                                                                                   an ! International Energy Statistics, Total oil (petroleum and other liquids) produc
                                                                                  The 10 largest oil1 consumers and share of total world oil consumption in 20182
• Les USA sont le premier producteur de pétrole et ….le premier consommateur :
                                                                                  Country                  Million barrels per day          Share of world total
                                                                                  United States                     20.51                          20%
     • Le comportement futur du conducteur américain est un facteur clé           China
                                                                                  India
                                                                                                                    13.89
                                                                                                                     4.77
                                                                                                                                                   14%
                                                                                                                                                     5%
                                                                                  Russia                             3.88                            4%
                                                                                  Japan                              3.79                            4%
• Il reste encore beaucoup de barrils à sortir :                                  Saudi Arabia                       3.08                            3%
                                                                                  Brazil                             3.06                            3%
                                                                                  South Korea                        2.57                            3%
     •     Régions sous-exploitées ou mal-exploitées                              Canada                             2.53                            3%

     •     Ralentissement dues au conflit et aux conjonctures défavorables        Germany
                                                                                  Total top 10
                                                                                                                     2.33
                                                                                                                    60.40
                                                                                                                                                     2%
                                                                                                                                                   60%
                                                                                  World total                       100.37

• Le critère de part de marché reste encore important pour de
                                                            1 Oilgrands      producteurs,
                                                                  includes crude                     notamment
                                                                                 oil, all other petroleum liquids, and biofuels.
  les pays du Moyen Orient                                  2
                                                              Source: International Energy Statistics, Total oil (petroleum and other liquids) consum
Embryonic                 Growth               Mature                     Aging
                                          pre -1900s              1900 - 2000        2000 - 2050?               Post 2050?

Les
                                       Discovery of            International       End-user switch to       Low wind & PV LCOE
                                       petroleum               combustion market   electricty
                                                                                                            Storage-cost reductions
                                                               growth
                                       First steps in E&P                          Natural gas displacing
                                                                                                            Electric vehicles
                                       activities              Periods of cheap    oil for generation

fantasmes?
                                                                                                            mandatory in large cities
                                                               oil promoted
                                       Beginnings of the                           Renewables sources
                                                               displacement of                              Aggressive CO2
                                       refining industry                           penetration
                                                               wood and coal                                taxation

                                    Figure 1: Oil industry maturity curve
1/ Oil @ 200$

2/ Peak Oil – No more oil in 20X0

3/ No more cars

4/ Hydrogen Airplanes

5/ What else ?
Embryonic              Growth               Mature                     Aging
                                                        pre -1900s          1900 - 2000         2000 - 2050?               Post 2050?

Quelques
Indicateurs
                                                     Discovery of         International       End-user switch to       Low wind & PV LCOE
                                                     petroleum            combustion market   electricty
                                                                                                                       Storage-cost reductions
                                                                          growth
                                                     First steps in E&P                       Natural gas displacing
                                                                                                                       Electric vehicles
                                                     activities           Periods of cheap    oil for generation

Clés?
                                                                                                                       mandatory in large cities
                                                                          oil promoted
                                                     Beginnings of the                        Renewables sources
                                                                          displacement of                              Aggressive CO2
                                                     refining industry                        penetration
                                                                          wood and coal                                taxation

1/ % of Non-fossil Fuel-based Consumption - Quel est1:leOilbon
                                              Figure             taux
                                                           industry    ? curve
                                                                    maturity

         Chine – 15% en 2020 et 20% en 2030 – Plus grand producteur de EV au Monde ….mais aussi un
         très gros consommateur.

2/ Rate of Decarbonization or Carbon Neutral Target
         * Comment L’Atteindre et Quand ? 2030 ? 2050 ?

3/ Public Policy Enforcement
         * Seul moyen de changer les comportements - Shell doit baisser ses emissions de 45% sur 10 ans
          / Plus de voitures à combustion en 2030/2040 etc.

4/ LCoE : Levelized Cost of Energy (LCOE)
         * Avantage progressif à l’Hydrogène, au Solaire et à l’Éolien
& storage (CCS) and batteries.

                                           4 .3%
                                                                                                                         Wind
                                                                                                                         Solar
                                                                                                                         CCS

    Que fait le
                                                                                                                         Biofuels, biomass & waste
                                                                                                                         Energy smart technologies
                                                    2.3%
                                                           1.8%

    Big Oil?                                                          1.3%
                                                                              1.1%
                                                                                       0 .9%
                                                                                                  0 .7%
                                                                                                              0 .2%     0 .2%        0 .2%   0 .1%   0 .1%

                                                                                                                        ExxonMobil
1/ Plus d’investissements dans le

                                                                                       Marathon

                                                                                                  Petrobras

                                                                                                              Chevron

                                                                                                                                     CNOOC
                                                                              Repsol

                                                                                                                                             Inpex
                                                                      Shell
                                                            Equinor

                                                                                                                                                     Eni
                                            Total

                                                    BP
Renewable

2/ Un accent fort sur le Solaire et le
Wind                                       Figure 2: Disclosed low-carbon investments as a proportion of total
                                           CAPEX (2010–Q3 2018) Source: Reuters

3/ Est-ce un vrai trend ou juste une
réponse à la pression ?

4/ Le Big Oil est-il le mieux placé pour
répondre aux problématiques de
conversion ?

5/ What else ?
Quid de                                                              Fossil focus                                                                       All energy

     l’avenir?                                                  Global
                                                                                                                 Trading houses

                                                                                                    Global services co.
1/ La nécessaire transformation des sociétés du BIG Oil :

                                                                                                                                  Independent retailers
                                                                                 XXL oil co.
                                                                                               Special-purpose vehicles
            * La pression pour être dans le renewable ?        Regional                                                                                   Energy
                                                                                                               Mini-majors                                holding
            * Pression politique / sociétale
            * Divergences régionales et continentales ?
                                                                  Local
            * Quels investissements ? Pour quels résultats ?
                                                                                American drillers

2/ Les nouveaux acteurs / métiers du Pétrole
                                                                Figure 4: Oil companies of the future ecosystem

3/ Les trends :
            * Que voit-on maintenant ( 2020/2021) ?             Outlining opportunities for expansion
            * A quoi s’attendre ?
                                                                Regardless of its chosen business model, the oil company
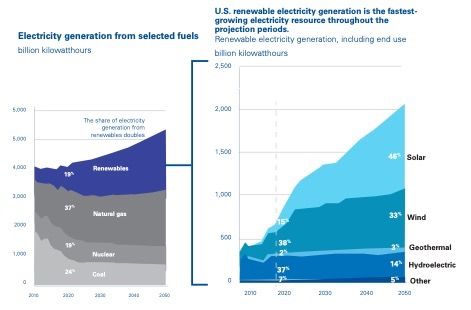
                                                                of the future will find that opportunities for growth and
• Oil consumption

    Quid de
                                                      120
                                                            Mb/d

    l’avenir?                                         100

                                                       80
• La barre des 100 Mb/d est-elle un vieux
souvenir ?
                                                       60

• A quelle Vitesse va-t-on revenir à 80 / 60 / 40 ?

                                                       40
                                                                Rapid
• Peut-on croire à un monde sans transport de
masse à combustion, sans voitures, sans énergie
                                                                Net Zero
‘sale’ ? Et si oui à quelle échéance                   20

                                                                Business-as-usual

                                                        0
                                                         2000              2010     2020   2030   2040   2050
Business As Usual

   Quid de
   l’avenir?
• BUSINESS AS USUAL

             ++ : TROP D’ÉCONOMIES A LA TRAÎNE
             -- : CONSÉQUENCES DU BLACK WEDNESDAY

• RAPID
             ++ : PROGRESSION DU SOLAIRE ET DE
             L’EOLIEN / INVESTISSEMENTS DANS LE
             RENEWABLE
             -- : HARMONISATION DES ACTEURS

• NET ZERO                                          Rapid                       Net Zero
             ++ : MODÈLES BEST PRACTICE DES NORD-
             EUROPÉENS
             -- : LE MODELE COÛT/BÉNÉFICE RESTE À
             PROUVER
Embryonic                 Growth               Mature                     Aging
                                                                                       pre -1900s              1900 - 2000        2000 - 2050?               Post 2050?

Ce que je
                                                                                    Discovery of            International       End-user switch to       Low wind & PV LCOE
                                                                                    petroleum               combustion market   electricty
                                                                                                                                                         Storage-cost reductions
                                                                                                            growth
                                                                                    First steps in E&P                          Natural gas displacing
                                                                                                                                                         Electric vehicles
                                                                                    activities              Periods of cheap    oil for generation
                                                                                                                                                         mandatory in large cities
                                                                                                            oil promoted
                                                                                    Beginnings of the                           Renewables sources

crois?
                                                                                                            displacement of                              Aggressive CO2
                                                                                    refining industry                           penetration
                                                                                                            wood and coal                                taxation

                                                                                 Figure 1: Oil industry maturity curve

1/ 3 Mondes vont co-exister ….comme pour le COVID-19 :

           * Les pays en avance sur le green energy : eliminer les combustibles et surtaxer le CO2 : objectif Carbon Neutral et Oil vers 20-40%

           * Les pays en conversion prônant une gestion mixte – Reduire le Oil vers 60-70%

           * les pays à la traîne : encore completement dépéndantes du Oil – Scenario BAU (BP) – Business as Usual – Oil au-dessus de 80%

2/ Passage du Tout Oil au Smart Oil : les politiques publiques vont pousser à déterminer ce qui fait sens pour les économies et les populations
de facon locale :
           * Il est utopique de penser energie electrique dans des pays ou les delestages sont monnaie courante et ou les distances
necessitent l’utilisation de fossiles
           * Par contre, la pression accrue sur le gaspillage des energies limitées vont encourager les best practices à se vulgariser ( Ex : La
Chine avec ses 400,000 Bus electriques – 3% sur la demande mondiale)
           * Le COVID-19 a permis de rationaliser de facon interessante l’utilisation de l’avion.

3/ S’eloigner des fantasmes et rester pragmatique…..pas de syndrome papier toilette !
ANNEXES
At present, European majors are           — Chevron has a modest renewables         — Royal Dutch Shell’s low-carbon
well ahead of U.S. companies in             portfolio of around 65 MW,                business plans include investing
the push toward renewables and              designed to serve its core oil-           between $2 billion and $3 billion
related utilities.35 The U.S. oil and       and gas-producing operations.39           annually in wind and solar power
gas industry’s average investment           The company recently entered a            generation alone, with additional
in noncore areas, including green           global power purchase agreement           investment dedicated to EV
energy, has been around one percent         (PPA) designed to “green” its             charging, hydrogen and biofuels,
of total capital expenditure to date.36     power supply, which represents a          and other clean energy innovation.
It’s no surprise that U.S. companies        significant advance. The company          The company’s incubator, Shell
have been more conservative, given          has also invested $1 billion in           Ventures, invests in and partners
investor expectations and other             CCUS projects in Australia and            with small and medium enterprises
challenges for even the very largest        Canada, and, in 2018, launched a          (SMEs) to develop new technologies
players in oil and gas. However, their      US$100 million Future Energy Fund         and business models.41
efforts are expanding. Examples             to invest in innovative technology.40
                                                                                    — Total now has a gross low-carbon
across the globe include:                   The venture capital fund has
                                                                                      power-generation capacity of almost
                                            targeted EV charging, battery
— BP announced a $1 billion                                                           9 gigawatts worldwide, including 5
                                            technology, and direct-CO2 capture
  investment in offshore wind                                                         gigawatts from renewable energies
                                            from the air.
  projects through a deal with Equinor                                                and a target of 25 GW of renewable
  in September 2020 and is looking        — ExxonMobil is investing more than         generation by 2025.42 At the
  to expand even further in North           $1 billion per year into R&D-related      beginning of 2020, the company
  America. The move was part of             to reducing carbon emissions,             won Europe’s largest EV charge-
  the company’s stated target of net        and the company has a biofuels            point contract in the Netherlands,
  zero by 2050, including increasing        output goal of 10,000 b/d by 2025.        partnered with Groupe PSA in a
  renewable power capacity to 50            The company has also invested             pilot EV battery facility, and took a 2
  GW over 10 years. The company             heavily in carbon capture and             GW Spanish solar position.43
  already has a sizeable onshore wind       storage (CCS) and discloses it has
  business.37 BP has also partnered         a working interest in approximately
  in CCUS and hydrogen projects,            one-fifth of the word’s total carbon-
  among others.38                           capture capacity.
• Disruptive energy sources: Taking early positions in
     development of innovative technologies such as fusion
     or hydrogen sources.

Case example: Shell New Energies                                   Case example: Total’s commitment to renewable energy
To play its part in creating a low-carbon future, Shell has
set up its New Energies business, with projects in biofuels,
biomass, hydrogen-fueling stations, EV charging, gas-to-           Convinced of the opportunities renewable energies have
liquid (GTL)/liquefied natural gas (LNG), onshore and offshore
wind, thermal and photovoltaic solar, and power distribution       to offer, Total is focusing its main ambitions on solar power
and electricity supply from renewable energy sources. The
company is planning to spend between $1 billion and $2
                                                                   generation, targeting production capacity of five gigawatts
billion annually in the New Energies divisions until 2020. Even
though this represents less than 1 percent of revenues, it
                                                                   by 2022. Other areas of focus are wind and hydraulic power
still positions Shell as one of the largest investors behind the
“energy transition”.
                                                                   generation technologies. Total also believes optimizing
Case example: Equinor New Energy Solutions and
                                                                   energy storage is key to expansion of renewables, which
Energy Ventures fund
                                                                   is why it has acquired Saft, a world leader in battery
Equinor is also betting on developing non-traditional sources
of energy under its New Energy Solutions division. It has
                                                                   technology. A further area of interest for Total is bioenergy,
become a significant innovator in offshore wind technology
and a world leader in carbon capture and storage (CCS)
                                                                   in which commercial biomass production has allowed it to
technologies. According to Equinor, its Energy Ventures
fund is one of the world’s largest corporate venture funds
                                                                   produce biofuels including ethyl tert-butyl ether (ETBE) and
dedicated to investing in attractive and ambitious growth
companies in renewable energy; it has earmarked more than
                                                                   hydrotreated vegetable oil (HVO) for diesel.
$200 million in total investment capital.

                                                                   Insight for the executive
FREQUENTLY ASKED QUESTIONS (FAQS)

What   countries are the top producers and consum
FREQUENTLY ASKED QUESTIONS (FAQS)
of oil?
The 10 largest oil1 producers and share of total world oil production2 in 20203

 What countries are the top producers and consum
Country
United States
                                  Million barrels per day
                                           18.60
                                                                   Share of world total
                                                                           20%

 of oil?
Saudi Arabia
Russia
                                           11.01
                                           10.50
                                                                           12%
                                                                           11%
Canada
 The 10 largest oil1 producers and share    5.29of total world oil production
                                                                            6% 2 in 20203
China                                       4.93                            5%
Iraq
  Country                                   4.16 per day
                                  Million barrels                           4% total
                                                                  Share of world
United
  UnitedArab   Emirates
          States                            3.79
                                           18.60                         20%4%
Brazil
  Saudi Arabia                              3.78
                                           11.01                         12%4%
Iran
  Russia                                    2.81
                                           10.50                            3%
                                                                          11%
Kuwait
  Canada                                    2.66
                                            5.29                            3%
                                                                           6%
Total
  Chinatop 10                              67.52
                                            4.93                           72%
                                                                           5%
World
  Iraq total                               94.24
                                            4.16                           4%
  United Arab Emirates                      3.79                           4%
1 Brazil
  Oil includes crude oil, all other petroleum
                                            3.78 liquids, and biofuels. 4%
2 Iran                                      2.81of crude oil, all other petroleum
                                                                           3%
  Production includes domestic production                                           liquids, biofuels, and refin
  Kuwait                                    2.66                           3%
processing
  Total top 10
               gain.                       67.52                          72%
3 Source: International Energy Statistics, Total oil (petroleum and other liquids) production, April 1, 20
  World total                              94.24

The
 1 Oil10
       includes  oil1 consumers
         largestcrude                and shareliquids,
                      oil, all other petroleum    of total
                                                        andworld oil consumption in 20182
                                                            biofuels.
 2 Production includes domestic production of crude oil, all other petroleum liquids, biofuels, and refiner
Country                     Million barrels per day            Share of world total
 processing gain.
United  States                       20.51                             20%
 3 Source: International Energy Statistics, Total oil (petroleum and other liquids) production, April 1, 202
China                                13.89                             14%
India                                  4.77                             5%
 The 10 largest oil1 consumers and
Russia                                 3.88
                                           share of total world oil consumption
                                                                        4%
                                                                                   in 20182
Japan                                  3.79                             4%
  Country                   Million barrels per day           Share of world total
Saudi Arabia                           3.08                             3%
  United States                       20.51                           20%
Brazil                                 3.06                             3%
  China                               13.89                           14%
South Korea                            2.57                             3%
  India                                4.77                            5%
Canada                                 2.53                             3%
  Russia                               3.88                            4%
Germany                                2.33                             2%
  Japan                                3.79                            4%
Total top 10                         60.40                             60%
  Saudi Arabia                         3.08                            3%
World
  Brazil
        total                        100.37
                                       3.06                            3%
  South Korea                          2.57                            3%
1 Oil includes crude oil, all other petroleum liquids, and biofuels.
  Canada                               2.53                            3%
2 Source: International Energy Statistics, Total oil (petroleum and other liquids) consumption, Decem
  Germany                              2.33                            2%
  Total top 10
2020.                                 60.40                           60%
  World total                        100.37
Learn   more:
 1 Oil includes crude oil, all other petroleum liquids, and biofuels.
Energy
 2
         Explained: Where our oil comes from
   Source: International Energy Statistics, Total oil (petroleum and other liquids) consumption, Decembe
 2020.
Last updated: April 1, 2021

 Learn more:
 Energy Explained: Where our oil comes from
Other FAQs about Oil/Petroleum
Vous pouvez aussi lire