Medical practice variations - Dental imaging (Adjusted)
←
→
Transcription du contenu de la page
Si votre navigateur ne rend pas la page correctement, lisez s'il vous plaît le contenu de la page ci-dessous

Dentists - Dental imaging (Adjusted)

                                    Medical practice variations

                                       Dental imaging (Adjusted)

Analysis of the distribution and evolution of medical practice in Belgium, in terms of volume and expenditure per insured
                           (analysis and trends by region, province and district), for the year 2019

                     NIHDI – Healthcare Service – Directorate for Research, Development and Quality promotion
                                                        Appropriate care unit
                                               Pascal Meeus, Virginie Dalcq, Delphine Beauport
                                     Michaël Vande Velde, Lucien Hoekx, Kathleen Sierens, Benjamin Swine
                                                Contact: appropriatecare@riziv-inami.fgov.be

                                                    Date of report: 5 August 2021

                                                                                                                                   1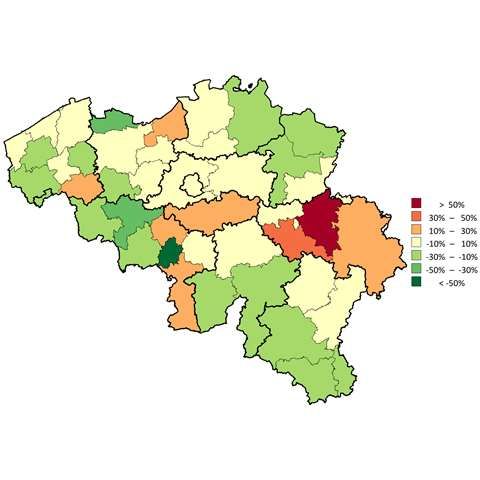
Dentists - Dental imaging (Adjusted)

CONTENTS
CONTENTS ................................................................................................................................................................................................................................. 2

1.        INTRODUCTION ................................................................................................................................................................................................................. 3

2.        SPECIFIC METHOD OF ANALYSIS ........................................................................................................................................................................................ 4

     A.       NIHDI NOMENCLATURE CODES SELECTED FOR ANALYSIS....................................................................................................................................................................... 4
     B.       PAST HISTORY OF NOMENCLATURE CODES ......................................................................................................................................................................................... 5
     C.       SOURCE OF DATA AND ANALYSIS PERIOD ............................................................................................................................................................................................ 6
     D.       SPECIFIC SELECTION CRITERIA .......................................................................................................................................................................................................... 7
     E.       STANDARDISATION........................................................................................................................................................................................................................ 7

3.        RESULTS ............................................................................................................................................................................................................................ 8

     A.       NATIONAL STANDARDISED RATE OF USE............................................................................................................................................................................................. 8
     B.       BREAKDOWN OF NOMENCLATURE CODES PROVIDED, BY VOLUME ........................................................................................................................................................... 9
     C.       SPECIALISATION OF HEALTHCARE PROVIDERS .................................................................................................................................................................................... 10
     D.       SPECIALISATION OF PRESCRIBERS.................................................................................................................................................................................................... 11
     E.       STANDARDISED RATE OF USE BY GENDER AND AGE GROUP................................................................................................................................................................... 12
     F.       STANDARDISED RATE OF USE: HOSPITAL AND OUTPATIENT CARE ........................................................................................................................................................... 16
     G.       STANDARDISED RATE OF USE BY REIMBURSEMENT SCHEME ................................................................................................................................................................. 18
     H.       TRENDS IN STANDARDISED RATES OF USE ......................................................................................................................................................................................... 20
     I.       GEOGRAPHICAL VARIATIONS IN STANDARDISED RATES OF USE .............................................................................................................................................................. 23
     J.       STANDARDISED HEALTHCARE EXPENDITURE BORNE BY THE INSURANCE .................................................................................................................................................. 28

4.        KEY DATA SUMMARY ...................................................................................................................................................................................................... 31

5.        APPENDICES .................................................................................................................................................................................................................... 32

     A.       ANALYSIS OF VARIANCE (ANOVA) ................................................................................................................................................................................................. 32
     B.       FREQUENCY OF PRACTICE OCCURRENCES......................................................................................................................................................................................... 33
     C.       PATIENT CARE SETTINGS ............................................................................................................................................................................................................... 35
     D.       CODING VARIATIONS AND PRACTICE ALTERNATIVES............................................................................................................................................................................ 37

                                                                                                                                                                                                                                                          2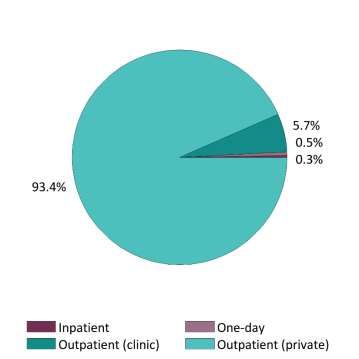
Dentists - Dental imaging (Adjusted)

    1. INTRODUCTION

The Appropriate Care Unit was set up within the NIHDI’s Directorate for Research, Development and Quality under NIHDI’s Admin-
istration Contract for 2016-20181. Article 35 of this contract refers to ‘the setting up of an Appropriate Care Unit, aiming specifically
to promote an integrated approach to the rational use of resources’. The Appropriate Care Unit has been up and running since the
second quarter of 2017.

The tasks of the Unit were set out formally in the ‘2016-2017 Healthcare monitoring Action plan’, published by NIHDI on 18 July 20162.
This plan lists around thirty measures designed to make healthcare provision more efficient, by encouraging appropriate practice and
tackling unnecessary or inappropriate care.

The plan states that one of the tasks of the Appropriate Care Unit is to analyse the ‘appropriateness of care’, in order to identify
unexplained variations in consumption patterns, identified after standardisation. Such variations can potentially point to non-optimal
use of resources.

‘Variations in medical practice’ documents report on the analyses carried out in this framework. Each report focuses on a particular
topic.

In this document, we present the figures and graphs relating to analyses3 of practice in the area of Dental imaging (Adjusted), and give
the explanations necessary to understand these.

We have deliberately chosen not to attempt to interpret the figures, preferring to present the results to experts who are in a better
position to do so. This document has nevertheless been made available to the public in order to provide objective, open input to
discussions on this issue.

1
  (Institut national d'assurance maladie-invalidité, 2016)
2 (Institut national d'assurance maladie-invalidité, 2016)
3 Readers interested in the methodology used in these quantitative analyses should consult the document entitled ‘Variations in practice – Methodology’.

                                                                                                                                                           3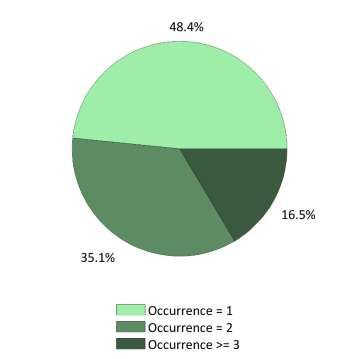
Dentists - Dental imaging (Adjusted)
2. SPECIFIC METHOD OF ANALYSIS
A. NIHDI nomenclature codes selected for analysis
The NIHDI nomenclature codes selected for the analysis are listed below:
Outpatient Inpatient Rates Expenses Label Creation Deletion Group N Value
Ra di ogra phi e extra bucca l e d'un hémi -ma xi l l a i re i nféri eur, à pa rtir du 18e
307016 307020 yes yes 01-06-1991 N04 N26
a nni vers a i re
Ra di ogra phi e i ntra bucca l e de dent ou de groupe de dents s ur un même cl i ché,
307031 307042 yes yes 01-06-1991 N04 N13
à pa rtir du 18e a nni vers a i re
Ra di ogra phi e i ntra bucca l e de dent ou de groupe de dents s ur un même cl i ché
307053 307064 yes yes : pa r cl i ché s uppl émentai re da ns une même s éa nce, à pa rtir du 18e 01-06-1991 N04 N8
a nni vers a i re
Exa men ra di ogra phi que pa nora mi que des deux mâ choi res , quel que s oi t l e
307090 307101 yes yes 01-06-1991 N04 N41
nombre de cl i chés , à pa rtir du 18e a nni vers a i re
Tél éra di ogra phi e crâ ni o-fa ci a l e pour orthodontie : Un cl i ché, à pa rtir du 18e
307112 307123 yes yes 01-06-1991 N04 N40
a nni vers a i re
Tél éra di ogra phi e crâ ni o-fa ci a l e pour orthodontie : Deux cl i chés à pa rtir du 18e
307134 307145 yes yes 01-06-1991 N04 N55
a nni vers a i re
Conebea m CT dentai re de l a mâ choi re s upéri eure en ca s de fentes l a bi o-
307230 307241 yes yes 01-03-2011 N04 N123
a l véopa l a tines , à pa rtir du 18e jus qu'a u 22e a nni vers a i re
Conebea m CT dentai re uni que de l a mâ choi re i nféri eure chez un bénéfi ci a i re,
307252 307263 yes yes 01-03-2011 N04 N123
à pa rtir du 70e a nni vers a i re, qui s a tis fa i t a ux condi tions de l 'a rticl e 6, § 5bi s
Exa men ra di ogra phi que pa nora mi que des deux mâ choi res , a près un tra uma
307274 307285 yes yes externe de l a s phère oro-fa ci a l e, quel que s oi t l e nombre de cl i chés , à pa rtir 01-05-2014 N04 N41
du 18e a nni vers a i re
Ra di ogra phi e extra bucca l e d'un hémi -ma xi l l a i re i nféri eur, jus qu'a u 18e
377016 377020 yes yes 01-09-2005 N04 N26
a nni vers a i re
Ra di ogra phi e i ntra bucca l e de dent ou de groupe de dents s ur un même cl i ché,
377031 377042 yes yes 01-09-2005 N04 N13
jus qu'a u 18e a nni vers a i re
Ra di ogra phi e i ntra bucca l e de dent ou de groupe de dents s ur un même cl i ché
377053 377064 yes yes : pa r cl i ché s uppl émentai re da ns une même s éa nce, jus qu'a u 18e 01-09-2005 N04 N8
a nni vers a i re
Exa men ra di ogra phi que pa nora mi que des deux mâ choi res , quel que s oi t l e
377090 377101 yes yes 01-09-2005 N04 N41
nombre de cl i chés , à pa rtir du 7e jus qu’a u 18e a nni vers a i re
Tél éra di ogra phi e crâ ni o-fa ci a l e pour orthodontie : Un cl i ché, jus qu’a u 18e
377112 377123 yes yes 01-09-2005 N04 N40
a nni vers a i re
Tél éra di ogra phi e crâ ni o-fa ci a l e pour orthodontie : Deux cl i chés jus qu’a u 18e
377134 377145 yes yes 01-09-2005 N04 N55
a nni vers a i re
Conebea m CT dentai re de l a mâ choi re s upéri eure en ca s de fentes l a bi o-
377230 377241 yes yes 01-03-2011 N04 N123
a l véopa l a tines , jus qu'a u 18e a nni vers a i re
Exa men ra di ogra phi que pa nora mi que des deux mâ choi res , a près un tra uma
377274 377285 yes yes externe de l a s phère oro-fa ci a l e, quel que s oi t l e nombre de cl i chés , jus qu’a u 01-12-2014 N04 N41
18e a nni vers a i re
Conebea m CT dentai re s a ns contra s te de l a mâ choi re s upéri eure et/ou de l a
459933 459944 yes yes 01-08-2017 N50 N117
mâ choi re i nféri eure
This table shows the NIHDI nomenclature codes selected for this analysis, stating whether or not they were included in the analyses of services and expenditure, and
giving, for each one, a description, dates of creation and deletion, where appropriate, their N group (in the NIHDI nomenclature) and their value. 4Dentists - Dental imaging (Adjusted)
B. Past history of nomenclature codes
Outpatient Inpatient Date Label
Examen radiographique de toute une mâchoire ou des deux mâchoires, par cliché panoramique, quel que soit le
307090 307101 01-05-2009
nombre de clichés, à partir du 18e anniversaire
Examen radiographique de toute une mâchoire ou des deux mâchoires, par cliché panoramique, quel que soit le
307090 307101 01-07-2015
nombre de clichés, à partir du 18e anniversaire
Examen radiographique panoramique des deux mâchoires, quel que soit le nombre de clichés, à partir du 18e
307090 307101 01-02-2018
anniversaire
Conebeam CT dentaire unique de la mâchoire inférieure chez un bénéficiaire qui satisfait aux conditions de
307252 307263 01-03-2011
l'article 6, § 5bis
Conebeam CT dentaire unique de la mâchoire inférieure chez un bénéficiaire qui satisfait aux conditions de
307252 307263 01-07-2015
l'article 6, § 5bis
Conebeam CT dentaire unique de la mâchoire inférieure chez un bénéficiaire, à partir du 70e anniversaire, qui
307252 307263 01-12-2016
satisfait aux conditions de l'article 6, § 5bis
Examen radiographique de toute une mâchoire ou des deux mâchoires en cas de répétition dans les deux années
307274 307285 01-05-2014 civiles après un trauma externe de la sphère oro-faciale, par cliché panoramique, quel que soit le nombre de
clichés, à partir du 18e anniversaire
Examen radiographique de toute une mâchoire ou des deux mâchoires en cas de répétition dans les deux années
307274 307285 01-07-2015 civiles après un trauma externe de la sphère oro-faciale, par cliché panoramique, quel que soit le nombre de
clichés, à partir du 18e anniversaire
Examen radiographique panoramique des deux mâchoires, après un trauma externe de la sphère oro-faciale,
307274 307285 01-02-2018
quel que soit le nombre de clichés, à partir du 18e anniversaire
Examen radiographique de toute une mâchoire ou des deux mâchoires, par cliché panoramique, quel que soit le
377090 377101 01-05-2009
nombre de clichés, jusqu'au 18e anniversaire
Examen radiographique de toute une mâchoire ou des deux mâchoires, par cliché panoramique, quel que soit le
377090 377101 01-07-2015
nombre de clichés, jusqu'au 18e anniversaire
Examen radiographique panoramique des deux mâchoires, quel que soit le nombre de clichés, à partir du 7e
377090 377101 01-02-2018
jusqu’au 18e anniversaire
Examen radiographique de toute une mâchoire ou des deux mâchoires en cas de répétition dans les deux années
377274 377285 01-12-2014 civiles après un trauma externe de la sphère oro-faciale, par cliché panoramique, quel que soit le nombre de
clichés, jusqu'au 18e anniversaire
Examen radiographique de toute une mâchoire ou des deux mâchoires en cas de répétition dans les deux années
377274 377285 01-07-2015 civiles après un trauma externe de la sphère oro-faciale, par cliché panoramique, quel que soit le nombre de
clichés, jusqu'au 18e anniversaire
Examen radiographique panoramique des deux mâchoires, après un trauma externe de la sphère oro-faciale,
377274 377285 01-02-2018
quel que soit le nombre de clichés, jusqu’au 18e anniversaire
This table displays the historic evolution of the definitions of the NIHDI-nomenclature codes taken into account for this analysis, if modifications
were implemented during the period 2009-2019.
5Dentists - Dental imaging (Adjusted)
C. Source of data and analysis period
The data used in the analyses have been taken from the following databases:
for the utilisation rate and amount of expenses of insured persons (who meet
Document N the selection criteria) whose age, sex, preferential regime and residence are
known 2009-2019
for the utilisation rate and amount of expenses of insured persons (who meet
Document P
the selection criteria) by type of medical specialities in 2017-2019
- -
- -
Analysis period 2009-2019
'N Documents' are monthly data sent by the sickness funds to NIHDI, within three months. These data show the number of services provided, dates and
the fees involved. Every six months, these data are compiled by the insurers, which also add data on patients: age, gender, social category and district of
residence. N Documents, however, cannot be used to analyse the combinations of services received by individual patients.
'P Documents' are six-monthly data sent by the sickness funds to NIHDI, within four months. These data show the services provided, the service-provider,
the prescriber, the place of provision of service, and the hospital where patients were treated. P Documents can be used to monitor medical consumption
and pricing, but not (yet) to analyse services per patient.
6Dentists - Dental imaging (Adjusted)
D. Specific selection criteria
Several filters may have been applied to the data, so that only one section of the population is considered in analyses. If so, the fil-
ters used are shown in the table below:
FILTERS APPLIED TO DATA
Gender women and men
Age all
- -
E. Standardisation
The data are standardised before analysis per year, based on age, sex and preferential regime per arrondissement, province and re-
gion.
Standardisation renders populations comparable in relation to one or several criteria. If a difference is observed between these populations, we can
therefore assume that it is not due to the criteria covered by the standardisation process.
7Dentists - Dental imaging (Adjusted)
3. RESULTS
A. National standardised rate of use
TOTAL
Average number of interventions per year 2.342.929
Standardised rate of use
20.639
per 100,000 insured persons
8Dentists - Dental imaging (Adjusted)
B. Breakdown of nomenclature codes provided, by volume
100
90
80
Percentage nomenclature codes
70
Other
60 377090-377101
377053-377064
50 377031-377042
307090-307101
307053-307064
40
307031-307042
30
20
10
0
2009 2010 2011 2012 2013 2014 2015 2016 2017 2018 2019
Year
See page 4 for details about the NIHDI nomenclature codes selected for analysis.
9Dentists - Dental imaging (Adjusted)
C. Specialisation of healthcare providers
Specialisation of the provider Total providers Concerned providers % Providers Median of H.C. services Number of H.C. services % Total H.C. services Expenses % Expenses
Dentists 7905 7512 95% 194 1879325 80% 43.625.855,53 72%
Orthodontists 509 475 93% 256 155647 7% 7.962.883,87 13%
Stomatologists 601 545 91% 72 94708 4% 3.240.576,57 5%
Periodontologists 192 190 99% 382 93063 4% 1.654.941,55 3%
Dentists in training 1059 949 90% 44 91992 4% 2.301.739,42 4%
Radiology 1609 689 43% 14 39333 2% 1.934.528,18 3%
Other specialities 2799 5 0% 4 14 0% 331,02 0%
Total 14674 10365 71% 163 2354082 100% 60.720.856,14 100%
This table shows the following non-standardised data, by medical specialities (average figures for the period 2019):
- The number of service-providers per specialisation who have recorded at least one service;
- The number of service-providers recording services under the nomenclature codes selected for this analysis;
- The service-providers for these codes as a percentage of the total number of service-providers recording provision of at least one service;
- The median number of services per service-provider (recording provision under these codes);
- The number of services provided;
- The service percentage, i.e. the number of services recorded for this specialisation as a percentage of total services provided;
- Expenditure;
- The expenditure percentage, i.e. the expenditure on this specialisation as a percentage of total expenditure.
10Dentists - Dental imaging (Adjusted)
D. Specialisation of prescribers
Specialisation of the prescriber Total prescribers Concerned prescribers % Prescribers Median of prescriptions Number of prescriptions % Prescriptions Expenses % Expenses
Not applicable 0 0 0% 0 2301330 98% 58.278.313,71 96%
Stomatologists 573 454 79% 7 25464 1% 1.145.816,74 2%
Other specialities 63955 4570 7% 1 27288 1% 1.296.725,69 2%
Total 64528 5025 8% 1 2354082 100% 60.720.856,14 100%
This table shows, in order, the following non-standardised data per specialities (average figures for the period 2019):
- The number of prescribers who have prescribed at least one service;
- The number of prescribers prescribing the nomenclature codes selected for this analysis;
- The prescribers prescribing these codes as a percentage of the number of prescribers prescribing at least one service;
- The median number of services per prescriber (prescribing these codes);
- The number of services prescribed;
- The percentage of services prescribed, i.e. the number of prescriptions issued for this specialisation as a percentage of total services prescribed;
- Expenditure;
- The expenditure percentage, i.e. expenditure on this specialisation as a percentage of total expenditure.
11Dentists - Dental imaging (Adjusted)
E. Standardised rate of use by gender and age group
TOTAL
Average number of interventions per year 2.342.929
Median age (years) 41
Mean age (years) 41,01
Max/Min Ratio of the median age
1,75
(by district)
Percentage of women 53,68%
Max/Min Ratio:
The max/min ratio measures the dispersion of values. It is calculated as the ratio of the maximum value found
for the variable, in all districts, to the minimum value. If this minimum value is equal to zero, the max/min ratio
cannot be calculated, and should be given as ‘NA’ (‘not applicable’).
12Dentists - Dental imaging (Adjusted)
This figure is made up of bar
charts for each gender. The coef-
ficient of variation, shown by the
red line, measures the relative
dispersion of the standardised
rates of use observed for each
district, by age group and gender
(standard deviation divided by
the mean). This line is shown in
bold for age groups where the
variation coefficient can be val-
idly interpreted (i.e. for age
groups in which there are suffi-
cient insured persons per district
to allow for a proper compari-
son).
The left-hand vertical axis of the
graph plots the standardised rate
of use, and the right-hand axis
plots the variation coefficient.
The horizontal axis shows the di-
vision by age group. The horizon-
tal dotted lines show the total
values of the standardised rates
of use (in blue) and of the varia-
tion coefficient (in red).
Standardised rate of use per 100,000 insured persons, and variation coefficient for the districts, by age
group and gender, for the year 2019
13Dentists - Dental imaging (Adjusted)
40,000
Standardised number of H.C. services per 100,000 insured persons
35,000
30,000
25,000
Woman
20,000
Man
15,000
10,000
5,000
0
00 05 10 15 20 25 30 35 40 45 50 55 60 65 70 75 80 85 90 95
-0 -0 -1 -1 -2 -2 -3 -3 -4 -4 -5 -5 -6 -6 -7 -7 -8 -8 -9 +
4 9 4 9 4 9 4 9 4 9 4 9 4 9 4 9 4 9 4
Age group
Comparison of the standardised rates of use for women and men (per 100,000) in 2019
14Dentists - Dental imaging (Adjusted)
Woman Man
TOTAL Woman TOTAL Man
35,000
30,000
Standardised number of H.C. services
This histogram shows standard-
per 100,000 insured persons
25,000 ised rates of use by province and
22,019.71
by gender. The grey bars show
20,000 19,248.26 the rates for men, while the
green bars show the rates for
women, for each province. The
15,000
grey and green broken lines
show the total standardised rates
10,000 of use, again grey for men, green
for women.
5,000
0
W
Oo
A
Li
Vl
Br
Br
Ha
Li
Na
Lu
TO
nt
mb
èg
aa
us
ab
es
xe
in
mu
s
TA
we
t-V
ms
e
t-V
se
an
au
mb
ur
r
L
rp
g
ls
laa
-B
tW
t
laa
ou
en
ra
nd
rg
nd
all
ba
er
er
on
nt
en
en
Standardised rate of use per 100,000 insured persons, by gender and by province for the year 2019
15Dentists - Dental imaging (Adjusted)
F. Standardised rate of use: hospital and outpatient care
TOTAL
Average number of interventions per year 2.342.929
Percentage of out-patient care 99,67%
Max/min ratio of out-patient care percentage
1,01
(by district)
100%
99.67
90%
This graph shows the percent-
80% age of outpatient services (in-
Percentage of outpatient H.C. services
cluding hospital day admis-
70%
sions), i.e. the number of out-
60% patient services provided as a
percentage of total services
50% (outpatient and hospital
stays). As well as one bar per
40%
region, there is a bar for the
30% whole Belgian population. A
dotted line also shows this
20% overall ratio.
10%
0%
Flanders Brussels Wallonia TOTAL
Percentage of outpatient care, total and by region
16Dentists - Dental imaging (Adjusted)
100%
80%
Percentage of outpatient H.C. services
Namur
Luxembourg
Brabant Wallon
60% Liège
Brussels
Vlaams-Brabant
Limburg
T OT AL
40% Antwerpen
West-Vlaanderen
Oost-Vlaanderen
Hainaut
20%
0%
2009 2010 2011 2012 2013 2014 2015 2016 2017 2018 2019
Year
Change over time in the percentage of outpatient care, by province
N.B.: A complementary document to this chapter, about the handling of patients per health care sector, is enclosed in this report (cf. page 35).
17Dentists - Dental imaging (Adjusted)
G. Standardised rate of use by reimbursement scheme
TOTAL
Average number of interventions per year 2.342.929
Percentage provided under the preferential reimbursement scheme 16,82%
Standardised rate of use with preferential reimbursement scheme
18.919
(per 100,000)
Standardised rate of use without preferential reimbursement scheme
21.198
(per 100,000)
Ratio Preferential scheme /General scheme 0,89
18Dentists - Dental imaging (Adjusted)
Normal regime Preferential regime
TOTAL Normal regime TOTAL Preferential regime
25,000
21,197.89
20,000 18,918.50
Standardised number of H.C. services
per 100,000 insured persons
This graph shows the stand-
15,000 ardised rates of use with (in
red) and without (in grey) the
preferential reimbursement
scheme, by region and in total.
10,000 The red and grey dotted lines
show the overall standardised
rates of use, with and without
the preferential reimburse-
5,000
ment scheme, respectively.
0
Flanders Brussels Wallonia TOTAL
Standardised rate of use by reimbursement scheme and by region
19Dentists - Dental imaging (Adjusted)
H. Trends in standardised rates of use
TOTAL
Average number of interventions per year 2.342.929
Trend (2009-2019) -0,22%
Trend (2017-2019) 2,70%
25,000
20,000
Standardised number of H.C. services
per 100,000 insured persons
This graph shows a coloured
15,000 curve for each region and a
Brussels
Wallonia black curve for the whole Bel-
T OT AL gian population. The x-axis
Flanders
10,000
shows the years, and the y-axis
shows the standardised rate of
use per 100,000 insured per-
sons.
5,000
0
2009 2010 2011 2012 2013 2014 2015 2016 2017 2018 2019
Year
Trends in the standardised rate of use per 100,000 insured persons, by region
20Dentists - Dental imaging (Adjusted)
40,000
This graph shows a coloured
35,000 line for each district and a
black line for the whole Bel-
gian population. The x-axis
Standardised number of H.C. services
30,000
Liège shows the years, and the y-axis
per 100,000 insured persons
Huy shows the standardised rate of
25,000 Verviers use per 100,000 insured per-
Kortrijk
Nivelles
sons.
20,000 T OT AL
Mons To better highlight changes
Arlon over time, the rates shown are
Eeklo
15,000 rolling averages of the rates for
Ath
La Louvière the three years preceding the
10,000 year in question (including the
year itself).
5,000 The graph only shows the five
districts with the highest aver-
0 age rates and the five districts
2011 2012 2013 2014 2015 2016 2017 2018 2019
with the lowest average rates
over the last 3 years studied.
Year
Trends in the standardised rate of use per 100,000 insured persons, by district
21Dentists - Dental imaging (Adjusted)
Rate
Annual increase
of use
2019 2009- 2017- Structural
(per 105 in- This table shows the standardised rates of use (or of
sured)
2019 2019 break intervention) for the last year analysed (2019), but
also the average rates of increase, by province, by re-
West Flanders 20932,7 0,38% 3,10% gion and in total, for the longer period (2009-2019)
East Flanders 19454,82 0,59% 4,21% and the shorter period (2017-2019).
Antwerp 19631,25 0,27% 3,06% The continuity (or break) of the long-term and short-
Limburg 18068,57 -0,40% 1,76% term trends was statistically evaluated using linear
regressions. These analyses, specific to each geo-
20568,47
Provinces
Flemish Brabant -0,22% 1,28% graphical entity (i.e., province, region), make it pos-
Brussels 21794,49 -1,21% 2,82% sible to highlight whether the evolution of standard-
ised rates of use over the last three years of the anal-
Walloon Brabant 23052,22 -0,54% 3,08% ysis period differs significantly from the evolution of
Hainaut 17003,22 0,07% 2,92% rates over the whole period.
Liège 28554,12 -1,04% 1,67% The significance of the test (and its degree of signifi-
Namur 19751,74 -0,70% 3,27% cance) is reported in the Structural break column : *
Value from p ≤ 0.05 / ** Value from p ≤ 0.01 /
Luxembourg 17400,69 -0,22% 1,83%
*** Value from p ≤ 0.001. If there is no asterisk, the
Flanders 19778,51 0,18% 2,82% trend observed is not statistically significant.
Regions
Brussels 21794,49 -1,21% 2,82%
‘NA’ is shown where the nomenclature codes se-
Wallonia 21685,1 -0,56% 2,41% lected for the analysis have not been used for the
TOTAL 20638,94 -0,22% 2,70% whole of the three-year period.
Trends in the rates of use, by province and region
22Dentists - Dental imaging (Adjusted)
I. Geographical variations in standardised rates of use
TOTAL
Average number of interventions per year 2.342.929
Coefficient of Variation (2019) 19,73
Max/Min Ratio* of the standardised rates of use
1,1
(by region)
Max/Min Ratio* of the standardised rates of use
3,79
(by district)
Coefficient of Variation (2017-2019) 19,41
Coefficient of Variation (2009-2011) 20,66
Statistically significant difference? (p-value) No
* An ‘NA’ result indicates a ratio which cannot be calculated, i.e. the minimum value = zero (cf. E. Standardised rate of use by gender and age
group)
23Dentists - Dental imaging (Adjusted)
36,000
A dot plot is a distribution chart,
34,000 which is useful for highlighting
32,000 grouped data, gaps in distribu-
30,000 tion and outlying values. Here,
28,000
each dot represents the rate of
use of a district, for its whole
Standardised number of H.C. services
26,000
population or broken down by
per 100,000 insured persons
24,000 gender.
22,000
The rates are rounded to the
20,000 nearest unit, ten, hundred, etc.,
18,000 depending on the value of the
16,000 maximum rate, in order to bet-
14,000 ter group the values.
12,000 The graph also shows, as
10,000 ‘boxes’, the 25th, 50th and 75th
8,000
percentiles of the non-rounded
standardised rates of use for all
6,000
patients. The bottom line of the
4,000 box represents the 25th percen-
2,000 tile, while the upper line repre-
0 sents the 75th percentile. The
Woman + Man Woman Man
line inside the box represents
the 50th percentile.
‘Dot plot’ showing standardised rates of use by district, by gender
24Dentists - Dental imaging (Adjusted)
On this map of Belgium, thin lines
show the boundaries of the dis-
tricts, while thick lines show the
provincial borders. The districts
are coloured using a colour scale
based on the level of rate of use in
the district compared to the Bel-
gian median. This comparison is
expressed as a percentage: e.g.
0% if the district rate is equal to
the overall rate, 20% if the rate is
20% above the total rate, and -
20% if the rate is 20% below the
overall rate. The percentages are
calculated using the mean stand-
ardised rate of use of the last
three years, and are displayed in
bands of 20%. The following col-
our coding applies:
Colour Category
More than 50%
Between 30% and 50%
Between 10% and 30%
Between - 10% and 10%
Between -30% and -10%
Between -50% and - 30%
Less than -50%
No use made
Map showing distribution of standardised rates of use, by district
25Dentists - Dental imaging (Adjusted)
On this map of Belgium, thin lines
show the boundaries of the dis-
tricts, while thick lines show the
provincial borders. The districts
are coloured using a colour scale
based on the level of expenditure
in the district compared to Bel-
gian median expenditure. This
comparison is expressed as a per-
centage: e.g. 0% if expenditure in
the district is equal to the overall
expenditure, 20% if it is 20%
higher, and -20% if it is 20% lower.
The percentages are calculated
using the mean standardised ex-
penditure for the last three years
and are displayed in bands of
20%. The following colour coding
applies:
Colour Category
More than 50%
Between 30% and 50%
Between 10% and 30%
Between - 10% and 10%
Between -30% and -10%
Between -50% and - 30%
Less than -50%
No expenditure
Map showing distribution of standardised expenditure, by district
26Dentists - Dental imaging (Adjusted)
In this graph, the standardised rate of
use in a district is placed according to
the size of its population. As well as the
dots for districts, the confidence inter-
vals (expected variation in the stand-
ardised rate of use when the only
source of variation is random) are also
shown on the graph (horizontal percen-
tile lines). These are independent of the
size of the districts. The thicker horizon-
tal line shows the national standardised
rate of use. The outlier districts are in-
dicated by values above P90 and below
P10.
‘Funnel plot’ showing the distribution of standardised rates of use by district,
by number of insured persons
27Dentists - Dental imaging (Adjusted)
J. Standardised healthcare expenditure borne by the insurance
TOTAL
Average number of interventions per year 2.342.929
Average annual expenditure (€) 60.444.661
Average cost per intervention (€) 25,8
Average annual expenditure per insured (€) 5,32
Max/Min Ratio* of expenditure per insured
1,16
(by region)
Max/Min Ratio* of expenditure per insured
3,37
(by district)
* An ‘NA’ result indicates a ratio which cannot be calculated, i.e. the minimum value = zero (cf. E. Standardised rate of use by gender and age
group)
28Dentists - Dental imaging (Adjusted)
Standardised expenditure
(per insured)
West Flanders 5,32 €
East Flanders 4,92 €
Antwerp 4,97 €
Limburg 4,95 €
Provinces
Flemish Brabant 5,21 €
Brussels 5,84 €
Walloon Brabant 5,9 €
Hainaut 4,73 €
Liège 6,85 €
Namur 5,29 €
Luxembourg 4,32 €
Flanders 5,06 €
Regions
Brussels 5,84 €
Wallonia 5,57 €
TOTAL 5,32 €
Regional and provincial distribution of standardised expenditure (2019)
29Dentists - Dental imaging (Adjusted)
Nomenclature 2009 2010 2011 2012 2013 2014 2015 2016 2017 2018 2019 Average annual growth rate
307016-307020 32,88 33,37 33,80 34,50 35,70 36,42 36,51 38,25 42,02 42,84 43,71 2,89%
307031-307042 16,45 16,68 16,86 17,34 17,92 18,21 18,25 18,13 18,36 19,36 19,51 1,72%
307053-307064 10,10 10,24 10,38 10,63 10,99 11,16 11,18 11,00 11,26 11,62 11,63 1,42%
307090-307101 29,41 29,86 30,33 31,08 32,13 32,64 32,73 32,36 32,18 32,92 33,42 1,29%
307112-307123 50,25 51,17 51,94 53,23 54,96 55,80 56,00 55,02 54,45 55,63 56,43 1,17%
307134-307145 69,70 71,04 71,84 73,70 76,16 77,18 77,70 78,60 82,75 84,80 86,12 2,14%
307230-307241 0,00 0,00 112,89 114,12 116,04 0,00 118,72 119,55 104,48 118,56 122,34 1,01%
307252-307263 0,00 0,00 110,40 113,30 116,58 118,79 118,79 115,43 110,68 113,25 115,79 0,60%
307274-307285 0,00 0,00 0,00 0,00 0,00 63,58 63,45 62,96 63,53 64,48 65,25 0,52%
377016-377020 42,82 43,47 44,04 45,09 46,49 47,32 47,32 47,39 48,29 48,97 49,81 1,52%
377031-377042 21,47 21,74 22,04 22,54 23,28 23,64 23,68 23,69 23,86 24,83 24,95 1,51%
377053-377064 13,22 13,38 13,55 13,88 14,33 14,55 14,57 14,57 15,01 15,35 15,35 1,51%
377090-377101 38,19 38,65 39,17 40,06 41,39 42,03 42,10 42,10 42,56 43,87 44,44 1,53%
377112-377123 66,07 66,88 67,78 69,36 71,65 72,74 72,88 72,86 73,92 75,70 76,67 1,50%
377134-377145 90,84 91,95 93,22 95,38 98,47 100,03 100,21 100,20 101,49 104,36 105,46 1,50%
377230-377241 0,00 0,00 125,23 127,95 131,99 134,03 134,21 134,23 135,60 139,16 141,73 1,56%
377274-377285 0,00 0,00 0,00 0,00 0,00 80,98 80,94 80,94 81,88 84,25 85,36 1,06%
459933-459944 0,00 0,00 0,00 0,00 0,00 0,00 0,00 0,00 61,24 62,02 62,13 0,72%
Change over time in expenditure, by service and by nomenclature code
30Dentists - Dental imaging (Adjusted)
4. KEY DATA SUMMARY
TOTAL
PROVIDERS & PRESCRIBERS
Main healthcare providers: Dentists 80,00%
Main prescribers: Not applicable -
RATE OF USE
Average number of interventions (per year) 2.342.929
Standardised rate of use (per 100,000 insured persons) 20638,94
≥ 2 occurrences per patient (2019)4 51,6%
Percentage of outpatient care 99,67%
POPULATION
Median age 41 years
5
Max/min ratio of the median age (by district) 1,75
Percentage of women6 53,68% ***
Ratio Preferential rate/General rate6 0,89 ***
TRENDS
Trend6 (2009-2019) -0,22%
NS
Trend6 (2017-2019) 2,70%
GEOGRAPHICAL VARIATIONS
Coefficient of variation6 (2009-2011) 20,66
NS
Coefficient of variation6 (2017-2019) 19,41
Max/min5 Ratio of number of interventions6 (per 100,000 insured persons, by region) 1,1 ***
Max/min Ratio5 of number of interventions (per 100,000 insured persons, by district) 3,79
DIRECT EXPENDITURE
Average annual expenditure 60.444.661 €
Average annual expenditure per insured 5,32 €
Max/Min Ratio5 of expenditure per insured (by region) 1,16
Max/Min Ratio5 of expenditure per insured (by district) 3,37
Average cost of interventions 25,8 €
4
CODING VARIATIONS & PRACTICE ALTERNATIVES
Variations in practice coding6 (by province) Yes ***
Variations in the choice of practice alternatives6 (by province) Yes ***
4
More detailed results are shown in a document enclosed to this report.
5
An ‘NA’ result indicates a ratio, which cannot be calculated, i.e. the minimum value equals zero.
6
If the result(s) show(s) a significant difference, the level of statistical significance is symbolized by one to three asterisks (in-
creasingly significant). Otherwise, NS is displayed (not significant).
31Dentists - Dental imaging (Adjusted)
5. APPENDICES
A. Analysis of variance (ANOVA)
Statistical significance of the differences observed in 2019
By region? Yes ***
By gender? Yes ***
By reimbursement scheme? Yes ***
By gender and per region? No
By reimbursement scheme and per region? Yes ***
By gender and per reimbursement scheme? No
By gender and reimbursement scheme and per region? No
In order to be able to assess the significance of the observed differences, an ANOVA analysis can be carried out.
The ANOVA analysis applied here examines each factor separately (region, gender and reimbursement scheme). The statistical significance of the observed
differences in the rate of use for each of these three factors is therefore first assessed separately.
On the other hand, the analysis is also applied in a multifactorial way, crossing two or three factors, in order to identify possible significant differences that
are more specific. For example, are there significant differences in the rate of use by gender at the regional level?
The asterisks represent the level of statistical significance of the observed data with the following values: * Value threshold of p ≤ 0,05 / ** Value
threshold of p ≤ 0,01 / *** Value threshold of p ≤ 0,001. The absence of an asterisk indicates that the difference observed is statistically insignificant.
32Dentists - Dental imaging (Adjusted)
B. Frequency of practice occurrences
Frequency Per year Per day Some practices may be billed several
times for the same patient in the same
2 occurrences 35,1% 35,1% year or even on the same day. This may
be due to a repetition of the practice,
≥ 3 occurrences 16,5% 8,0% but also to an anatomical effect, which
may lead, depending on the organ con-
≥ 2 occurrences 51,6% 43,1% cerned, to performing the same prac-
tice bilaterally, which may therefore
cause a double occurrence on the same
day.
In order to interpret the results per day
validly, it is useful to note that the same
patient may be counted several times
if, for example, he or she has received
two identical services simultaneously,
twice a year.
These frequency analyses of occur-
rences are carried out over the year
2019 using the following databases:
Documents P, ADH and SHA.
Values « n.a. » are indicated if the data
were not available at the time of this re-
port.
Distribution of practice recurrences per year (2019)
33Dentists - Dental imaging (Adjusted)
17.2%
2,18 2,2
15%
2,0
occurence: relative diff. vs total (%)
1,90
10% 1,85 1,86 1,86 1,85 1,86 1,86
1,8
1,79 1,79
occurence
5% 1,70 1,70
1,6
2.2%
0.0% 0.0% 0.0%
0%
(0.5%) (0.5%) 1,4
(3.8%) (3.8%)
(5%) 1,2
(8.6%) (8.6%)
(10%) 1,0
W
Oo
A
Li
Vl
Br
Br
Ha
Li
Na
Lu
TO
nt
mb
èg
aa
us
ab
es
xe
in
mu
s
TA
we
t-V
ms
e
t-V
se
an
au
mb
u
r
rg
L
rp
ls
laa
-B
tW
t
laa
ou
e
ra
nd
n
rg
nd
all
ba
er
er
on
nt
en
en
relative diff. occurence
Frequency of practice occurrences by province and variation vs national value (2019)
34Dentists - Dental imaging (Adjusted)
C. Patient care settings
Care Settings
Outpatient (private) 93.4%
Outpatient (polyclinic) 5.7%
(Day) Hospital 0.5%
Hospital (stay) 0.3%
Distribution of patient care settings in 2019
In addition to the chapter on standardised inpatient and outpatient use rates (see page 16), the analysis of patient care settings can be refined by identifying
the outpatient (private and polyclinic) and inpatient (day or standard hospitalisation) sub-sectors.
These analyses are carried out over the year 2019 using the following databases: Documents P, ADH and SHA.
Values « n.a. » are indicated if the data were not available at the time of this report.
35Dentists - Dental imaging (Adjusted)
100
80
Percentage of H.C. services
60
40
20
0
W
Oo
A
Li
Vl
Br
Br
Ha
Li
Na
Lu
TO
nt
mb
èg
aa
us
ab
es
xe
in
mu
s
TA
we
t-V
ms
e
t-V
se
an
au
mb
u
r
rg
L
rp
ls
laa
-B
tW
t
laa
o
e
ur
ra
nd
n
nd
all
g
b
er
an
er
on
en
en
t
Inpatient One-day Outpatient (clinic) Outpatient (private)
Distribution of patient care settings by province (2019)
36Dentists - Dental imaging (Adjusted)
D. Coding variations and practice alternatives
Variations in coding:
100 [Due to the large number of nomenclature codes selected for this analysis, we
cannot include them in the legend here. We therefore invite you to read the de-
90 459933-459944 tails concerning them on page 4 of this report.]
377274-377285
80 377230-377241
377134-377145
Percentage nomenclature codes
70 377112-377123
377090-377101
377053-377064
60
377031-377042
377016-377020
50 307274-307285
307252-307263
40 307230-307241
307134-307145
30 307112-307123
307090-307101
20 307053-307064
307031-307042
307016-307020
10
0
FL
BR ER
W EL
W ON
Oo laa
A
Li rpe
Vl g
Br -Br
Br ls (P t
Ha t W
Li t
Na
Lu
TO o u
n t an d
mb n
èg
aa
us
ab
A
es
A
xe
in
mu
US S
st
TA rg
we
LL
ms
e
ND
t-V
s e b an
an o v )
au llon
mb
-V der
ur
r
S
L
la
S
a
IA
n
r
a
er
e
en
n
Volume breakdown of nomenclature codes
Significance By region By province
Use of
*** ***
Nomenclature codes7
7
The calculation of significance is carried out here by comparing the geographical differences in the use of the different nomenclature codes to code the practice.
The asterisks represent the level of statistical significance of the observed data with the following values: * Value threshold of p ≤ 0,05 / ** Value threshold of p ≤ 0,01 / 37
*** Value threshold of p ≤ 0,001. NS and NA respectively indicate that the variations are not significant or not applicable.Dentists - Dental imaging (Adjusted)
Variations in practice alternatives:
100 Combined codes Groupings
90 307016-307020 3_Else
80
307031-307042 3_Else
Percentage group codes (Group 1)
70
307053-307064 3_Else
60
3_Else
50 2_Cone_Beam_CT 307090-307101 1_X-Ray_assessment
1_X-Ray_assessment
40 307112-307123 3_Else
30
307134-307145 3_Else
20
307230-307241 2_Cone_Beam_CT
10
307252-307263 2_Cone_Beam_CT
0
FL
BR DER
W EL
W ON
Oo Vlaa
A
Li rpe en
Vl rg
Br -Br
Br ls (P t
Ha t W )
Li t
Na
Lu
TO o u
307274-307285 3_Else
n t an d n
mb n
èg
aa
us
ab
A
es
A
xe
in
mu
US S
st
TA rg
we
LL
ms
e
N
t- A
s e b an
an o v
au allo
mb
-V der
u
r
S
L
la
S
a
I
n
r
377016-377020 3_Else
er
n
e
Breakdown of choice for practice alternatives 377031-377042 3_Else
377053-377064 3_Else
Significance By region By province
Choice of 377090-377101 1_X-Ray_assessment
*** ***
Practice alternatives 377112-377123 3_Else
377134-377145 3_Else
377230-377241 2_Cone_Beam_CT
377274-377285 3_Else
38Dentists - Dental imaging (Adjusted)
459933-459944 2_Cone_Beam_CT
According to the nature of the practice and the analytical tools available, it may be possible to identify and define alternatives for carrying out the practice. In this
case, the nomenclature codes defined for the analysis of the practice are grouped together with the aim of analysing whether or not the choices of these alternatives
are homogeneous across the territory. The calculation of significance displayed in the table is carried out by comparing these groups of codes with each other. 39Dentists - Dental imaging (Adjusted)
40Vous pouvez aussi lire