Évaluation de la pertinence des plantations sur friches agricoles en Abitibi-Ouest dans le contexte de lutte contre les changements climatiques
←
→
Transcription du contenu de la page
Si votre navigateur ne rend pas la page correctement, lisez s'il vous plaît le contenu de la page ci-dessous
Évaluation de la pertinence des plantations sur friches
 agricoles en Abitibi-Ouest dans le contexte de lutte
         contre les changements climatiques

                             Mémoire

                         Mélina Thibault

          Maîtrise en sciences forestières - avec mémoire
                     Maître ès sciences (M. Sc.)

                         Québec, Canada

                      © Mélina Thibault, 2021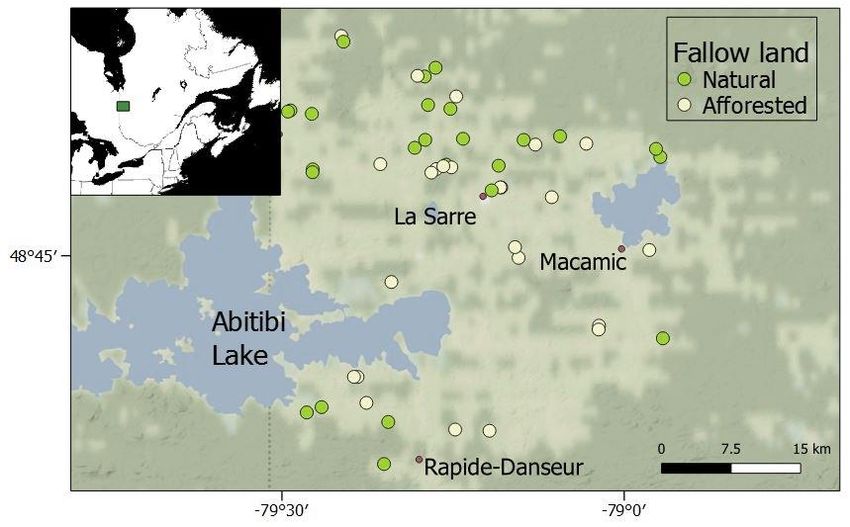
Évaluation de la pertinence des plantations sur friches agricoles
      en Abitibi-Ouest dans le contexte de lutte contre les
                   changements climatiques

                                 Mémoire

                             Mélina Thibault

                           Sous la direction de :

                 Évelyne Thiffault, directrice de recherche
                 Yves Bergeron, codirecteur de recherche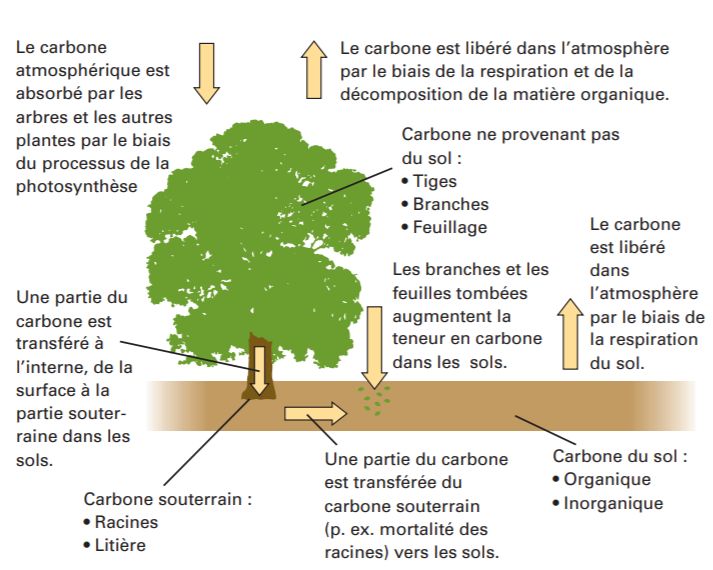
Résumé
         Boiser les terres agricoles abandonnées (friches) est une méthode autorisée par le Protocole de Kyoto
pour créer des puits de CO2 et ainsi réduire la concentration de CO2 atmosphérique. Il se trouve que l’Abitibi-
Ouest offre le plus grand potentiel de boisement des friches au Québec avec ses 51 000 hectares de friches.
Or, avant d’enclencher tout projet de boisement, il est essentiel d’évaluer si le boisement procure de réels
bénéfices en termes de séquestration de carbone dans une perspective de lutte aux changements climatiques;
il s’agit donc du but de cette étude. Pour ce faire, des mesures pédologiques et de la biomasse ont été effectuées
de juin à septembre 2019 dans la région de l’Abitibi dans 26 friches naturelles sur lesquelles une succession
végétale naturelle s’est installée, et 23 friches plantées en épinette blanche. Le premier objectif a été de
reconstruire la chronoséquence de succession végétale dans les friches laissées à l’état naturel. Le deuxième
objectif était de comparer l’accumulation du carbone dans le temps dans les principaux réservoirs (végétation,
sol) des friches naturelles et plantées. Ainsi, il a été observé que sur un horizon d’environ cinq décennies, les
friches plantées stockent 2 fois plus de carbone dans la végétation, tandis que les friches naturelles stockent 2
fois plus de carbone dans le sol. Au final, la quantité totale de carbone stockée (végétation et sol) par les friches
plantées en épinette blanche est la même que pour les friches laissées à la succession naturelle. Cette étude
permettra d’orienter la prise de décision quant à l’utilisation du boisement des friches en Abitibi, et met en lumière
le fait que d’autres objectifs d’aménagement que la séquestration de carbone devraient être considérés. Les
résultats obtenus alimenteront également la réflexion sur la pertinence du boisement comme outil de lutte aux
changements climatiques que ce soit au niveau provincial, national ou mondial.

                                                          ii
Abstract
Afforesting abandoned agricultural lands (fallow lands) is a method authorized by the Kyoto Protocol to
create CO2 sinks and thus reduce atmospheric CO2. It turns out that Abitibi-Ouest offers the greatest potential
for afforestation of fallow lands in Quebec with its 51 000 hectares of fallow land. However, before starting any
afforestation project, it is essential to assess whether afforestation provides real benefits in terms of carbon
sequestration and therefore contribute to climate change mitigation. The purpose of this study is therefore to
document these benefits. To do this, soil and biomass measurements were carried out from June to September
2019 in the Abitibi-Ouest region in 26 fallow lands with natural plant succession, and 23 afforested fallow lands
in white spruce. The first objective was to reconstruct the chronosequence of plant succession on fallow lands
left to natural vegetation. The second objective was to compare the carbon accumulation over time in the main
pools (vegetation, soil) of natural and afforested fallow lands. It has been observed that over a 50-year horizon,
afforested fallow lands stored twice as much carbon in vegetation, while natural fallow lands stored twice as
much carbon in the soil. Overall, the total amount of carbon stored (including both vegetation and soil) was
similar between afforested fallow lands and those left to natural succession. This study will guide decision-
making on the use of afforestation of fallow lands in Abitibi and highlights the fact that other management
objectives than carbon sequestration should be considered. The results obtained will also fuel reflection on the
relevance of afforestation as a tool to fight climate change, whether at the provincial, national or global level.
iiiTable des matières
Résumé ............................................................................................................................................................... ii
Abstract............................................................................................................................................................... iii
Table des matières ............................................................................................................................................. iv
Liste des figures .................................................................................................................................................. vi
Liste des tableaux .............................................................................................................................................. vii
Liste des abréviations, sigles et acronymes...................................................................................................... viii
Remerciements ....................................................................................................................................................x
Avant-propos ...................................................................................................................................................... xi
Introduction ......................................................................................................................................................... 1
Contexte de l’étude......................................................................................................................................... 1
Concepts de base........................................................................................................................................... 2
Puits et sources de carbone....................................................................................................................... 2
Le boisement et ses implications ............................................................................................................... 3
Objectifs et hypothèses .................................................................................................................................. 3
Chapitre 1 – Can afforestation of fallow lands contribute to climate change mitigation ? A case study in Abitibi
(Quebec). ............................................................................................................................................................ 5
1.1 Résumé ............................................................................................................................................. 5
1.2 Abstract ............................................................................................................................................. 5
1.3 Introduction........................................................................................................................................ 6
1.4 Material and methods ........................................................................................................................ 7
1.4.1 Study Area .................................................................................................................................... 7
1.4.2 Site selection................................................................................................................................. 8
1.4.3 Data collection .............................................................................................................................. 9
1.4.4 Laboratory analyses .................................................................................................................... 11
1.4.5 Data computation ........................................................................................................................ 11
1.5 Results ............................................................................................................................................ 12
1.5.1 Vegetation in natural fallow lands ............................................................................................... 12
1.5.2 Vegetation and woody debris ...................................................................................................... 14
1.5.3 Soil .............................................................................................................................................. 15
1.5.4 Ecosystem C stocks .................................................................................................................... 16
1.6 Discussion ....................................................................................................................................... 18
1.6.1 Vegetation ................................................................................................................................... 18
iv1.6.2 Soil C .......................................................................................................................................... 19
1.6.3 Recommendations for carbon and land management ................................................................ 20
1.7 Conclusion .............................................................................................................................................. 21
1.8 Acknowledgements ................................................................................................................................ 22
Conclusion ........................................................................................................................................................ 23
References ....................................................................................................................................................... 25
Appendix A ....................................................................................................................................................... 28
Appendix B ....................................................................................................................................................... 30
vListe des figures
Fig 1. Cycle du carbone forestier. Tiré de Conseil canadien des ministres des forêts, sd. ................................. 2
Fig. 2. Location of afforested and natural fallow lands in Abitibi, western Quebec, Canada. .............................. 8
Fig. 3. Global portrait of chronosequence in natural FL in Abitibi according to the years after farming stopped.
.......................................................................................................................................................................... 13
Fig 4. Distribution of C in the soil of natural and afforested fallow lands, according to age class and soil depth
.......................................................................................................................................................................... 16
Fig 5. Distribution of C content in natural and afforested fallow land according to age class. .......................... 17
viListe des tableaux
Table 1. Fallow land distribution according to age class ..................................................................................... 9
Table 2. Plot area according to the type and age class of the fallow land .......................................................... 9
Table 3. Average stem density, species diversity and main species of tall shrubs and trees according to Fallow
land age class and type. The underlined number is the average DBH for the dominant species in centimeters
when applicable. ............................................................................................................................................... 13
Table 4. Adjusted means for C content in the vegetation and woody debris for afforested and natural fallow
lands with standard error, difference (afforested – natural FL stocks), and p-value. ........................................ 14
Table 5. Adjusted means for soil C content down to 50 cm for natural and afforested fallow lands with standard
error, difference (afforested – natural FL stocks), and p-value. ....................................................................... 15
Table 6. Adjusted means of total ecosystem C stocks in natural and afforested fallow lands with standard error,
difference (afforested - natural FL stocks), and p-value................................................................................. 16
viiListe des abréviations, sigles et acronymes
ANOVA : Analysis of variance
AIC : Akaike Information Criterion
C : Carbone organique, carbon
cm : Centimeters
CO2 : Dioxide de carbone
CBM-CFS3 : Carbon Budget Model – Canadian Forestry Sector
DSH : Diameter at soil height
DBH : Diameter at breast height
FL : Fallow land
GHG : Greenhouse gas
Ha : Hectare
m : Meters
MFFP : Ministère des Forêts, de la Faune et des Parcs
Mg : Megagrams
T : Tonnes
UQAT : Université du Québec en Abitibi-Témiscamingue
Yr : Year
viii« C’est une triste chose de songer que la
nature parle et que le genre humain ne
l’écoute pas … » - Victor Hugo
ixRemerciements
Je tiens premièrement à remercier ma directrice de recherche Évelyne Thiffault de l’Université Laval.
Elle est non seulement la raison pour laquelle j’ai poursuivi aux études supérieures, mais elle est aussi une
femme inspirante qui m’a donné la confiance, la motivation et le support nécessaire à l’accomplissement de ce
mémoire, et je lui en suis extrêmement reconnaissante.
J’aimerais également remercier Yves Bergeron de l’Université du Québec en Abitibi-Témiscamingue
(UQAT), qui est un codirecteur de recherche d’excellence. Par sa grande expérience en recherche, il m’a
accompagnée dans la rédaction de mon mémoire.
D’autre part, mon projet étant réalisé en collaboration avec le Ministère des Forêts, de la Faune et des
Parcs (MFFP), je tiens à remercier deux de leurs incroyables chercheurs de la Direction de la recherche
forestière : Sylvie Tremblay et Rock Ouimet, qui se sont partagé la tâche de superviseur de recherche. Sylvie a
été d’une aide inestimable pour la collecte de données en Abitibi. Sa bonne humeur, son énergie débordante,
son soutien, son expertise, et sa bienveillance m’ont apporté beaucoup, non seulement dans le cadre de mon
projet, mais aussi au niveau personnel. Pour ce qui est de Rock, je tiens à lui dire un énorme merci pour son
aide pour la réalisation de mes statistiques. C’était une partie difficile pour moi, et il m’a toujours épaulée en se
rendant disponible lorsque j’avais des soucis, et en prenant le temps de m’expliquer mes erreurs. Il m’a
également beaucoup aidée dans la rédaction. Bref, sans ces deux personnes attentionnées et dévouées, la
réalisation de mon projet aurait été nettement plus difficile.
Également, je ne peux pas passer à côté de mes deux auxiliaires de recherche, Félix Baril-Veillette et
Émile Lacroix, qui m’ont plus qu’aidée dans la réalisation de mon projet. Non seulement ils m’ont accompagnée
dans la collecte de données sur le terrain, mais ils ont aussi préparé le terrain, en faisant notamment des
analyses géomatiques et littéraires pour aboutir au choix des parcelles à échantillonner. De plus, ils ont été
d’une aide immense au laboratoire à la préparation des sols.
Finalement, mes remerciements ne seraient pas complets sans remercier tous les gens qui ont de près
ou de loin contribué au succès de ce projet. Je pense notamment à Pierre Grondin du MFFP, Philippe Duval,
technicien forestier qui a été d’une grande aide en Abitibi, et Véronique Rouleau, qui a su m’instruire sur le
carbone forestier au début de ma maîtrise. Évidemment, je ne me serais pas rendue aussi loin sans le support
inestimable de ma famille, mon copain, et mes ami(e)s tout au long de cette merveilleuse aventure. Je tiens
notamment à remercier Noémie Lacroix-Dubois et Benjamin Orlik, deux ami.e.s/partenaires de maîtrise en or,
pour leur présence (virtuelle!) qui était rassurante et motivante.
xAvant-propos
Cette étude a été financée par la Direction de la recherche forestière (ministère des Forêts, de la Faune
et des Parcs), et je certifie que je suis l’auteure principale de ce document. J’ai planifié et réalisé les travaux sur
le terrain, participé aux analyses des échantillons de sol, planifié les analyses statistiques et réalisé la rédaction
du mémoire. Ce mémoire inclut un article scientifique qui sera soumis pour publication en 2021, raison pour
laquelle ce chapitre de mon mémoire est écrit en anglais. Pour la rédaction de ce mémoire, je tiens à souligner
le dévouement d’Évelyne Thiffault, ma directrice de recherche, Yves Bergeron, mon codirecteur de recherche,
ainsi que Rock Ouimet et Sylvie Tremblay mes superviseurs de recherche. Sans ces quatre chercheurs, ce
mémoire ne serait pas d’aussi grande qualité. Ainsi, ils sont tous co-auteurs de l’article scientifique.
L’étude des réserves de carbone dans les fiches naturelles et ayant été transformées en plantations
est un sujet extrêmement d’actualité, dans la mesure où les gouvernements tentent d’élaborer des plans afin de
lutter contre les changements climatiques. C’est d’ailleurs pour cette raison que ce sujet est étudié : guider les
instances gouvernementales à faire les bons choix quant à l’aménagement de notre territoire dans une
perspective de lutte, ou devrais-je dire d’atténuation des changements climatiques.
xiIntroduction
Contexte de l’étude
L’étude porte sur la comparaison entre la captation de carbone des friches naturelles sur lesquelles une
succession végétale naturelle s’est installée, et celle des friches plantées en épinette blanche (Picea glauca
(Moench) Voss). Une friche est, par définition, un « terrain dépourvu de culture et abandonné ». Ce sont donc
d’anciennes terres agricoles où l’agriculture n’est plus pratiquée. Dans le cadre de ce projet, le terme « friche
naturelle » fait donc référence à des terres agricoles qui ont été abandonnées et dont la végétation présente
s’installe par succession naturelle. Les friches « plantées » font référence aux terres agricoles abandonnées
sur lesquelles les propriétaires ont décidé de planter des essences arborescentes, ici des épinettes blanches.
La séquestration et le stockage du carbone sont mesurés à la fois dans la masse des végétaux et dans le sol.
Plusieurs enjeux environnementaux, politiques, économiques et sociaux encadrent cette étude. En effet,
il y a premièrement un grand enjeu environnemental qui est l’atténuation des effets des changements
climatiques par l’augmentation de l’accumulation du carbone par les terres. Il y a également un enjeu politique:
le boisement des terres non-forestières (dont les terres agricoles abandonnées) est une proposition du
protocole de Kyoto, et avec l’annonce du gouvernement du Canada en 2019 de planter 2 milliards d’arbres à
travers le Canada, il importe de savoir dans quel contexte et sur quels sites au pays cette approche peut
s’avérer efficace pour la lutte aux changements climatiques. Ainsi, cela amène indirectement un enjeu
économique, car il est impératif de savoir s’il est plus profitable dans une perspective de lutte aux changements
climatiques d’investir dans le boisement des friches plutôt que dans d’autres pratiques ou technologies de
réduction ou de séquestration des émissions de CO2. Les deux derniers enjeux sont donc étroitement reliés.
Le dernier, et non le moindre, est l’enjeu social. En effet, la grande majorité des friches en Abitibi se situent
sur des terres privées. Les recommandations issues de cette étude auront donc des impacts sur les
propriétaires des lots. Le changement d’utilisation de terres, notamment la conversion de terres à vocation
agricole vers une vocation forestière, peut soulever des enjeux d’acceptabilité sociale; donc s’il s’avérait que
c’était la meilleure option pour atténuer les changements climatiques, beaucoup de travail serait à faire pour
conscientiser la population. D’un autre côté, si la friche naturelle est plus profitable pour le stockage de
carbone, certains propriétaires pourraient être mécontents de ne pas pouvoir tirer des avantages économiques
de leur terre, ce que peut offrir la plantation. C’est pourquoi cette étude vise à dresser un portrait sur la
pertinence de boiser des friches en Abitibi-Témiscamingue dans une perspective de lutte aux changements
climatiques. Cette région a été sélectionnée pour son grand nombre de friches qui pourraient potentiellement
être reboisées (plus de 50 000 hectares).
1Concepts de base
Puits et sources de carbone
La photosynthèse, la respiration autotrophe et la respiration hétérotrophe sont les trois processus
d’échange de carbone entre l’atmosphère, la végétation et le sol. La photosynthèse permet à la végétation
d’absorber le CO2 de l'atmosphère. La respiration autotrophe quant à elle représente l'ensemble des processus
métaboliques qui, chez les végétaux, provoquent une libération de CO2 dans l'atmosphère. Finalement, la
respiration hétérotrophe est la libération de CO2 dans l'atmosphère par les activités des organismes qui ne
font pas de photosynthèse. Cette dernière se déroule dans le sol principalement grâce à l'activité microbienne
qui transforme le matériel organique en CO2 (Ryan and Law 2005). La figure 1 présentée ci-dessous illustre
ces différents échanges entre la végétation, le sol et l’atmosphère, ainsi que le type de carbone séquestré
dans chaque structure.
Fig 1. Cycle du carbone forestier. Tiré de Conseil canadien des ministres des forêts, sd.
Pour déterminer si un écosystème constitue un puits ou une source de carbone, il faut regarder
l'importance relative de la photosynthèse par rapport aux diverses formes de respiration. Un écosystème est
considéré comme un puits de carbone lorsque, pour une période donnée, la quantité de CO2 absorbée par la
photosynthèse est supérieure à la quantité libérée par la respiration autotrophe et la respiration hétérotrophe.
2Or, si la quantité de CO2 libérée est supérieure à la quantité absorbée, l'écosystème est, pour une période
donnée, considéré comme une source de carbone (Ryan and Law 2005).
Les divers processus qui affectent les flux de carbone connaissent des fluctuations selon les stades
de développement de l’écosystème. La force du puits de carbone d’un peuplement s’accroit avec l’âge au
cours des premières décennies pour ensuite ralentir lors que le peuplement atteint la maturité (Litvak et al.
2003), quoique cela soit très variable en fonction des conditions de peuplement. En effet, certains peuplements
peuvent continuer à être un puits de carbone même à un âge très avancé (Luyssaert et al. 2008). Pour le sol,
pour qu’il soit un puits de carbone, il faut qu’il y ait plus d’apport en carbone via la litière et les débris (biomasse
morte) que de perte par les processus de respiration du sol. Les apports en litière proviennent de biomasse
morte. Ainsi, il est possible que les sols des jeunes plantations soient une source de carbone, car il y aura
moins d’apport en matière organique morte que de respiration par les micro-organismes du sol (Tremblay et
al. 2006). L’équilibre entre la production de litière et débris et les processus de décomposition du sol est atteint
à différents âges selon les caractéristiques de la plantation (Compton et al. 1998).
Par ailleurs, on peut mentionner qu’à l’échelle du paysage, les territoires peuvent être des sources
de carbone notamment en raison de l’occurrence de perturbations naturelles. Celles-ci peuvent réduire la
croissance des peuplements et créer d’importants apports de matière organique morte.
Le boisement et ses implications
Le boisement est relié à un changement de vocation des terres, passant de terres agricoles à
forestières. On parle ainsi de boisement, car il y a établissement d’une nouvelle forêt (Gouvernement du
Canada 2018). Le nouvel écosystème créé par l’établissement d’espèces arborescentes apporte son lot de
changements, notamment quant au sol et le carbone qu’il contient. En effet, selon l’étude de Guo et Gifford
(2002), la conversion d’une terre en pâturage en une plantation peut diminuer les stocks de carbone du sol de
10 à 12% si ce sont des conifères qui sont plantés. À l’inverse, les stocks de carbone du sol peuvent augmenter
de 18% lorsqu’il y a passage entre une terre cultivée à une plantation.
Objectifs et hypothèses
Le but de cette étude est d’évaluer le potentiel du boisement de friches agricoles pour la séquestration
de carbone. Cette évaluation est effectuée en comparaison avec un scénario de référence pour lequel les
friches sont laissées à la succession végétale naturelle.
3Ainsi, le premier objectif de cette étude est d’établir la chronoséquence végétale dans les friches
naturelles étudiées. Le deuxième objectif est de comparer l’accumulation du carbone dans le temps dans les
principaux réservoirs (végétation, sol) des friches naturelles et plantées.
L’hypothèse de recherche principale est que les friches plantées vont accumuler plus de carbone au
total dans l’écosystème que les friches naturelles. Cette hypothèse est basée notamment sur l’étude de
Tremblay et Ouimet (2013), réalisée dans la région du Bas Saint-Laurent, dans laquelle il a été découvert que
les plantations d’épinette blanche sur friches accumulaient plus de carbone que les friches laissées à l’état
naturel. En effet, les plantations permettent un début d’accumulation de carbone dès la mise en terre. La
succession végétale des friches naturelles peut, quant à elle, rester à stades préliminaires plusieurs années
avant que des arbres s’établissent et commencent à stocker du carbone de manière significative.
La seconde hypothèse est que les stocks de carbone dans le sol des friches naturelles seront plus
élevés que ceux des friches plantées. En effet, l’étude de Tremblay and Ouimet (2013) a évalué qu’il y avait
plus de carbone dans les sols des friches naturelles que plantées. Ainsi, nous faisons l’hypothèse que si le
boisement présente des bénéfices quant au carbone total de l’écosystème (végétation + sol) par rapport à la
succession naturelle, le stock de carbone dans les sols serait plus important sous la végétation naturelle (sans
boisement). L’étude de Li et al. (2019) souligne que plus il y a une grande diversité d’espèces, plus y il aura
accumulation de carbone dans le sol. Ce serait les espèces à racines fines qui contribuent à l’accumulation la
plus rapide. Les friches naturelles, étant plus diversifiées et présentant une plus grande abondance dans les
strates herbacées et arbustives, accumuleraient donc plus de carbone dans le sol selon cette dernière étude.
Dans les plantations, les épinettes accumuleraient plus de carbone dans les couches superficielles du sol, ce
qui rend ce stock de carbone plus vulnérable à être « perdu » par décomposition (Laganière et al. 2013).
Aussi, la litière acide produite par les épinettes peut empêcher la présence de micro-invertébrés, qui sont des
agents importants de la préservation du carbone dans les couches minérales (Laganière et al. 2013). Une
autre étude de Laganière, et al. (2010) mentionne que les espèces feuillues accumulent plus de carbone dans
les réservoirs souterrains que les espèces résineuses, étant donné qu’elles ont un système racinaire plus
étendu qui contribue ultimement au carbone du sol. Certes, même s’il est attendu que le carbone soit présent
en plus grande quantité dans le sol des friches naturelles, il est également attendu que la quantité moyenne
de carbone dans le sol dans les deux types d’écosystèmes (avec ou sans boisement) soit plus élevée que
dans les autres écosystèmes forestiers du Québec. En effet, les sols de l’Abitibi contiennent une très grande
concentration d’argile, ce qui devrait permettre au sol d’accumuler jusqu’à 25 % plus de carbone que les sols
plus grossiers (Laganière et al. 2010). Les particules fines qui y sont présentes sont connues pour s’associer
avec les composés organiques, ce qui contribue à la formation de complexes organo-minéraux, complexes
qui maintiennent le carbone très solidement dans le sol (Laganière et al. 2010).
4Chapitre 1 – Can afforestation of fallow lands
contribute to climate change mitigation ? A case
study in Abitibi (Quebec).
1.1 Résumé
L’objectif de cette étude consistait à évaluer les stocks de carbone organique (C) dans le sol et dans
la végétation de friches sur succession naturelle et ayant fait l’objet de boisement par la plantation en épinette
blanche (Picea glauca (Moench) Voss) en Abitibi (Québec, Canada). Le but de cette étude était de déterminer
si le boisement des friches permet une plus grande accumulation de C, dans un contexte de lutte contre les
changements climatiques. Des inventaires ont été réalisés dans les strates arborescente, arbustive et
herbacée en plus des débris ligneux, et des équations allométriques ont été utilisées afin de déterminer leur
biomasse totale. Le sol a été échantillonné jusqu’à 50 cm de profondeur. Nous n’avons pas trouvé de
différence significative entre la quantité totale de C stockée par les friches en succession naturelle et celles
plantées sur un horizon d’environ 50 ans. Les deux types de friches se sont révélés être des puits de C, et ont
donc accumulé plus de C qu’ils n’en ont émis dans l’atmosphère. Cependant, les friches naturelles stockent 2
fois plus de C dans le sol, tandis que les friches plantées stockent 2 fois plus de C dans la biomasse aérienne.
Ces résultats permettent de mettre en perspective l’utilisation du boisement de friches agricoles pour
augmenter le puits de C du territoire, et suggèrent que la protection de la succession naturelle de la végétation
pourrait faire partie de nos pratiques d’aménagement du territoire.
1.2 Abstract
The objective of this study was to assess the carbon (C) stocks in the soil and in the vegetation of
fallow lands left to natural succession and those having been afforested with white spruce (Picea glauca
(Moench) Voss) in Abitibi (Quebec, Canada). The aim of this study was to determine whether the afforestation
of fallow lands allows for a greater C accumulation in the context of climate change mitigation. Inventories
were carried out for the tree, shrub, and herbaceous strata in addition to woody debris, and allometric equations
were used to determine their total biomass. The soil was sampled up to 50 cm depth. There was no significant
difference between the amount of C stored by natural and afforested fallow lands over a horizon of about 50
years. Both types of fallow lands were found to be C sinks, and therefore accumulated more C than they
emitted into the atmosphere. Natural fallow lands stored twice as much C in the soil compared with afforested
fallow lands, while the latter stored twice as much C in aboveground biomass. These results put into
5perspective the use of afforestation to increase land C sink and suggest that natural vegetation succession
might also play a role in land management practices.
1.3 Introduction
Afforesting abandoned agricultural lands, also called “fallow lands” (FL), is a method authorized by
the Kyoto Protocol to create CO2 sinks and thus, reduce atmospheric CO2. However, before doing any
plantation projects on fallow lands, it is crucial to verify whether afforestation increases carbon (C)
sequestration and storage in above- and/or belowground pools compared with natural vegetation succession.
In Quebec (Canada), the region of Abitibi, located in the Clay Belt, offers the greatest potential for
afforestation in the province with its 51 500 hectares of fallow lands (Agence régionale de mise en valeur des
forêts privées de l’Abitibi 2014). As part of provincial and national efforts to meet targets of greenhouse gas
(GHG) emission reductions, it is important to know whether it is profitable from a climate change perspective
to afforest abandoned agricultural lands in this region. Predictions can be made from C cycling models such
as the Carbon Budget Model – Canadian Forestry Sector (CBM-CFS3) (Kurz et al. 2009). However, this model
needs input on species composition and growth rate; while simulating forest stands and plantations can be
based on tree growth and yield data, portraying natural succession on agricultural lands is not as
straightforward due to the lack of detailed information about possible vegetation pathways. Adding data
collected in the field would therefore greatly add to the precision of this model and others, and thus enhance
the capacity to better plan agricultural land and carbon management in Quebec and Canada.
Conversion of an abandoned agricultural land to a forest land notably involves modifications in the
nature and composition of vegetation. Indeed, while the natural succession that takes place on the fallow land
is mainly comprised of shrubs and pioneer deciduous species, afforestation typically involves the plantation of
coniferous species. Laganière et al. (2013) showed that deciduous species have the capacity to accumulate
more C in belowground pools than coniferous species, due to their larger root system that ultimately contributes
to soil C stocks. Spruce species would accumulate more carbon in the top layers of the soil, making this carbon
stock more vulnerable to release by decomposition. The more acidic litter produced by spruces relative to
hardwoods can also prevent the presence of macro-invertebrates, which are important agents in the
stabilisation of carbon in soil mineral horizons (Laganière et al. 2013). Li et al. (2019) noted for their part that
soil C stocks can be positively correlated with species diversity.
As for existing comparison between afforested and non-afforested fallow lands, Tremblay and Ouimet
(2013) observed that afforestation of fallow lands with white spruce (Picea glauca (Moench) Voss)
6accumulated more C in ecosystem pools (including soil and vegetation) than natural vegetation succession in
the Bas-Saint-Laurent region of Quebec, but this difference only became significant 23 years after plantation.
As a result, the net C accumulation rate was on average 1.7 ± 0.7 Mg ha−1 yr−1 greater on afforested sites than
on natural ones over a 50-year period. However, fallow lands left to natural succession accumulated more C
in soil over time than the afforested lands, the latter even experiencing a decrease in soil C stocks in the years
following plantation. Relative to the Bas-Saint-Laurent region, the Abitibi region is characterized by a colder
and drier growing season, which should translate into a slower vegetation growth rate, and a higher abundance
of clayey soils. Natural succession in Abitibi is also dominated by willows (Salix spp.) and aspens (Populus
spp.) rather than birch (Betula papyrifera). Whether similar effects of afforestation as those observed by
Tremblay and Ouimet (2013) would also be obtained in contrasting edaphic and climatic conditions remains to
be seen.
Using the Abitibi region as a case study, the objective of this study was to evaluate the effect on C
sequestration and storage of afforestation of fallow lands, relative to natural succession. We compared the C
accumulation over time in the main above- and belowground C pools (biomass, debris, litter, soil) in fallow
lands left to natural vegetation succession and fallow lands afforested with white spruce. We hypothesized that
afforested fallow lands would accumulate more total ecosystem C than those left to natural succession, but
that soil C stocks would remain greater over time under natural succession than under plantation.
1.4 Material and methods
1.4.1 Study Area
The study was performed in Abitibi, in the administrative Region of Abitibi-Témiscamingue, in Northwest
Quebec (Canada) (Fig.2). This region is characterized by a cold temperate continental climate. Summers are
short, hot and dry, and winters are long, cold and dry. Annual precipitation is approximately 900 mm (Girard-
Côté et al. 2007). The study area is in a physiographic zone known as the Clay Belt. Most of the agricultural
lands found in this region are on clay deposits, which were left 8 500 years ago by the retreat of the Ojibway
glacial lake (Girard-Côté et al. 2007).The study area was limited to the Abitibi plains (ecological region 5a)
(Ministère des ressources naturelles du Québec 2001); this region is included in the balsam fir - white birch
bioclimatic zone (Girard-Côté et al. 2007). Populus tremuloides stands are abundant across landscapes of this
region as this species quickly regenerate after disturbances such as fire or land clearing (Marchais et al.
2020).
7Fig. 2. Location of afforested and natural fallow lands in Abitibi, western Quebec, Canada.
1.4.2 Site selection
The experimental design was composed of 49 fallow lands; 26 were left to natural succession
(hereafter referred as natural FL) and 23 were afforested (hereafter referred as afforested FL). Within each
category, different FL represented different times since agriculture abandonment or plantation (Table 1). The
previous land use of afforested and natural FL was assumed to be fodder crops. Indeed, Girard-Côté et al.
(2007) established that in Abitibi animal production accounts for 81% of agricultural activity; therefore the land
has been cultivated mainly to feed the cattle.
The selection of FL was based on the pedological study of the cleared soils of Abitibi-Témiscamingue
(Rompré et al. 1997) and on the ecoforestry maps and forest inventory data available for the region. For
reasons of uniformity, all selected FL had an area of at least 1 ha, belonged to the same soil catena (Macamic),
and were located on a glaciolacustrine parent material, with a moderate to imperfect drainage (drainage class
3 or 4 according to the Quebec ecological classification) and a 0-3% slope. Natural FL had to be continuously
identified as fallow lands on successive forest maps following the end of agriculture, and not been the subject
of any silvicultural treatment. Due to the impossibility of assessing a precise date of abandonment, natural FL
were divided into 4 age classes (0-10, 10-30, 30-50 and >50 years), based on the age classes that are used
in the ecoforestry map (Table 1).
As for the afforested FL with white spruce, they were selected based on the plantation registry
maintained by the local foresters’ association. White spruce plantations were selected because this species is
known to be well adapted to the area and is often the species of choice for sylvicultural activities. Detailed
8information about the year of plantation establishment provided precise age estimates for afforested FL (Table
1). However, no afforested FL over 50 years old was selected due to the occurrence of various sylvicultural
activities in plantations above this age.
Table 1. Fallow land distribution according to age class
Fallow land 0-10 10-20 20-30 30-40 40-50 50 + Total
type
Natural 4 8 9 5 26
Afforested 5 5 5 5 3 0 23
1.4.3 Data collection
The soil and vegetation inventories and sampling were carried out in the summer of 2019, from the
beginning of June until the beginning of September. The plots were 400 m2 (radius = 11.28 m) or 200 m2 (radius
= 7.98 m) depending on the type and age of the FL (Table 2). The plots were located at the center of the land
(centroid) and at least a 15-m buffer zone was left around the plot.
Table 2. Plot area according to the type and age class of the fallow land
FL Type Age (years) Plot area m2 Characteristics
Afforested 0-15 200 >2500 stems ha-1,
(Average presence of sapling and/or
DBHLitter and soil sampling
Four soil sampling points were located at the cardinal points at the border of each plot, i.e., at a 11.28
m distance from the center for 400 m2 plots, and a 3.98 m distance for 200 m2 plots. The soil was sampled in
10 cm increments to a depth of 50 cm, using a volumetric probe of 8 cm in diameter. When it was not possible
to quantitatively sample a soil layer (due to waterlogging of deeper soil horizons), we used a standard Edelman
auger. When present, the forest floor (LFH horizons) was sampled separately over a 177 cm2 area and its
depth recorded. The soil samples were placed in Whirlpack-type plastic bags, then kept cool in coolers before
being frozen.
Understory vegetation biomass sampling
The biomass of herbaceous, low shrubs (ericaceous, etc.), and other understory plants with a
diameter at the stump height (DSH) of 1 cm) was measured using a sapling compass. For shrubs with height1.4.4 Laboratory analyses
Soil samples were analyzed in the laboratory to assess their C content according to the methodology
used in Tremblay and Ouimet (2013). First, samples were air-dried. To do so, the soil samples were spread
out individually on plates, then stored in a drying room at room temperature for a period of 7 days. Following
this step, soil samples were weighed to calculate the bulk density as described by Federer et al. (1993). Then,
the soils were broken down using a pestle, then a 2-mm grinder. For the final step, ground samples were put
in a Fritsch pulverisette 7 during 2 minutes at a rotational speed of 600 rpm to grind them to 500 m. To
measure their total carbon concentrations, these finely crushed samples were oven-dried (105°C), then
passed through a LECO CR-412 carbon analyzer (dry combustion). The identification of carbonates was also
part of the analysis. Since the carbonates were mainly in the 40-50 cm layer and there was no difference
between the C concentrations in the effervescent and non-effervescent samples, no corrections for their
presence were made.
1.4.5 Data computation
The data was compiled to describe vegetation composition and estimate the above- and belowground
carbon stocks (in tonnes of organic carbon per hectare) as a function of FL age. To estimate C stocks in trees
and tall shrubs, allometric equations from scientific literature and relevant to the study region were used for
each species (Appendix A). These equations use the diameter at stump height (DSH) or diameter at breast
height (DBH). To convert the biomass into C content, we used 0.50 tonne of C/tonne of biomass as a
converting factor for the coniferous species, and 0.49 tonne of C/tonne of biomass for deciduous ones
(Matthews 1993). For woody debris, carbon stocks were estimated using average wood density values for
species and wood decay classes compiled by the National Forest Inventory (Canada’s National Forest
Inventory 2004). Carbon stocks of the understory vegetation were estimated from the dry masses measured
in the quadrats and assuming a concentration of 0.50 tonne of C/tonne of biomass. The C content for the
aboveground biomass (except for woody debris) was multiplied by 1.256 to take in consideration the C
accumulated in the roots (Smyth et al. 2013).
Bulk density of the soil samples that had not been sampled volumetrically (n = 348) was estimated
using a quantitative relationship obtained from the measured bulk density and C concentrations of the
quantitative mineral soil samples (n = 673) following the methodology of Federer et al. (1993).
11Statistical analysis
The analysis of variance (ANOVA) was used to assess whether there was a significant difference in
organic C stocks between afforested and natural fallow lands using general linear least squares (gls). The age
class (0-10 years, 10-30 years, 30-50 years, and >50 years), the type of fallow land (natural vs. afforested)
and the interaction age class x type of fallow land were used as fixed effects. This model was used to test the
differences for the following C pools: vegetation per stratum (trees, tall shrubs, understory vegetation); woody
debris; soil at different depths: 0-10, 10-20, 20-30, 30-40, and 40-50 cm; total vegetation C; total soil C and
total ecosystem C.
The standardized residuals of these models were then plotted against all independent variables to
detect possible heterogeneity in their variances. If present, variance heterogeneity was corrected by allowing
for different variances per stratum. In the analysis of C pools with soil depth, dependency with soil depth was
modelled with a first order (AR1) autoregressive error model to reduce autocorrelations in the residuals. We
selected the models for which the variance function structures had the lowest Akaike Information Criterion
(AIC) scores. Adjusted (predicted) means were computed with emmeans R package v. 1.4.2 (Lenth, 2019),
and statistical comparisons were made using specific a priori contrasts. The analyses were performed with the
nlme R package v. 3.1-141 (Pinheiro et al. 2021) in the R environment (R Core Team 2020).
1.5 Results
1.5.1 Vegetation in natural fallow lands
While vegetation composition was roughly similar for afforested FL irrespective of their age, the
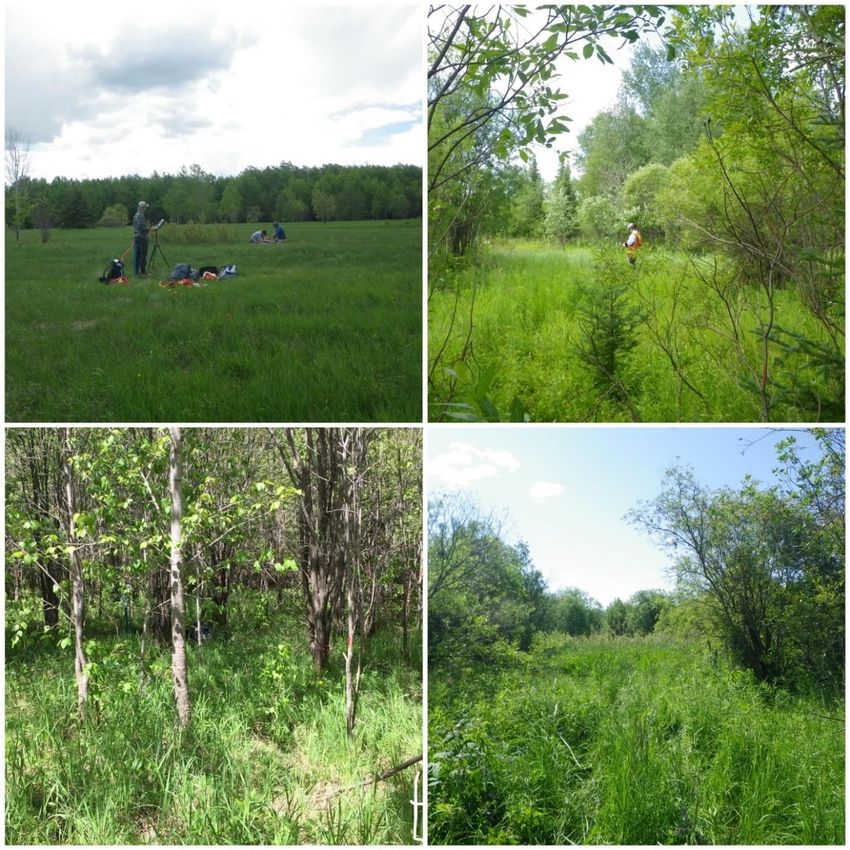
landscape of natural FL varied greatly, even within the same age group (see Appendix B for pictures). In
general, natural FL between 0 and 10 years old were dominated by forbs and grasses on the ground. In the
10–30-year age group, shrubs, especially willows were beginning to take hold among the grasses (Fig 3). For
natural FL between 30 and 50 years old, their landscape was dominated by willows along with grasses and in
rarer cases, a few saplings of trembling aspen or balsam poplar (Populus balsamifera L.) made their
appearance. This age class was found to be very dense (high number of stems) and vertically diversified
compared to the afforested FL of the same age class (Table 3). Finally, natural FL of > 50 years were
dominated by willows (48%) and trembling aspens (32%), along with the presence of other shrub species and
an herbaceous layer.
12Fig. 3. Global portrait of chronosequence in natural FL in Abitibi according to the years after farming
stopped.
Table 3. Average stem density, species diversity and main species of tall shrubs and trees according to Fallow
land age class and type. The underlined number is the average DBH for the dominant species in centimeters
when applicable.
Fallow Age Tall Trees Total Number of Dominant species and
land type class shrubs stems different species average abondance (%
ha-1 of tall shrubs and of total number of
trees stems)
Natural 0-10 488 0 488 3 Salix spp, (66%)
Alnus rugosa (31%)
Cornus stolonifera (1%)
10-30 4478 34 4512 8 Salix spp (94%), 10 cm
Alnus rugosa (3%)
Populus tremuloides
(2%)
30-50 6677 300 6976 9 Salix spp. (83%), 11 cm
Alnus rugosa (8%)
Populus tremuloides
(8%)
50 3462 870 4332 5 Salix spp. (48%), 12 cm
Populus tremuloides
(32%)
Alnus rugosa (19%)
Afforested 0-10 694 0 694 8 Picea glauca (92%)
Alnus rugosa (2%)
Cornus stolonifera (2%)
10-30 2201 806 3007 7 Picea glauca (67%), 14
cm
13Salix spp. (28%)
Alnus rugosa (2%)
30-50 741 1449 2190 8 Picea glauca (74%), 17
cm
Salix spp. (20%)
Picea mariana (4%)
1.5.2 Vegetation and woody debris
There was significantly more C in tree biomass of afforested FL than natural FL (p = 0.004) (Fig 5).
Tree C stocks also increased linearly with age for both natural and afforested FL (p < 0.001 for both). More
precisely, afforested FL stored significantly more C than natural FL for sites of age class 10-30 (p = 0.005)
and 30-50 (p = 0.048). A different trend was observed for C stock of tall shrubs, with natural FL storing
significantly more C in this layer than afforested FL (p = 0.001); significant differences were observed for the
10-30 years (p = 0.005) and 30-50 age group (p = 0.042). However, the relationship of C storage as a function
of time for the tall shrub stratum was neither linear nor quadratic, regardless of FL type (p 0.05). Similarly,
for the understory layer, significantly higher C stocks were found in natural FL relative to afforested FL (p =
0.006). The relationship of C stock in this layer as a function of time was linear for both FL types (pnatural=0.013;
pafforested < 0.001). Carbon stocks in the understory stratum were found to be significantly different for the 30-50
years age class (p 0.001). For woody debris, there was no significant difference in C stock between natural
and afforested FL regardless of age (p = 0.922).
Overall, there was a significant difference in the C stocks for vegetation biomass (including all
vegetation layers) and woody debris between natural and afforested FL (Fig 5; p = 0.037). The afforested FL
stored significantly more C than natural FL in the 30-50 age class (p=0.013), reaching an average difference
of 37.96 t C ha-1. (Table 4). The relationship of total C stocks in vegetation and woody debris as a function of
time was linear for both types of FL (p 0.001).
Table 4. Adjusted means for C content in the vegetation and woody debris for afforested and natural fallow
lands with standard error, difference (afforested – natural FL stocks), and p-value.
Afforested fallow land Natural fallow land
Age group Vegetation and SE Vegetation SE Difference p value
woody debris C and woody (t ha-1)
(t ha-1) debris C
(t ha-1)
0-10 3.095 0.19 2.89 0.66 0.20 0.992
1410-30 34.35 9.80 10.84 3.10 23.51 0.105
30-50 81.24 14.58 43.28 15.13 37.96 0.013
50 - - 69.87 2.84 - -
1.5.3 Soil
Bulk density of these clayey soils averaged 1.07 ± 0.01 g cm-3 (mean ± SE). Modelled bulk density
based on the equation of Federer et al. (1993) compared well to measured bulk density (r2 = 0.84, residual SE
= 0.18). For soil C stocks (including LFH horizons when present, and mineral horizons down to 50-cm depth),
there was a significant difference between natural and afforested FL (p 0.001), with the natural ones
accumulating on average 11.63 t C ha-1 more over 50 years (Table 5). Precisely, we observed higher soil C
stocks in natural FL vs. afforested FL in the 0-10 (p = 0.008) and 10-30 (p = 0.023) age classes. There was a
significant linear relationship between soil C stock and age for afforested FL (p 0.001), and this relation is
marginal for natural FL (p = 0.062).
Table 5. Adjusted means for soil C content down to 50 cm for natural and afforested fallow lands with standard
error, difference (afforested – natural FL stocks), and p-value.
Afforested fallow lands Natural fallow lands
Age range Soil C (T C ha- SE Soil C (T C SE Difference p value
1) ha-1)
0-10 110.45 4.74 157.71 16.99 -47.26 0.008
10-30 134.78 7.27 188.09 22.13 -53.31 0.023
30-50 173.54 9.93 185.17 12.29 -11.63 0.463
50 - - 217.80 25.14 - -
15As shown in Fig. 4, the soil C stock of FL was mostly found in the 0-10 and 10-20 cm depths. Afforested FL
only displayed a significant higher C stock than the natural FL in the LFH layer for sites in the 30-50 years age
class. All the contrasts for every depth according to the type of FL and age can be found in Table A2 (Appendix
A).
Fig 4. Distribution of C in the soil of natural and afforested fallow lands, according to age class and
soil depth . * p 0.05, ** p 0.01, *** p 0.001
1.5.4 Ecosystem C stocks
There was no significant difference between the total C content (including all vegetation strata, woody
debris, and soil) between afforested and natural FL (p = 0.504). The C accumulation increased with age of FL
(Fig. 5).There were no significant differences between types of FL for any of the age groups (table 6).
Table 6. Adjusted means of total ecosystem C stocks in natural and afforested fallow lands with standard error,
difference (afforested - natural FL stocks), and p-value.
Afforested fallow lands Natural fallow lands
Age range Ecosystem C SE Ecosystem SE Difference p value
(t ha-1) C (t ha-1) (t ha-1)
0-10 113.55 20.78 160.60 49.07 -47.1 0.383
10-30 169.13 14.69 198.92 34.70 -29.8 0.434
30-50 254.78 16.43 228.44 32.71 26.3 0.476
50 - - 287.67 43.89 -
16Vous pouvez aussi lire