De dB(A) Conspiracy-Methode van de Nieuwe Economische Wereld Orde - De Narcisten Buster
←
→
Transcription du contenu de la page
Si votre navigateur ne rend pas la page correctement, lisez s'il vous plaît le contenu de la page ci-dessous
Appendix Bezwaarschrift 21130599 20 juni 2021
Even een akoestische-appendix aan het bezwaarschrift aan de Minister van EZK van 15 juni 2021
die weigert de ziekmakende martelende overlast van de UGS-Norg te meten met de dB(C)
weging.
Laag Frequent overlast meten (wegen) met dB(A) is in zich al volstrékte nonsens,
alleen economische psychopaten kunnen dit soort handhavingsnormen bedenken want
met een dB(A) weging KÁN je geen bas (LFg) meten (wegen).
De dB(A) Conspiracy-Methode van de
Nieuwe Economische Wereld Orde
De Economie werkt met het manipuleren van het brein van de potentiële koper/consument.
Dat doen ze met je lekker maken, met reclame en commercials, ook wel met je verlekkeren met
het Twerken.
Twerken dat ook wel wordt gedaan door artiesten die gelieerd zijn
aan de kabbala.
Op de bühne zwaaien met een opblaas penis hoort daar ook bij,
of lekker tegen de kont van een twerkende mede artiest aanrijden
ook met een schaamstreek die al behoorlijk kaal is en tot tegen de
venusheuvel bloot.
Bron foto; Hollywood gossip.
En vanaf MTV is de popmuziek steeds meer van de liefde naar
de lust gegaan. Ad Visser werd daardoor oud bollig.
Heden grijpen artiesten zoals o.a. Miley Cyrus naar hun
geslachtsdeel en zwaaide zij al eens met een opblaas penis om de
jeugd op te hitsen.
Het is feitelijk allemaal de mind-set van de mens en de jeugd
beïnvloeden om met een vorm van twerking het denken te
beïnvloeden. Doelstelling is dan de economie, geld verdienen.
Bijna alle reclame is in principe een vorm van twerking van je
mind-set, het beïnvloeden van je denk-script.
Toegeven aan je lust en koopbehoefte, geïnitieerd door de beïnvloeding van je denk-script vanuit
de economische machten met als voorgespiegeld beeld dat je dan gelukkiger bent.
De mens is sinds geluid en beeld digitaal middels “geestes-wetenschap” bewust steeds meer
geleid naar “de consumptieve ik” mens die geld gecombineerd met lust als hoogste doel in het
levensvaandel heeft staan. Vanuit die gecreëerde lustbehoefte hebben de leidinggevenden macht
over de mens gekregen.
“Marketing” is een vanuit kennis over de psyche van de mens beredeneerd, vorm van geestes-
wetenschap hoe je mensen het best kunt manipuleren, dat geeft bij de uitvoerders slopen van de
eigen ziel en groei van narcisme, de basis onder “economie” is manipulatie van de burger.
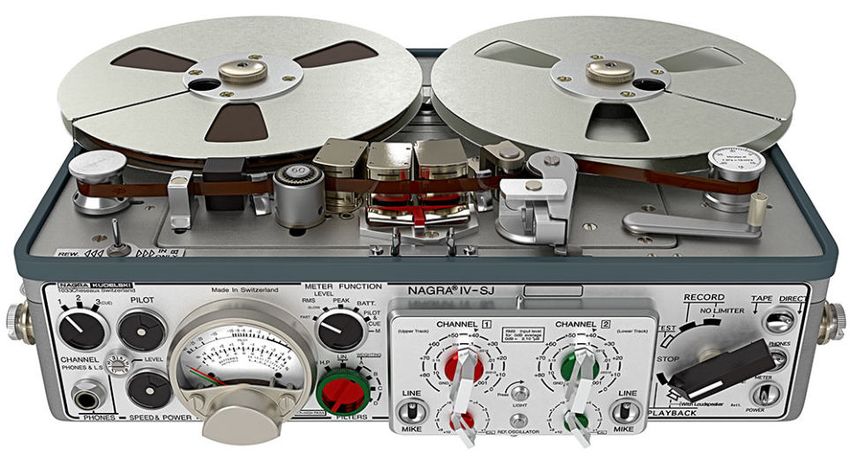
In mijn bezwaarschrift-betoog besteedde ik al veel aandacht aan Nagra-Kudelski.
Ik zat nog even verder te zoeken of er goedkopere Nagra modellen zijn geweest die ook zo’n
“filter switch” hadden zoals de Nagra 4-2. Ik kende het model dat ik toen vond wel maar had me
nooit in dat model verdiept. Ik trof model; Nagra 4-SJ.
De Nagra 4-SJ is uitgebracht in 1972, een jaar na de 4-S (stereo) en twee jaar na de Nagra 4-2.
De Nagra 4-SJ is speciaal gemaakt voor de meet industrie, een “instrumentation” machine, niet
echt geschikt voor High Fidelity opnamen maar voor het op hoog niveau vastleggen van
metingen. Speciaal voor “noise and vibration analyses”. De akoestische-wetenschap weet dus
heel goed van het bestaan, anders was die Nagra 4-SJ er ook niet gekomen… 1972.
narcistenbuster.nl 1/4
20 juni 2021

Deze Nagra 4-SJ was fabriek-af gelijk al geschikt voor het direct aansluiten van Bruel & Kjær
microfoons en een van de Sennheiser microfoons de MKH-110 welke een meetmicrofoon was.
De Sennheiser MKH-110 wat een speciale meet microfoon met een vlak spectrum die helemaal
tot 0,1 Hertz ging, zó laag kon zelfs die Nagra 4-SJ niet eens opnemen, die begon bij 2,5 Hertz.
De MHZ-110 koste in 1971 in New York slechts $ 348.

Nagra-Kudelski & Bruel & Kjær waren in het nog analoge tijdperk kwalitatief elkanders partners,
Kudelski voor de registratie recorder en Bruel & Kjær voor de microfoons.

Waarom zou Kudelski nou zo’n instrumantation machine hebben gemaakt?
Nou, omdat er vraag naar was vanuit de economische wetenschap markt welke te maken kreeg
met steeds meer burgers die last kregen van geluidsoverlast.

Foto; Yukio Miyamoto op Deviant Art

En ja hoor, de Nagra 4-SJ heeft een Filter
Switch op exact dezelfde plaats maar met
een ándere filter functie.

Waar de Nagra 4-2 & 4-S nog de functie
“vlak” heeft en wat laag afkap tot ongeveer
50 Hertz heeft de 4-SJ een filter knop met
“weighting” presets van A,B,C & D weging.

Dus in 1967 maakte AVRO’s Televizier een
achtergrond reportage over geluidsoverlast
van Schiphol en in 1972 is de industrie
samen met de wetenschap zover dat ze
een recorder hebben die bij de opname al
de dB(A) weging kan toepassen en
daarmee het hele LFg, Laag Frequent
geluid gebied gewoon als “niet bestaand”
uit kon zetten.
Is dat even handig voor de economie zeg!

(LIN is vlak, H.P. is High Pass)

                                  Foto; reverb.com
narcistenbuster.nl                                                                             2/4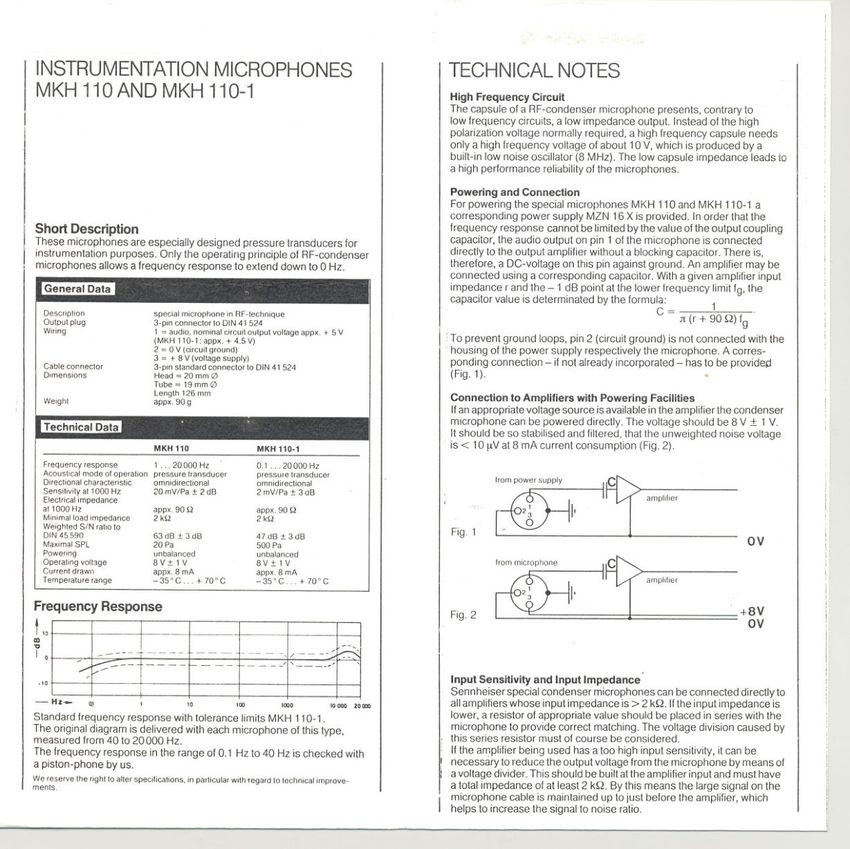
20 juni 2021

Nu is het zo dat voor High Fidelity (muziek, zang, stemmen) de Nagra’s 4-2 & 4-S vlak (lineair)
opnemen maar deze Nagra-SJ heeft specifieke aanpassing voor exacte meting toepassingen en
aardig is dan weer dat een gedeelte van wat de mens gewoon ook horen kan, met de dB(A) filter
setting in de opname niet meer aanwezig is, die A weighting filter setting overeenkomstig als de
potlood streep te zien is in de bij ons op 31 januari 2019 gemaakte metingen.
Dat is dus gewoon het weglaten van het lage tonen deel waar de overlast over gaat en wat
mensen over het algemeen wel degelijk kunnen horen, speelfilms zitten vol met laag frequent /
bas muziek om de spanning in het onderbuikgevoel te benadrukken.

De wereldwijd toegepaste dB(A) weging is een corrupt bedenksel op basis van vastgesteld
gemiddeld KARAKTER van het menselijk gehoor welke tegelijkertijd individueel bepaald is en
onderling heel verschillend kan zijn en is.
Van dat “Karakter” vastgesteld in1936 heeft de wetenschap “de drempel van horen” gemaakt en
dat is nonsens, waarmee geschreven is dat de basis onder al die rekenmodellen is gebaseerd op
een gotspe, een gewaagde brutaliteit voor welke nu het doek valt. Het is net als de Urgenda
rekenmodule van Jan Rotmans, ook afkomstig van het Ministerie van Economische Zaken.

Het is allemaal zo “corrupt” omdat het bepaald wordt voor en door de wereld economie.
Heeft u nog vertrouwen en de werkelijke doelstellingen van het WEF, the World Economic Forum.

Vandaar ook dat ze net als de naar eer en geweten sprekende Premier Mark Rutte maar roepen
“hoe ingewikkeld het is” terwijl de logische doe-het-zelf-denk-waarheid héél simpel is.
De enige juiste weeg methode is gewoon eerlijke vlakke meting en dat paralel laten lopen met
testen van de “onlinetonegenerator” met goede koptelefoon, dan heb je het eerlijk resultaat.
En in geval van de UGS-Norg test dien je minimaal drie tone generatoren simultaan te laten
beluisteren, erger nog, eigenlijk minimaal negen stuks simultaan naast elkaar.

Bij de test hier thuis in januari 2019 werd de online toon test gestaakt toen mijn vriendin bij 35
Hertz de toon nog prima bleek te kunnen horen.
Wij horen ieder tot rond de 8 Hertz en de mate hoe hard wij die horen hangt af van de DRUK. De
lage moeilijker hoorbare bas geluiden worden op dat niveau “Staande Hertz Druk Golven”.

Ik voeg wat naslagwerk toe aan deze geschreven akoestische-appendix, ik lijk wel een
wetenschappelijke oplichter want een akoestische-appendix kan nooit geschreven zijn want dan
“hoor” je niets en mis je de geluidsdruk geheel, zó werken de NAG, NSG, GGD etcetera.

De boodschap is heel simpel, de wetenschap belazerd het volk ten bate van de economie met
een enorme basis leugen over de lage bas geluiden (LFg) en met name de druk vibraties op het
lichaam. De schade die druk vibraties geven veroorzaken de Vibro Akoestische Ziekte.

GGD en medische wetenschap falen inzake onderzoek naar de VAZ doelbewust volledig.

De hele tijdspanne van de Laag Frequent overlast van toen, medio 1967 vliegtuigen, daarna
installaties van de NAM en heden buiten-warmtepompen en windturbines is een bewuste
conspiracy vanaf medio begin 1970 ten bate van economische doelen voor de adel en
aandeelhouders. Dat is ruim 50 jaar van een conspiracy uitrollen met voorbedachte rade.

Nou, bij wie nog steeds roept “samenzwering-denken” is wellicht een schroefje losgetrild in de
hersenpan, wellicht door langdurige blootstelling aan voor hen amper hoorbare staande laag
frequente hertz drukvibraties, denk dáár maar eens over na…

We zijn samen met de wetenschappers belazerd door de Rijksoverheid middels hun
manipulatieve-geestes-wetenschap omwille van hun eigen geldelijke belangen en
de economie voor de aandeelhouder —> geld —> de mammon.

narcistenbuster.nl                                                                               3/4
20 juni 2021

Heden is de Nagra-Kudelski groep innige vriendjes met het WEF van Klaus Schwab.
De zoon van de maker van de eerste Nagra recorders is André Kudelski en die kreeg in 1995
reeds door Klaus Schwab de World Citizen prijs uitgereikt (Rutte pas in 2019).
De Nagra-Kudelski group doet tegenwoordig samen met heel veel landen aan “cyber security”,
oftewel aan “internet criminaliteit bestrijding”.

Betrouwbaarheid zie je aan iemands daden en niet aan iemands wollig stofwolk geleuter.
Waarom heeft de Nagra-Kudelski-Group in 1971, toen zij de instrumantation machine gingen
ontwikkelen, niet bij de akoestische wetenschappers aan de bel getrokken omdat zij net als
Bruel & Kjær toen al geweten moéten hebben dat die dB(A) curve niet deugd.
En weet je, als je het over narcisme en psychopathie hebt, dien je alles “terug om te keren”
en dan kan het met de mond belijden dat je doet aan “bestrijden” ook exact het omgekeerde
betekenen, het “alles is omgekeerd” principe achter de narcist en aldus kan zo’n group de
manipulatie ook zelf toepassen inclusief zelf het internet manipuleren om de Nieuwe Economische
Wereldorde in het zadel te helpen door angsten te genereren bij hen die het niet door hebben.
Vergeet niet naar de lijst “partners” van het WEF te kijken, staan op hun website, daar zitten ook
alle menselijke DNA manipulerende covid-vaccin makers bij in.

Denkt u nu echt dat zij die de wereld hebben vermaakt tot de puinhoop die de aarde nu is, de
economisten, zelf ook simultaan plotseling de herstellers kunnen zijn.
Wat ik op basis van alle eerstelijns verhalen die ik heb vastgelegd van 40/45 slachtoffers en 46/49
slachtoffers heb geconstateerd is dat de bezetter (machthebber) de onderdrukte (gevangene) zelf
hun eigen vernietiging laat uitvoeren op basis van een uitgerold strategisch plan.
Dat gaat al eeuwen zo.
Journalisten en politici die roepen dat iets een conspiracy is kun je per definitie niet vertrouwen
want zoals de wereld is, is die geworden door een opeenstapeling van conspiracy’s die altijd om
de macht draaien.

Een troost, als het zover is dat de Nieuwe Wereld Orde openlijk de macht neemt gaan al die
machthebbers vervolgens elkaar afmaken, want zó werkt de geest van de psychopaat,
“ze vernietigen” omdat iedere rede in hun ziel ontbreekt omdat bovenmatig narcisme en
psychopathie een persoonlijkheidsstoornis betreft.
Vandaar ook dat de gewone burger wordt opgeleid een digitale-onzijdige-mens te worden met
een blind vertrouwen op beeldschermpjes, een burger waarin de eigen rede ook meer en meer
ontbreekt, ook dat is een bewust opgezet doel.

In de zestiger jaren deed ik als tiener al “geluid” voor televisie met mijn
vader aan de Arriflex-BL film camera. Ik werkte in die jaren al met een
Nagra om mijn nek en de Sennheiser MKH-404 microfoon.
Het mag eens afgelopen zijn met het verneuken van medeburgers.

Liefde met balans tussen narcisme en empathie is de énige oplossing.

                                                      Foto; networth

Robbert Huijskens                             Lianda van Velzen

Lindelaan 18
9342 PL Een

De bijlagen zeggen alles over de waarheid wat “geluid” is. LFg separeren is nonsens want LFg
maakt onderdeel uit van het gewone dagelijkse geluid en waar minder goed hoorbaar ziek
makende Staande Bas Hertz Druk Golven.

narcistenbuster.nl                                                                              4/4
INSTRUCTION MANUAL

                               o                  code no. 20.01.004.151

                                      MEASUREMENTS                              chapter 1

                                      SPECIFICATIONS                            chapter 2

                                      DIRECTIONS FOR USE                        chapter 3

                                      BATTERIES AND
                                      ACCUMULATORS                              chapter 4

                                      ACC ESSO RI ES                            chapter 5

                  KUDELSKI SA         Printed in Switzerland by KUD ELSKI S.A.
NAGRA Tape Recorders Manufacture
    CH-1033 Cheseaux/Lausanne         Edition August 1985
                     Switzerland
              Tel (021) 91 21 21
           Telex 459 302 nagr ch

                                       NAGRA, KUDELSKI, NEOPI LOT, NEOPI LOTTON,
                                                NAGRASTATIC, NAGRAFAX,
                                          sont des marques enregistrees, proprit'!te de
                                                      KUDE LSKI S. A.
                                               fabrique d'enregistreurs NAGRA.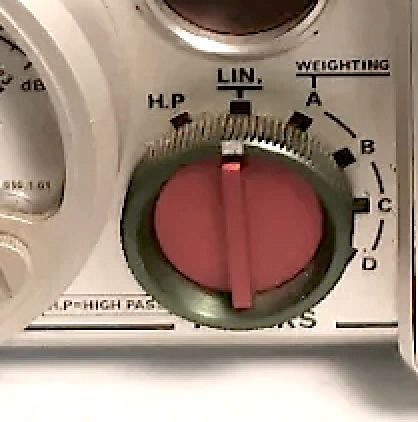
25        24         21           35 20             31          34       32       33

          23        26         27 28   29       30            22

18   1719                               107 70            8 6 60       9           4

            16 15    14        13   11 12            5

                                            1   TAPE/DI RECT, LINE & PHONES: switching ofthe play-
                                                back signal or of the direct signal on the line outputs,
                                                headphones and loudspeaker; switch inactive on TEST
                                            2   TAPE/DIRECT, METER: switching of the playback
                                                signal or of the direct signal on the circuit of meter 14;
                                                this switch cannot be locked on TAPE

                                            3   POWER: power selector switch i.e. built-in batteries or
                                                accumulators or external power supply connected to
                                                plug 48
4    Main function switch                                           13 FI LTERS: filter selector switch for channel 2, identical
     STOP: recorder at a standstill                                    to 11
     TEST: power supplied to all circuits, except record and
                                                                    14 Meter: indicates sound level and checking functions ac-
     erase
     RECORD: power supplied to all circuits and the motor;             cording to the position of selector switch 12
     record and erase on the 3 tracks                               15 PI LOT: indicator which shows a white zone when
     PLAYBACK: the recorded signal can be heard on the                 frequency and amplitude of the pilot signal are correct
     headphones and is fed to the line outputs of connectors
     41, 42, 43, 45 and 46 when switch 1 is on TAPE (or on          16 SPEED & POWER: indicator which shows a white zone
     01 RECT if the output signal is reintroduced into the             when the following three conditions are fulfilled:
     direct chain, see 42)                                               power supply voltage higher than the maximum admis-
     PLAYBACK with Loudspeaker: playback of tape using                   sible value
     loudspeaker                                                         motor regulation within the correct operating range
                                                                         tachometric speed fluctuations not exceeding the
5    LIGHT: meter 14 lights up momentarily; remains illu-                maximum value
     minated when the button is turned to the right
                                                                    17 PHONES: connector for mono headphones, impedance
6    Main attenuator CHANNEL 2: in steps of 10 dB for                  25 to 600[2
     channel 2, lower track
                                                                    18 CHANNE L, PHONE & L.S.: channel selector for listening
6a   Vernier attenuator CHANNEL 2: in steps of 1 dB for                with headphones and loudspeaker
     channel 2
                                                                    19 LEVE L, PHON ES: adjustment of the headphones volume
7    Main attenuator CHANNEL 1: in steps of 10 dB for
     channel 1, upper track                                         20 Tape speed selector s.witch
                                                                          15 ips = 38.1 cm/s          3 3/4 ips = 9.525 cm/s
7a   Vernier attenuator CHANNEL 1: in steps of 1 dB for                7 1/2 ips = 19.05 cm/s         1 1/2 ips = 3.81 cm/s
     channel 1
     NOTE: dB scale: for the microphone inputs, in rela-            21   BIAS: 5-position bias selector switch
     tion to the sound pressure level 0.0002 J.Lbar = 0 dB          22 Pinch-wheel
     Voltage scale: effective voltage applied to the line output,
     which gives a reading of 0 dB on the RMS scale of meter        23 Fast wind switch:
     14
                                                                                           rewind with main switch 4 any po-
8    REF. OSCILLATOR: switched on when the button is                          REW·444      sition except STOP, lever 32 in
     depressed, the reference oscillator supplies a +10 dB                                 disengage position
     signal to the direct amplifier on each channel, after the
                                                                                            fast wind when main switch 4 on
     attenuator
                                                                                            PLAYBACK with Loudspeaker
9    L1NE/MI KE: line or microphone input selector, channel 2
10 L1NE/MI KE: line or microphone input selector, channel 1         24 Supply reel

11   FI LTERS: 6-position filter selector switch for channel 1      25 Tension roller of the supply reel
       HP                        = high-pass                        26 Erase head
       LIN.                      = linear
      WEIGHTING A,B,C,D          = weighting curves A,B,C,D         27 Stabilizer roller with 50 or 60 Hz stroboscope
                                                                    28 Recording head track 1 and 2
12 METER FUNCTION: six-position selector switch for
   meter 14                                                         29 Recording and playback head track 3
   LEVEL, RMS FAST: on the decibel scale, RMS value                 30 Playback head tracks 1 and 2
   of the sound level, fast characteristic, red needle for
   channel 1, green needle for channel 2                            31 Capstan
   LEVEL, RMS SLOW: the same as RMS FAST, but slow                  32 3-position lever controlling the pinch-wheel and tape
   characteristic                                                      guides:
   LEVEL, PEAK: on the PEAK decibel scale, peak value                     lever pulled to the left: for threading the tape (rewind
   of the sound level, channels as above                                  possible in this position)
   BATT: onthe BATTERIESscale, battery or accumulator                     lever at 45° tb the edge of the tape-deck: motor
   check, reed needle: battery voltage per cell (VOLTS/                   running, but tape not moving
   CELL), green needle: voltage required by the motor, with               lever pushed backwards: tape running
   the same reduction factor as battery voltage
   PI LOT & CUE: green needle: on the Pilot 0 to 100% scale,        33 Tension roller of the take-up reel
   overall frequency deviation caused by the pilot and CUE          34 Take-up reel
   signals, 100% on the scale corresponding to a deviation
   of ± 40% , red needle: on the PI LOT +4 to -4% scale,            35 RECORDING EQUALIZATION ADJUSTEMENT
   frequency shift, as determined by the built-in OFMS
   frequency meter, between a signal recorded or played
   back on the third track and an internal reference
   Position M: green needle: same as PILOT & CUE, red
   needle: on the 0 to 100% scale, current through the
   motor, 100%on the scale corresponding to 250 mA
36 MICROPHONE CHANNEL 2: channel 2 microphone                    44   PILOT: pilot signal input for the 3rd track
   input
                       1   200V voltage available with built-
                       2   120V in microphone power supply
                                                                                            ground
                       3    supply voltage, varies according
                                                                                            Clapper: reference oscillator or
                           to the type of amplifier
                                                                                            crystal  pilot generator control
                       4    -lOG: -10V stabilized voltage,             EXTERNAL VIEW        terminal
                           maximum current 350 mA                      OF C HAS SIS
                                                                       CONNECTOR OR     3   Xtal: 50 or 60 Hz internal crystal
                       5   chassis                                     PLUG FROM THE
                                                                                            pilot generator output
                       6   preamplifier supply voltage                 SOLOERING SIDE
                                                                                        4   PI LOT I N: pilot signal input
     EXTERNAL VIEW     7   signal input
     OF C HAS SIS
     CONNECTOR OR      8   signal input ground                   45   LINE OUTPUT 2: channel 2 line output on banana jacks
     PLUG FROM THE
     SOLDERING SIDE

                                                                 46   LINE OUTPUT 1: channell line output on banana jacks
37   MICROPHONE CHANNEL 1: channel 1 microphone
     input connector, identical to 36
                                                                 47   CUE: connector fo     recording and playback on the third
                                                                      track
38   Gain selector for channel 2 microphone amplifier, 3 posi-                      1       CUE IN: modulation signal input
     tions, +40, +60 and +80 dB                                                     2       -lOG: -10V stabilized voltage
                                                                                    3       PI LOT OUT: pilot signal output
                                                                                    4       -10V: stabilized voltage available
39   Gain selector for channel 1 microphone amplifier,                                      only during recording
     identical to 38                                                                    5   -10V FM: voltage terminal to
                                                                                            activate the FM modulator
                                                                      EXTERNAL VIEW
                                                                      OF  C HAS SIS     6   CUE OUT: signal output (direct or
                                                                      CONNECTOR OR
40   MICROPHONE TYPES: B & K cartridge type selector                  PLUG FROM THE         recorded)
                                                                      SOLDERING SlOE
                                                                                        7   ground

41   CHANNEL 2: channel 2 multiple connector
                                                                 48   POWER PACK: connector for external power supply
                           VAR.    LEVEL I N: line input                             1 -BATT.: negative pole of the bat-
                           impedance 100kr2, input voltage                             tery box
                           > 1 mV                                                    2 +BATT.: positive pole of the bat-
                       2   -10 G: stabilized voltage -10V                              tery box and ground
                       4   Playback output: output voltage                           3 STOP: motor stop control terminal
                           10 mV at 0 dB, load> 47 kr2                                 (connect to -10V to stop)
                       7    ground                                                   4 SPEED   CORRECTION: tape speed
                                                                      EXTERNAL VIEW

      EXTERNAL VIEW
                                                                      OF  C HAS SIS    correction signal input
                                                                      CONNECTOR OR
      OF  C HAS SIS                                                   PLUG FROM THE  5 EXTERNAL -12V to -30V: 12 to
      CONNECTOR OR                                                    SOLDERING SIDE
      PLUG FROM THE                                                                    30V external power input, negative
      SOLDERING SlOE
                                                                                       pole
                                                                                     6 -lOG: -10V stabilized voltage
42 CHANNEL 1: channell connector, identical to 41,
   shown with strap plug to reintroduce the playback signal
   into the direct chain (switch 10 must be on LINE)

43 OUTPUTS: line output connector
                    1  LINE OUT 2: line output, channel
                      2, output voltage 100 mV at 0 dB
                      in a load greater than 10 kr2
                    2 -lOG: stabilized output voltage
                      -10V
                    3  LI NE OUT 1: line output channell,
                      output voltage 100 mV at 10 dB in
                      a load greater than 10 kr2
                    4 unstabilized negative supply voltage
    EoIITERNAL VIEW
    OF C HAS SIS    5 -lOR: stabilized voltage -10V
    CONNECTOR OR
    PLUG FROM THE
                      available only during recording
    SOLDERING SIDE  6 STOP: motor stop control terminal
                      (connect to -1 OV to stop)
                    7 ground
INSTRUCTION MANUAL
I Measurements
Direct analysis of sound signals the CE I standard 179 for precIsion sound level
Used solely as an amplifier the NAG RA IV-SJ is a meters. Naturally, any signal which is shorter than
precision sound level meter, which operates with the integration time will be shown below its real
any calibrated microphone cartridge. The sound value. For analysis of pulse signals or strong
pressure measurements must be taken in relation to transients a more useful reading is obtained on
the 0 dB reference level, which corresponds to a PEAK, i.e. peak value with an integration time of
pressure of 0.0002 Ilbar, i.e. 201lN/m 2 or 20 IlPa. only 5 ms. This very fast reading cannot be used
This level coincides in practice with the audibility' because it causes visual fatigue: in order to over-
threshold of the human ear at 1 kHz; at this fre- come this disadvantage the measuring circuit holds
quency, the sound level can be expressed in phones, the signal for about one second, thereby increasing
the phones value being equal to the dB value read the fall time of the needle.
in relation to the 0.0002 Ilbar reference.
The frequency response of the human ear is not
linear and depends very much on the sound level; a
sound level meter must therefore include weighting
filters which modify the values measured in accor- Recording and playback of the sound signals
dance with certain criteria, so that they can be In all cases where direct measurement is not
interpreted in relation to the subjective impression sufficient for studying the signals picked up by the
felt by the human ear. There are three standard microphone, these signals can be recorded on mag-
weighting curves, A, Band C. Curve A is used for netic tape and analyzed later in the laboratory.
low and medium sound levels, which are the sub- While the two tracks used for direct recording are
ject of most analyses; curves Band C relate to in use, the third track can record FM signals for
higher levels. Curve D relates to contour-lines of· synchronization, a commentary, or a measuring'-
perceived noisiness, in particular with noise pro- signal from D.C. up to 4 kHz. The three tracks
duced by aviation: this weighting is used for the thus store signals in fully-synchronized form, which
measurement of sounds which cause annoyance is an important factor for analysis.
in general. Curves A, B, C and D are shown after
However, this storage is restricted to some extent
the specifications.
due to the limitations of present magnetic tapes.
The sound level measured is shown on a dual These limitations concern the following charac-
galvanometer, with one needle per channel. Its teristics in particular:
measuring circuit determines the average value of the response cu rve
the signal on RMS and its peak value on Attenuation at the upper and lower extremes of
PEAK, with different dynamic characteristics in the spectrum depends on the speed used. Very low
relation to the integration time. On RMS frequency signals, which are difficult to play back
FAST integration time is 200 ms: a signal at 1 kHz with a small reproduce head, should be analyzed
lasting 200 ms gives a reading 1 dB lower than that by frequency transposition.
which would correspond to the steady signal. On distortion
RMS SLOW, integration time is 500 ms and This increases very rapidly as soon as the maximum
a signal lasting 500 ms gives a reading 4 dB below recording level is exceeded, and tape saturation
that which would correspond to the steady signal. occurs, generating harmonic frequencies (in par-
ticular 2nd and 3rd harmonics), which falsify the
These two integration times are in accordance with analysis of the signals.crosstalk The juxtaposition of the two channels inside the recording head and the playback head produces crosstalk. This is the ratio, at a playback amplifier output, between the wanted signal and the unwan- ted signal from the other channel. Crosstalk increases at high frequencies. The maximum peak level, which corresponds to a tape flux of 32 mM/mm, is reached when the measuring instrument shows +10 dB on the RMS scale and +20 dB on the PEAK scale. These two values are given in relation to the sound -pressure reference level 0 dB = 20 ,uPa or 0.0002,ubar. On RMS the integration time of the measuring circuit is long enough not to indicate short pulses at their exact value and risk exceeding the maximum recording level, thereby saturating the tape. That is why, on RMS , the maxi- mum level is given at +10dB: the 10dB lead avoids the signals with strong pulse content saturating the tape too quickly. In all cases where the nature of a signal is not obvious. it should be recorded with the measuring circuit on PEAK, which is the only way to make the peak value of very short pulses visible and to avoid their exceeding the maximum recording level. Frequency transposition Playback speed may be different from recording speed: this produces a frequency transposition of the signals recorded within the ratio of these two speeds. Since the response curve in the low fre- quencies is limited to 25 Hz on playback only, it is possible, if the tape transport speed is ten times faster on playback than on recording, to play back frequencies which are ten ti mes lower. Thus, a 2.5 Hz signal recorded at 1.5 ips will have a fre- quency of 25 Hz if it is played back at 15 ips (transposition 1: 10), and can be analyzed easily by conventional equipment. In the same way, the time needed to analyze signals which vary very slowly is reduced in the same ratio by this process. Conversely, it is possible to analyze in more detail a signal which varies rapidly by playing it back more slowly than it was recorded. However, in both cases, care must be taken that the transposi- tion does not alter the signals in any way, taking into account the limitations of the frequency res- ponse at the speeds used.
INSTRUCTION MANUAL

                                                      2                         Specifications

DIMENSIONS AND WEIGHT                                     MAGNETIC TAPE
Dimensions of the box as such with the lid closed,        Nominal width                           1/4 " -   6.25 mm
without knobs, feet, handle or handle mounts              Admissible thickness    0.5 to 2 mils - 12 to 50jlm
         12.6 x 8.8 x 4.4" - 318 x 222 x 110 mm
                                                          Maximum reel diameter with lid open
Overall dimensions without the removable handle                                                     7" -178mm
          13.2 x 9.6 x 4.5" - 333 x 242 x 113 mm
                                                          Recording time at 7 1/ 2 ipswith35jlm (1.5 mils)tape
Thickness of the Anticorodal sheet used for the box                                                   45 min .
                                     .080" - 2 mm
                                                          Maximum reel diameter with lid closed
Thickness of the tape deck          .120" - 3 mm                                              5" - 127 mm
Empty weight, without batteries or tape                   Recording time under the same conditions
                                 14 Ibs - 6.150 kg                                                           22 min.
Weight with ordinary batteries, 5" reels and tape         Rewind time with 5" reel and 35 /-lm (1.5 mils)
                                 161bs - 7.300 kg         tape                                     2 min.

                                                          TAPE TRANSPORT
                                                          Switchable nominal speeds:
                                                                  15      ips     38.1     cm/s
POWER SUPPL Y                                                     7 1/2   ips     19.05    cm/s
Supply voltage, direct current, positive to the                   3%      ips      9.525   cm/s
ground                                12 to 30 V                  1 112   ips      3.81    cm/s
Current consumption                                       Stability of the nominal speed in relation to the
  on Test                                  120mA          temperature (from 0° to 50° C), the position of
  on Line Playback                         205mA          the recorder, the distribution of the tape between
  on Record        direct                  260mA          the reels, and the supply voltage (except for 1 1/2
                   mic. (1 BK 2619)        465mA          ips).                                         ±0.1%
  on Rapid Rewind                          305mA          Wow and flutter
Type of batteries used (12 cells)                           weighted peak-to-peak value, in accordance with
  CE I standard                               R 20          DIN 45 507 standard: (lEE 193-1972 1 ANSIS
  ASA standard                          D and L 90          4.03.1972)
Approximate autonomy with Eveready E95 man-                       15 ips                      ±0.05%         (0.07%)
ganese dioxide alcaline batteries                                 7 1/2 ips                   ±0.07%         (0.11%)
                                                                  3314 ips                    ±0.12%         (0.15%)
   Continuous use, recording
                                                                  1 1/2 ips                   ±0.25%         (0.3%)
   direct                                 26 hours
   with mic. and 2619 preamp.                hours        Starting time                                     3 seconds
DIRECT RECORDING TRACKS Record and Playback
Amplifier chain (without microphone amplifiers) Nominal recording level, identical to Maximum
Peak Level (M.P. L.) = 320 nWb/m for NAB
Input impedance 100 kS1 405 nWb/m for CCIR
Overall accuracy of the attenuator ±0.1 dB (±0.2 dB) Bias frequency 150 kHz
Frequency response Bias switchable per 10% increments
from 2.5 Hz to 35 kHz ±0.3 dB (±0.5 dB)
Input voltage for recording at Maximum Peak for NAB 3M 177
Level, maximum sensitivity 10 mV RMS Tape used for testing for CCI R LPR 35 LH
Maximum admissible level for 1% distortion refer- Erase efficiency referred to M.P.L. 82 dB (80 dB)
red to MPL +8.5 dB (+8 dB)
Signal-to-noise ratio Frequency response, recording at 20dB below M.P.L.
linear 66 dB (62 dB) 15 ips 25 Hz to 35 kHz
ASA A weighted 74 dB (70 dB) ± 1 dB (2 dB)
7 1/2 ips 25 Hz to 20 kHz
Crosstalk attenuation at 1 kHz 80dB (74dB)
33/4 ips 25 Hz to 10 kHz
Weighting curve accurac'{ better than CE I 179 and ± 1.5 dB (3 dB)
CEI 537 (for exact curve see diagrams) *1 1/2 ips 25 Hz to 3.5 kHz
*recording possible from 2.5 Hz with translation to
High pass filter
15 ips in playback
attenuation - 3 dB at 20 Hz, 12 dB per octave
Third harmonic distortion at M.P. L. 1% (2%)
Signal-to-noise ratio
Linear ASA A
dB dB
15 ips - 38 cm/s NAB 58 (53) 63 (60)
CCIR 58 (55) 66 (63)
7 1/2 ips - 19 cm/s NAB 60 (56) 64 (62)
CCIR 57 (55) 63 (60)
Crosstalk attenuation
at 1 kHz (60 dB)
METER at 10kHz (50 dB)
PEAK indication Phase shift between tracks
semi-logarithmic scale, usable from -10 to at 71/2 ips (19cm/s) and 10 kHz ±15° (±20 o )
+23dB
frequency response
from 30 Hz to 35 kHz ±0.5 dB (1 dB) Outputs
integration time for 2 dB Output voltage at M.P.L. on 10 kS1 1V
below reference deviation 5 ms ±20 % Output voltage for 1 % distorsion at 1 kHz (2.5 V)
RMS (sonometer) indication Output voltage for 200 S1 headphones,
normalised scale, usable from -10 to +12dB adjustable o to 1 V
frequency response Built-in loudspeaker,
from 10Hz to 35 kHz ±0.5 dB (1 dB) power output of amplifier 1W
Reference signal level
from 20 Hz to 20 kHz ±0.2 dB (0.5 dB) RMS +10 dB ±0.2 dB
FAST integration time,
200 ms for 1 dB
below reference deviation ±0.5 dB (1 dB)
SLOW integration time,
500 ms for 4 dB
below reference deviation ±0.5 dB ( 1 dB) FM TRACK
Operating speeds, 15 and 7 1/2 ips - 38 and 19 cm/s
Reading accuracy below 0 dB (±0.5 dB)
Input and Ouptput centered at OVDC
above 0 dB (±0.2 dB)
Carrier freqency 17 kHz
Peak factor >5 Static linearity ±0.4% (±1%)Maximum frequency deviation .6.fo ±45% (40)
Frequency response
at -3 dB o to 4 kHz (0 to 3.5 kHz)
Signal-to-noise ratio for
a ±20% deviation 44 dB (40 dB)
Peak-to-peak input voltage for a ±40% deviation
PILOT ± 2.8V ± 0.5 dB
CUE ± 2 V ± 0.5 dB
OPERATING CONDITIONS
Temperature
0
with manganese batteries - 4 to +160 F
0
-20 to + 71 C
0
with external power -67 to +160 F
-55 to + 71 0 C
The recorder functions correctly in any position.
All values given are typical; exact values for each machine are given on its final measurement protocol sheet.W eiflht" curve A
dB Frequency lEe Recommendation 179 NAGRA IV·SJ
Relative Tolerance Tolerance
Response Limits Limits
+10 Hz dB dB dB
20 -50.5 ±5 ±3
o
./
- - .........
I"-....
25
31.5
40
50
-44.7
-39.4
-34.6
-30.2
±5
±3
±3
±3
±2.5
±2
±2
±2
/'
'"
63 -26.2 ±3 ±2
80 -22.5 ±2 ±1.5
-10 100 -19.1 ±1 ±1
/ 125
160
-16.1
-13.4
±1
±1
±1
±1
-20
V 200
250
-10.9
- B.6
±1
±1
±1
±1
/ 315 - 6.6 ±1 ±1
/ 400 - 4.8 ±1 ±1
-30 V 500
630
- 3.2
- 1.9
±1
±1
±1
±1
/
800 - 0.8 ±1 ±1
1000 0 ±1 ±1
1250 + 0.6 ±1 ±1
/ 1600 + 1 ±1 ±1
±1
-40 2000 + 1.2 ±1
/ 2500
3150
+ 1.3
+ 1.2
±1
±1
±1
±1
/ 4000 + 1 ±1 ±1
5000 + 0.5 ±1.5 ±1
-50 6300 - 0.1 +1.5 -2 ±1
I
/ 8000
10 000
- 1.1
- 2.5
+1.5
+2
-3
-4
±1.5
±1.5
12500 - 4.3 +3 -6 ±1.5
16000 - 6.6 +3 !1.5
20000 - 9.3 +3 ±2
Hz
80 200 500 1000 3150 8000 12500
20 31,5 50 100 315 800 1200 5000 10000 20000
r-;::====Welflht"In2 curve B
dB Frequency I EC Recommendation 179 NAGRA IV·SJ
Relative Tolerance Tolerance
Response Limits Limits
Hz dB dB dB
+10
20 -24.2 ±5 ±2
o 25 -20.4 ±5 ±2
r--.. . . . 31.5
40
-17.1
-14.2
±3
±3
±2
±2
,/' 50 -11.6 ±3 ±2
/"
"'"
63 - 9.3 ±3 ±2
-10 80 7.4 ±2 ±1.S
/ 100
125
- 5.6
4.2
±1
±1
±1
±1
-20 / 160
200
- 3
2
±1
±1
±1
±1
/ 250
315
- 1.3
0.8
±1
±1
±1
±1
-30
/ ,
400
500
630
- 0.5
0.3
- 0.1
±,
±1
±1
±1
±1
±1
800 ±1 ±1
1000 ±1 ±1
1 250 ±1 ±1
-40 1600 0 ±1
±1
±1
±1
2000 0.1
2500 0.2 ±1 ±1
3 150 - 0.4 ±1 ±1
4000 0.7 ±1 ±1
-50 5000 - 1.2 ±1.5 ±1
6300 1.9 +1.5 -2 ±1
8000 2.9 +1.5 -3 ±1.5
10 000 4.4 +2 -4 ±1.5
12500 6.1 +3 -6 ±1.5
16000 8.4 +3 ±1.5
Hz 20000 -11.1 +3 ±2
80 200 500 1000 3150 8000 12500
20 31,5 50 100 315 800 1200 5000 10000 20000Wei21htin2 curve c
dB Frequency lEe Recommendation 179
Relative Tolerance
NAGRA IV·SJ
Tolerance
Response Limits Limits
Hz dB dB dB
+10
20 - 6.2 ±5 ±1.5
0
./
.--- I-"
- --..... I"--..
25
31.5
40
50
- 4.4
- 3
- 2
- 1.3
±5
!3
!3
±3
!1
!1
±1
±1
/' 63 - O.B ±3 ±1
-10 80 - 0.5 ±2 ±1
100 - 0.3 !1 !1
125 - 0.2 ±1 ±1
160 - 0.1 ±1 ±1
±1
-20 200
250
0
0
±1
±1 ±1
315 0 !1 ±1
400 0 !1 ±1
500 0 ±1 ±1
-30 630 0 ±1 ±1
800 0 ±1 ±1
1000 0 ±1 !1
1 250 0 !1 !1
-40 1600 - 0.1 ±1
±1
±1
±1
2000 - 0.2
2500 - 0.3 ±1 !1
3 150 - 0.5 ±1 ±1
4000 - 0.8 ±1 ±1
-50 5000 - 1.3 ±1.5 ±1
6300 - 2 +1.5 -2 ±1
8000 - 3 +1.5 -3 ±1.5
10 000 - 4.3 +2 -4 ±1.5
12500 - 6.2 +3 -6 ±1.5
16000 - 8.5 +3 !1.5
Hz 20000 -11.2 +3 ±2
80 200 500 1000 3150 8000 12500
20 31,5 50 100 315 800 1200 5000 10000 20000
Wei21ht+In2 curve D
dB
Frequency IEC Recommandalion 537
+10 -- Relative
Response
Tolerance
Limits (same as for IV- SJ)
""
" ",
Hz dB dB
/' 20 -20.6
/
± 3.0
25 -18.7 ± 2.0
o 31.5 -16.7 ± 1.5
..--"""" 40 -14.7 ± 1.5
'"
/" 50 -12.8 ± 1.5
V
/" \ 63
80
-10.9
- 9.0
±
±
1.5
1.5
-10
./
/' 100
125
- 7.2
- 5.5
±
±
1
1
160 - 4.0 ± 1
V
-20 /' 200
250
- 26
- 1.6
±
±
1
1
315 - 0.8 ± 1
400 - 0.4 ± 1
500 - 0.3 ± 1
630 - 0.5 ± 1
-30
800 - 0.6 ± 1
1000 0.0 ± 1
1250 2.0 ± 1
1600 4.9 ± 1
-40 2 000 7.9 ± I
2500 10.4 ± 1
3150 11.6 ± 1
4 000 11.1 ± 1
-50 5000 9.6 ± 1.5
6300 7.6 +1.5 -2.0
8000 5.5 + 1.5 -3.0
10 000 3.4 +2.0 -4.0
12500 1.4 +3.0 -6.0
16 000 - 0.7 +3.0
Hz 20000 - 2.7 +3.0
80 200 500 1000 3150 8000 12500
20 31,5 50 100 315 800 1200 5000 10000 20000.INSTRUCTION MANUAL
Directions for use
1. BASIC EQUIPMENT
1.1. Installation of Batteries or Accumulators 1.4. To Check the Power Supply:
Select the type of battery or accumulator accor- Turn METER FUNCTION switch 12 to BATT.
ding to the expected working conditions for the and main selector switch 4 to TEST: the red needle
recorder (see Section 4j. Turn the recorder over so of meter 14 indicates on the lowest scale the un-
that it is resting on its lid; turn the screws marked stabilized battery voltage expressed for one cell:
A and remove the cover of the battery compart- the total voltage is therefore obtained by multiply-
ment. Insert the 12 cells in the position shown, ing the meter reading by 12. The pointer at 1.25 V
indicates the minimum voltage at which the man-
ganese dioxide batteries should be recharged so that
they are able to go through the discharge/charge
/,
u + +
cycle several dozen times (see Section 4). Turn
main selector switch 4 back to STOP.
2. CONNECTION OF SIGNAL SOURCES
Since the two direct recording channels are iden-
1r 1r tical, instructions are given for channel 1 only, but
o fjJA they are also valid for channel 2.
2.1. Connection of a High Level Line
0 \
The recorder can be connected to an appliance or a
0 measuring instrument, the output voltage of which
is equal to or higher than 1 mV RMS: input is direct
H H
on the main attenuator and input impedance is
100 kQ.
The lower the output impedance of the signal
source, the better the signal to noise ratio is.
then replace the cover and secure it by turning the The external signal source is connected to connec-
screws marked A. Set POWE R switch 3 on Batt. tor 42: the wiring of the corresponding plug is
shown in General View lion the inside cover.
1.2. Connection of an External D.C. Source Selector 10 will then be on LINE.
Connect the 12-30 V voltage source to the POWE R
2.2. Connection of a High Level Microphone or
PACK connector 48, with the negative pole to pin 5.
Transducer
Set POWE R switch 3 on External.
Input identical to 2.1., but using connector 37,
1.3. Connection of Mains Power Supply with selector 10 on MIKE. The wiring of the plug
Connect an ATN or ATN 2 mains is shown in General View II: only contacts 4, 5, 7
power supply to the POWER PACK connector 48. and 8 can be used; contact 3 supplies a -10- V
If necessary, check the position of the voltage selec- stabilized voltage which can feed an external pre-
tor. Set POWE R switch 3 on External. amplifier, if desired.2.3. Connection of the OJPA Preamplifier fitted
with a Bruel & Kjaer Microphone Cartridge
---.JI \\
MECH.ANICAL
ADAPTORS
B& K
CARTRIDGES
QSPB
--T---' -1
I QSJC0 I
-;:=======- ======:::/ I I
-L
I
C
L .l
I
I .
QSJA-SK
Bruel & Kjaer V2" 4133, 4134, 4149 and 4163
microphone cartridges screw directly onto the QJPA
preamplifier, and the preamplifier output plug fits
.c:1+-:
into microphone connector 37. Other cartridges
can be screwed on using a mechanical adapter, i.e.
-1 ": 4144,4145,4146 and 4161 type
:: :
- V4": 4135 and 4136 type
- Ih": 4138 type. A
The 25 m or 50 m. QCPA extension cable can be
inserted between the output plug of the QJPA pre-
amplifier and the microphone connector.
Set selector switch 10 on MI KE. The recorder must
be fitted with the QSJA-BK microphone amplifier B M2x6
and the QSJC universal power supply.
F
Installation of aSJA-BK Amplifier
Lock the lid of the recorder, turn screws 50 several
times and open the case to its full extent. Unscrew
the connector between the microphone input wiring
and the case interconnection board. Plug in and fix
this connector to the microphone amplifier and
secure the latter to the case interconnection board.
M3x8
Unscrew the level adapter board A. Carefully
position the metal ground strap B and slip it under
the ground comb C. The two switch spindles 0
should be passed through the corresponding holes
in the box, then the blocking rings E threaded on.
the spindle into the switches, press the Signals and Voltages
rings against the ground strap and tighten them. Chassis connector external side or plug soldering
Place the shield in position and fix it under the side.
ground comb and under a nut screwed onto one of
the two hinge fixing screws (this screw should be
longer - M3x8l. Reinstall the level adapter +200V------.
board A.
+ 120V--.. . . . ----=--SIGNAL
Installation of OSJC Power Supply
Plug in the power supply circuit and fix it with
screw G to the connector. Pass a M2x6 flat head "'--- +12,6 V
screw through from the inside of the battery box
and through the bracket of the metal box, and fix -10G-----1
with a nut.2.4. Connection of Bruel & Kjaer Amplifiers fitted
with Bruel & Kjaer Microphone Cartridges
B& K B& K
CARTRIDGE PREAMPLI FI ER
MECHANICAL
ADAPTOR
-,------l
OSJt @ I
I
--....1....
I
The following types of cartridges
2.5. Connection of Sennheiser MKH 110 Measuring
- Ih": 4133,4134,4149 and 4163
Microphone
- 1 ":4144,4145,4146and4161
- Y4": 4135 and 4136 The MKH 110 microphone consists of-a capacitor
- 1/8": 4 138 cartridge and an electronic circuit with a low impe-
can be fitted to the following types of preamplifiers: dance output; microphone sensitivity is 2 mV /i.Lbar.
It should be connected to microphone connector
- 1", Y2", Y4" : 2615
37 by the QCJ-MKH cable; selector 10 should be on
- Y2", Y4", Y8" : 2614
MIKE.
- 1",1/2",1/4",Y8" :2619
- 1" : 2627,2612 and 2613 The should be fitted with the QSJA-M KH
- 1,4", 1/8" : 2618 microphone amplifier, which also supplies the vol-
The cartridges can be fitted directly onto the pre" tage for the microphone.
amplifiers when the diameters match; if they do not Installation of QSJA-M KH Amplifier
match, a mechanical adapter can be used. The Lock the lid of the recorder, turn screws 50 several
output plug of the preamplifier screws into the ti mes and open the case to its fu II extent. Unscrew
QSJP adapter and the plug of the preamplifier the connector between the microphone input wiring
adapter fits into microphone connector 37: selector and the case interconnection board. Plug in and fix
10 should be on MI KE. this connector to the microphone amplifier and
The recorder should be fitted with the QSJA-BK secure the latter to the case interconnection board.
microphone amplifier and the QSJC universal power Unscrew the level adapter board. Place the shield
supply. These circuits can be installed as described in position and fix it under the ground comb and
in the precedi ng paragraph. under a nut screwed onto one of the two hinge
fixing screws (this screw should be longer - M3x8l.
Reinstall the level adapter board.
Signals and Voltages Signals and Voltages
Chassis connector external side or plug soldering Chassis connector external side or plug soldering
side side
+200V GND GND
+ 120V SIGNAL SIGNAL
r-
L_
+12,6 V -8V
-10G -10G2.6. Connection of General Radio 1560-P42
Preamplifier fitted with a Microphone
Cartridge
This preamplifier can be fitted with the same car-
tridges and mechanical adapters as the Bruel & Kiaer
2619 preamplifier. Its output plug fits into the
input connector of the QSJP-G R adapter; the out-
put connector of this adapter must be plugged into
microphone connector 37; selector 10 should be
on MIKE.
Preamplifier 1560-P42 can also be fitted with
GR 1" and G R V2" ceramic microphone cartridges.
When Bruel & Kjaer cartridges are being used the
recorder should be fitted with the QSJA-B K
amplifier and QSJC-power supply, version 2 only,
which should be modified to supply the +16 V
voltage required for the GENERAL RADIO pre-
amplifier.
Version 2 of the QSJC power supply differs from
version 1 (which can supply only +12 V) in the
value of certain components, e.g. resistances R24
and R25:
R24 R25
@
@
@
o
G
o o
@
@
R26 R27
Version 1: R24 = 33 kn, R25 = 27 kn potentiometer R83 of circuit A24 (TH I RD TRACK
no modification possible CI RCU ITS). If it is impossible to obtain the value
Version 2: R24 = 47 kn, R25 = 33 kn noted, replace resistance R82 of this circuit by a
modification possible 10 kn resistance and adjustable potentiometer R83
by a 2.2 kn model.
It is not possible to transform a version 1 circuit
into version 2, as the osci IIator coi I of the converter
is different in each case.
Before modifying a version 2 circuit, it is essential
to measure the negative voltage available at terminal Signals and Voltages
6 of connector CUE 47, in relation to the ground Chassis connector external side or plug soldering
(terminal 7) with no modulation. Bridge terminals side
5 and 2 and set main switch 4 on TEST; note the
value of the negative voltage at terminal 6 (see para-
graph 7.6 for the meaning of this value).
To obtain a .+16 V voltage, remove resistance R26
(180 kn), which is soldered to two pins; it is not -----=-SIGNAL
necessary to dismantle the circuit.
After this modification has been made, the voltage ------- + 16 V
available at terminal 6 of connector CUE 47 shoulQ
be adjusted to the value noted before the modifica- -10G--------J
tion was made; this can be done by adjusting3. DIRECT MEASUREMENT OF SIGNALS 3.4.3. Low-level Signals on the Microphone Input
3.1. Position of the Controls QSJA-BK AMPLIFIER
Set switch 1 on DIRECT: switch 2, which cannot With selector 1"0 on MIKE, set vernier attenuator
be locked in position, remains on DIRECT. Turn 7A on 0 dB.
main selector switch 4 to TEST: the circuits are
then switched on and will stabilize after about 10
Turn the cartridge type selector 40 to the position
seconds.
which corresponds to the diameter of the cartridge
used. On V4" the positions of gain selector 39
become +40, +60 and +90 dB, values inscribed in a
circle.
3.2. Selection of Measuring Circuit
Turn attenuator 7 to +20 dB and watch meter 14.
Set the METER FUNCTION switch on one of the
If the needle moves noticeably beyond +20 dB
LEVEL positions:
PEAK or +10 dB RMS turn switch 39 to
- RMS FAST : average value of the sig-
nal on the RMS scale of meter 14, +80 dB. If the needle is clearly below 0 dB, turn
integration time 200 ms. switch 39 to +40 dB. Calculate the value measured
RMS SLOW average value of the and take into account the restrictions described in
signal on the same scale, but integration paragraph 3.6.3.
time 500 ms.
- PEAK: peak value of the signal, on the
PEAK scale of meter 14, integration time
5 ms, with a memory circuit holding the
signal for about 1 second. QSJA-MKH AMPLIFIER
The measuring circuit of the recorder should be
This amplifier has no gain selector or cartridge type
selected in accordance with the criteria given in .
selector. The sensitivity can be determined by main
Section 3.
attenuator 7 only.
AMPLIFIER FOR GENERAL
RADIO MICROPHONE
The amplifier for use with the GENERAL RADIO
3:3. Adjustment of the Monitoring Circuit microphone is the QSJA-B K; please refer to the
The signals can be monitored on the headphones above instructions for using this amplifier.
with switch 4 in any position and with the built-in
loudspeaker on PLAYBACK with Loudspeaker
(see 6.).
The mono headphones, impedance 50 to 600 n, 3.5. Choice of Filter
plug into jack 17. The required channel can be
When fi Iter selector switch 11 is on LI N, the fre-
selected with switch 18 and the loudness regulated
quency response of the direct chain is linear at
by potentiometer 19, which can be adjusted with a
±0.3 dB from 2.5 Hz to 35 kHz. Selector switch 11
screwdriver.
should be set on one of the following positions
according to the kind of measurements being taken:
HP: high-pass filter, attenuation 3 dB at
20 Hz, 12 dB per octave
WEIGHTING A, B, C, D: weighting of the
3.4. Choice of Sensitivity
frequency response as determined by
3.4.1. High-level Signals on the Line Input international standards, the exact value
Set selector 10 on LINE, turn main attenuator 7 of which is given at the end of the section
fully to the left, or on GND, set vernier attenuator entitled Specifications.
7A on 0 dB (CAL.). The HP position should be used systematically when
the measurement of signals is not extended to very
low frequencies: in fact, since these are inaudible,
Switch on the signal source connected to the line
they are likely to falsify results and, in some cases,
input. While watching meter 14, turn main attenua-
saturate the amplifiers. Furthermore, this position
tor 7 to the right until the red needle makes a
eliminates very low frequency noise from the car-
visible movement. Calculate the value measured as
tridge itself.
described in paragraph 3.6.1.
The weighting positions A, B, C and D are used, in
3.4.2. High-level Signals oli the Microphone Input the case of noise measurement, to obtain a value
Same procedure as in the preceding paragraph, but corresponding to the subjective impression felt by
with selector 10 on MI KE. the human ear (see Section 1).3.6. Calculation of the Value Measured value shown by the needle, makes it possible to
determine the voltage applied to the input, i.e. for
Measurement of High-level Signals by the
Line Input xdB:
A 1 mV sine wave signal applied to the line input x
gives a reading of 0 dB on the PEAK scale or on the input voltage in millivolts = 10 20
RMS scale, when main attenuator 7 is on
0.001 V or 0 dB.
Meter 14 is graduated in decibels only; since the Basically, vernier attenuator 7 A remains on 0 dB
value indicated by main attenuator 7 corresponds (CAL.). With this attenuator it is possible to make
to a reading of 0 dB on the meter, the exact value a fine adjustment, if necessary, in steps of 1 dB: the
of the signal - in decibels in relation to t!"Je 0 dB value shown by its switch should be added to that
reference level - is obtained by adding algebraically of main attenuator 7.
the value shown on meter 14 to the value shown on
The graduations in dB of attenuators7 and 7A and
main at4!nuator 7 and, when necessary, on vernier
meter 14 are also usable for relative measurements
attenuator 7A. The number of decibels obtained
without pinpointing the reference.
should then be converted into a voltage ratio, and
the line input voltage deducted from the 1 mV
reference voltage.
It is a convention in electro-acoustics to express
measurements taken at peak value in terms of the
RMS value which would be given by a sine wave
signal with the same peak value; the input sensitivity
and the output voltage of the recorder are therefore
expressed in terms of their RMS value, assuming the 3.6.2. Measurement of High-level Signals by the
signals are sine wave. Microphone Input
On RMS, the measuring circuit of the recorder Proceed in the same way as described in the pre-
responds to the RMS value of the signal and indicates, ceding paragraph, but with selector 10 on MI KE.
after decibel/voltage conversion, the RMS value.
On PEAK, the measuring circuit of the recorder 3.6.3. Measurement of Low-level Signals by the
responds to the peak value of the signal and Microphone Input
indicates, after decibel/voltage conversion, a value
which is the RMS value of the signal only if it is a The sound level, measured in decibels, in relation
pure sine wave; the actual peak value, whatever the to the 2.10- 5 N/m 2 reference level, is equal to the
form of the signal, is obtained by multiplying the algebraic sum of the values indicated by gain selec-
value indicated by 1.414. tor 39, main attenuator 7, vernier attenuator 7A,
the reading on meter 14 and a specific correction
A 1 mV RMS sine wave signal applied to the line value given according to the cartridge and amplifier
input, with the attenuators on 0 dB, gives an iden- circuits used.
tical reading on PEAK and on RMS , which
The correction value includes, amongst other things,
is equal to 0 dB,
a correction factor K o . This is the difference,
A signal without a well-defined form, applied to expressed in decibels, between the sensitivity of a
the line input, gives the following values after standard cartridge (50 mV/N/m 2 ) and the actual
decibel/voltage conversion of the reading: sensitivity measured in the laboratory by the manu-
- on PEAK, peak value divided by 1.414 facturer. The K o factor is given in the calibration
- on RMS, RMS value chart issued with each Bruel & Kjaer microphone
cartridge.
The line input impedance is 100 kn. On the maxi- To facilitate the reading of meter 14 the needle
mum sensitivity position (9 dB) there is no increase should be as n.ear as possible to the +20 dB PEAK
in input noise as long as the sound source impe- or +10 dB RMS values, without exceeding
dance remains low in relation to the 100 kn input them. If the signal is too weak when attenuator 7
impedance. is on +20 dB, turn the knob to the right; if the
readi ng is sti II too low when the attenuator is on
o dB, turn gain selector 39 from +60 dB to +40 dB.
If necessary, readjust main attenuator 7.
Select the attenuator position for which the needle If the signal is too strong when attenuator 7 is on
of the meter shows the closest possible value to +20 dB, turn its knob to the left; if the reading is
+10 dB RMS or +20 dB PEAK, without sti II too high when the attenuator is on +40 dB
exceeding this limit. The attenuator knob then (marked with an arrowhead), move gain selector 39
indicates a decibel value which, when added to the from +60 dB to +80 dB.The arrowhead opposite the +40 dB position on 3.6.3.1. Limits and Corrections with the QJPA
attenuator 7 is to remind the user that certain Preamplifier and OSJA-BK Amplifier
restrictions must be observed in order to avoid
saturation of the input circuits, when measurements Same as below
are taken. by microphone, preamplifier and ampli- The preamplifier gain "G" is the same as for
fier. Bruel & Kjaer 2619 preamplifier.
The performance of the microphone cartridges and
input amplifier circuits is restricted by the occur-
rence of saturation phenomena which are produced
when the sound level measured becomes very high. 3.6.3.2. Limits and Corrections with Bruel &
These phenomena may be detected by a trained ear Kjaer Preamplifiers and the QSJA-BK
if measurements are being taken and monitored Amplifier
simultaneously (see 3.3.), and if the operator is not When main attenuator 7 is opposite the reference
exposed acoustically to the sound source. If the at +40 dB, there is no risk of saturation as long as
phenomena pass unnoticed the measurement will the needle of meter 14 does not move beyond
be incorrect. The only sure way to avoid saturation +20 dB PEAK, with gain selector 39 on +40 or
and its consequences is to impose a limit on the +60 dB; when the latter is on +80 dB (+90 dB for a
attenuator which directly follows the input cir- 1/4 " cartridge), the main attenuator may be set
cuits; when the attenuator is at this limit, any sound beyond the +40 dB position as saturation then
signal which makes the needle of meter 14 deviate depends only on the cartridge used and the corres-
to the right to its fullest extent, saturates the input ponding preamplifier.
circuits and cannot be measured. In this case, the
With cartridge type selector 40 in the position
amplifier gain must be reduced by turning its selec- corresponding to the cartridge used, the sound level
tor from +40 dB to +60 dB or from +60 dB to is obtained by direct reading when the potentio-
+80 dB; if saturation still occurs on this position it meter of the QSJP adapter is adjusted to a correc-
means that the output level of the transducer used tion value K, given in dB by the following relation:
is too high. A less sensitive transducer should then
be used or an attenuator inserted between the trans- IK = Ko - G - X I
ducer and the preamplifier.
Ko = open circuit correction factor given by
the manufacturer
G = preamplifier gain in relation to the
type of cartridge and its mechanical
adapter given by the manufacturer
X difference between the typical sen-
sitivity of the cartridge and the
50 mV/N/m 2 reference value, in accor-
dance with the following table:
Type of 1" Ih" 1/4 " 1/4 " 1/8 "
cartridge 4135 4136* 4138**
X in dB 0 +12 +22 +30 +34
*With the 1/4 " cartridge 4136, 8 dB must be added
to the calculated value to obtain the sound level (X
takes into account the adjustment range limits of
the QSJP adapter).
** Cartridge type selector 40 on 1J4"; add 12 dB to
the calculated value to obtain the sound level.
Example
1J2" cartridge 4133 with preamplifier 2619:
Ko = + 12. 2 dB G = 0.4 dB X = + 12 dB
Value to which the potentiometer of the QSJP
adapter should be adjusted:
K = 12.2 + 0.4 - 12 = +0.6dB3.6.3.3. Limits and Corrections with the M KH 110
Microphone and the OSJA-MKH
Amplifier
TheOSJA-MKH amplifier does not in any way alter
the performance of the microphone and its elec-
tronic circuit'; reference should be made to the
sound level limits indicated by the manufacturer
for saturation 'and background noise.
Correction: With the MKH 110 microphone add
60 decibels to the value set on main attenuator 7
and to the value shown by meter 14. With the
MKH 110-1 microphoneadd80dB.
3.6.3.4. Limits and Corrections with the
1560-P42 GENERAL RADIO Amplifier
As the OSJA-BK amplifier is being used, the same
limits and corrections as those given in paragraph
3.6.3.2. are valid.
The G value, which represents preamplifier gain in
relation to the type of cartridge, is shown in the
following table.
Type of cartridge %"
G in dB -2.5 -6
IMPORTANT
In all cases where there is uncertainty about the
sensitivity, the K correction factor of the cartridge,
or the gain of the input circuits, we recommend the
use of a calibration device. This device is applied to
the cartridge and produces a calibrated sound level
of a precisely known value. The BrLiel & Kjaer
pistonphone and the acoustic calibrator produce a
fixed frequency signal; with calibration equipment
using an electrostatic actuator for condenser micro-
phones it is possible to calibrate at different
frequencies.Vous pouvez aussi lire