Dynamique de succession forestière dans les forêts feuillues nordiques après coupes partielles réalisées dans un contexte industriel
←
→
Transcription du contenu de la page
Si votre navigateur ne rend pas la page correctement, lisez s'il vous plaît le contenu de la page ci-dessous
Dynamique de succession forestière dans les forêts
feuillues nordiques après coupes partielles réalisées
             dans un contexte industriel

                            Mémoire

                         Émilie St-Jean

         Maîtrise en sciences forestières - avec mémoire
                    Maître ès sciences (M. Sc.)

                        Québec, Canada

                     © Émilie St-Jean, 2021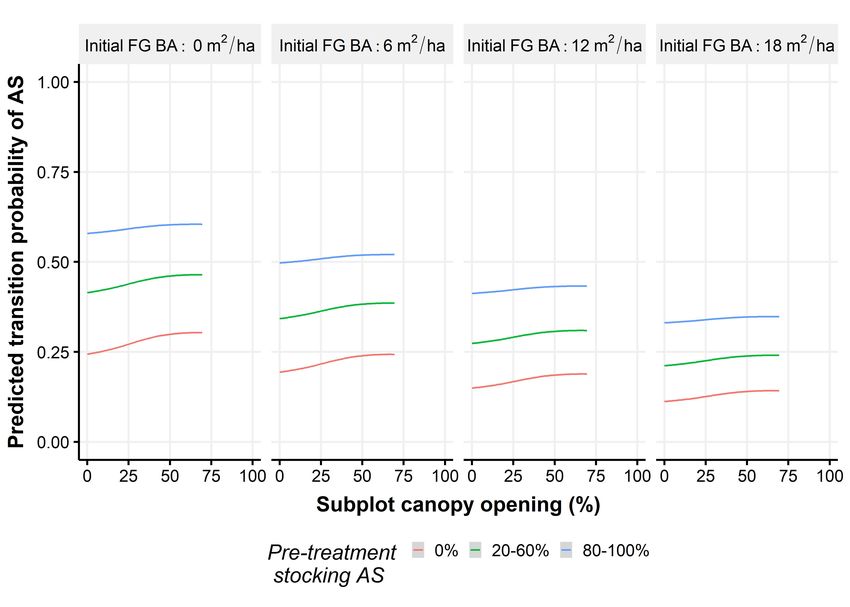
Dynamique de succession forestière dans les forêts
feuillues nordiques après coupes partielles réalisées
             dans un contexte industriel

                            Mémoire

                         Émilie St-Jean

                       Sous la direction de:

               Alexis Achim, directeur de recherche
            Christian Messier, codirecteur de recherche
Résumé
L’augmentation en dominance du hêtre à grandes feuilles (Fagus grandifolia Ehrh.) jumelée à
la diminution de l’érable à sucre (Acer saccharum Marsh.) en régénération menace la viabilité
économique des forêts feuillues nordiques aménagées. En se basant sur l’hypothèse que l’aug-
mentation de la disponibilité de la lumière pour la régénération favoriserait l’érable à sucre, la
coupe progressive irrégulière est passée d’une mise en oeuvre expérimentale à opérationnelle
à grande échelle au cours de la dernière décennie. Nous avions comme objectif de vérifier
si des variantes de coupes partielles, telles que la coupe de jardinage et la coupe progressive
irrégulière, faites dans un contexte industriel, avaient tendance à favoriser la régénération de
l’érable à sucre au détriment de celle du hêtre. Nous avons mesuré le coefficient de distri-
bution, l’abondance et la croissance de la régénération dans des coupes industrielles âgées de
trois à six ans dans la forêt feuillue du Québec, Canada. Le suivi de la régénération a per-
mis de démontrer une indéniable dominance du hêtre à grandes feuilles, tout type de coupe
confondu, particulièrement chez les grands semis et gaules. Cependant,dans certaines condi-
tions, les indices de probabilités de transition (combinant la croissance et l’abondance relative)
de l’érable à sucre pouvaient être légèrement favorisés par l’augmentation du prélèvement en
surface terrière, dans certaines conditions. En se basant sur le coefficient de distribution et la
surface terrière marchande du hêtre avant la coupe, nous avons proposé de nouveaux critères
pour aider à décider dans quelles situations une augmentation de l’intensité de la coupe par-
tielle permettrait de favoriser significativement la régénération de l’érable à sucre. Au-delà de
ces résultats, l’étude met en lumière l’importance de raffiner le processus de diagnostic et les
prescriptions sylvicoles de nos forêts feuillues afin de limiter efficacement l’expansion du hêtre
à grandes feuilles.
iiTable des matières
Résumé ii
Table des matières iii
Liste des tableaux iv
Liste des figures v
Remerciements vi
Avant-propos vii
Introduction 1
1 Transition probability modelling of regeneration shows when increased
levels of harvest could favour sugar maple over American beech in
northern hardwoods 5
1.1 Abstract . . . . . . . . . . . . . . . . . . . . . . . . . . . . . . . . . . . . . . 5
1.2 Résumé . . . . . . . . . . . . . . . . . . . . . . . . . . . . . . . . . . . . . . 6
1.3 Introduction . . . . . . . . . . . . . . . . . . . . . . . . . . . . . . . . . . . . 7
1.4 Material and methods . . . . . . . . . . . . . . . . . . . . . . . . . . . . . . 10
1.5 Results . . . . . . . . . . . . . . . . . . . . . . . . . . . . . . . . . . . . . . . 17
1.6 Discussion . . . . . . . . . . . . . . . . . . . . . . . . . . . . . . . . . . . . . 23
1.7 Conclusion . . . . . . . . . . . . . . . . . . . . . . . . . . . . . . . . . . . . 29
Conclusion 30
Bibliographie 33
iiiListe des tableaux
1.1 Details of the fitted gamlss model. . . . . . . . . . . . . . . . . . . . . . . . . . 22
1.2 Proposition de traitements sylvicoles à appliquer afin de limiter l’expansion du
hêtre en faveur de l’érable à sucre dans les érablières publique du Québec . . . 31
ivListe des figures
1.1 Study area and location of the 12 harvesting sites . . . . . . . . . . . . . . . . 11
1.2 Variable-radius plot design. . . . . . . . . . . . . . . . . . . . . . . . . . . . . . 12
1.3 Attributes related to understory resource availability per treatment. . . . . . . 17
1.4 Abundance (mean + SE) and dominance of regeneration. . . . . . . . . . . . . 18
1.5 Predicted time to reach two meters in height as a function of measured subplot
canopy for five hardwood species and the other species pooled together, for two
height classes (small and tall seedlings) and for two subplot locations (skid-trail
or strip) . . . . . . . . . . . . . . . . . . . . . . . . . . . . . . . . . . . . . . . . 20
1.6 Distribution of transition probability indices per species. . . . . . . . . . . . . . 21
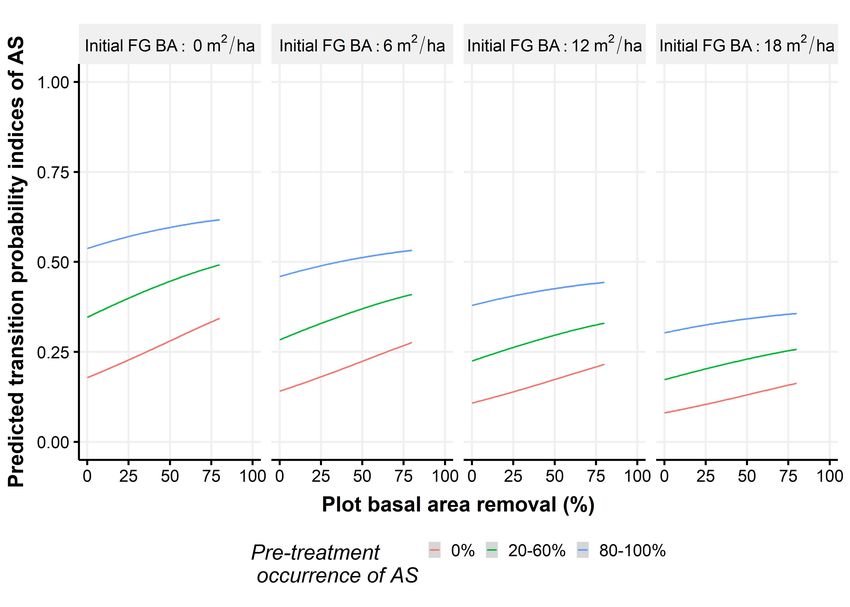
1.7 Predictions of transition probability indices for AS as a function of plot basal
area removal per class of AS pre-treatment occurrence in the advance growth
and pre-treatment FG basal area (FG BA). . . . . . . . . . . . . . . . . . . . . 23
1.8 Predictions of transition probability indices for AS as a function of subplot
canopy opening per class of AS pre-treatment occurrence in the advance growth
and initial FG basal area (FG BA). . . . . . . . . . . . . . . . . . . . . . . . . . 24
vRemerciements
Je tiens d’abord à remercier mon directeur, Alexis Achim. J’ai la chance de compter sur son
enthousiasme contagieux et sa générosité depuis cinq ans. Sa confiance et ses encouragements
m’ont certainement amenée "à un autre niveau". Il a largement contribué à parsemer mon
parcours d’expériences mémorables. La plus précieuse aura été sans aucun doute mon stage à
Forest Research, à Édimbourg en Écosse. Un grand merci à Bruce, Juan et Tom pour m’avoir
invitée à travailler avec vous à FR.
J’ai également eu la chance de rencontrer Christian Messier et Philippe Nolet, qui m’ont tous
deux généreusement accueillie à l’ISFORT. Ils ont contribué à élargir ma compréhension de
l’écosystème forestier.
Je remercie tous mes talentueux collègues du labo AA : André, Christine, Claude, David,
Guillaume, Iman, Joëlle, Jean-Romain, Lady, Laurence, Thomas et Yann. Mention spéciale
à Alex, qui a sacrifié son amour du soleil et de la chaleur pour un stage en Écosse. Merci
également à tous mes précieux collègues, amis et partenaires de balon-balai du ABP/GHK
et de l’ISFORT. Je n’aurais pas pu accomplir cette maîtrise sans l’aide des multiples auxi-
liaires qui m’ont accompagnée durant ses deux dernières années : Oli, Floren(c)e, Raph, Luc,
Émile, Myriam et Félix. Merci pour votre bonne humeur inébranlable, votre patience et votre
ingéniosité malgré les adversités du terrain.
Merci au Ministère des Forêts, de la Faune et des Parcs du Québec en Outaouais et dans les
Laurentides de m’avoir partagé de nombreuses et précieuses données. Un merci particulier à
Sébastien Meunier pour m’avoir ouvert les yeux sur les nombreuses problématiques de la forêt
feuillue et pour tout le temps donné pour le bon fonctionnement du projet.
Je remercie le Conseil de recherches en sciences naturelles et en génie du Canada et le Fonds
de recherche du Québec-Nature et technologies pour le soutien financier. Merci au programme
de Bourses canadiennes du jubilé de diamant de la reine Elizabeth II (et à la grande Évelyne
Thiffault pour y avoir appliqué).
Finalement, merci à mes amis et à ma famille. Dan et Loulou, votre éternel support m’a permis
de me rendre jusqu’ici. Surtout, merci beaucoup à Renaud qui m’a soutenue de près et de loin
durant les hauts et les bas de cette belle aventure à Québec, à Gatineau et en Écosse.
viAvant-propos
Ce mémoire est constitué d’un article rédigé en anglais, d’une introduction et d’une conclusion
générale en français. L’article a été rédigé dans le but d’être publié dans une revue scientifique.
Les questions et hypothèses de recherche ont été établies avec l’aide de mon directeur de
recherche, Alexis Achim. J’ai fait les analyses statistiques avec les données du Ministère des
Forêts, de la Faune et des Parcs du Québec et mes propres données récoltées sur le terrain.
J’ai interprété les résultats et rédigé le manuscrit, je suis donc l’auteure principale de l’article.
Mon directeur a participé à l’élaboration du projet de recherche, et a fourni d’indispensables
conseils tout au long du projet sur la méthodologie, l’analyse des résultats et la rédaction.
Mon codirecteur Christian Messier et troisième collaborateur Philippe Nolet, m’ont également
supportée lors de la mise en oeuvre de la méthodologie, l’analyse des résultats et la rédaction.
Ils sont donc également co-auteurs de l’article scientifique. Finalement, Sébastien Meunier,
préalablement maître de stage au projet au Ministère des Forêts, de la Faune et des Parcs, est
le cinquième auteur de l’article, pour sa large contribution à l’élaboration de la problématique
et des objectifs et ses conseils pour la méthodologie.
viiIntroduction générale
La dynamique de la forêt feuillue du nord-est de l’Amérique du Nord, et par conséquent son
aménagement, sont en mutation. L’aménagement de cette forêt doit tenir compte des nombreux
services écosystémiques qu’elle fournit à la population (Leak et al., 2014). Au Québec, la
forêt feuillue se retrouve au sud, là où la majorité de la population réside. Ses paysages ont
donc une grande valeur, esthétique notamment, et jouent un rôle important pour la santé
et le bien-être des gens qui la côtoient (Karjalainen et al., 2010). Cette proximité la rend
également facile d’accès pour y faire toutes sortes d’activités, de la chasse, à la randonnée,
à la production de sirop d’érable. La forêt feuillue du nord-est de l’Amérique du Nord est
également l’habitat d’une grande diversité d’espèces fauniques et florales (Leak et al., 2014;
Ordre des ingénieurs forestiers du Québec, 2009). Au Québec, la majorité de la forêt feuillue
se retrouve dans les domaines bioclimatiques de l’érablière à bouleau jaune et de l’érablière à
tilleul. Ces domaines totalisent près de 96 000 km2 du territoire (Saucier et al., 2009). L’érable
à sucre (Acer saccharum), le bouleau jaune (Betula alleghaniensis) et plus marginalement le
chêne rouge (Quercus rubra) s’y retrouvant sont parmi les trois espèces de feuillus nobles les
plus désirées par l’industrie forestière oeuvrant sur ce territoire actuellement.
Il a été longtemps pris pour acquis que la régénération en érable à sucre s’établissait facilement
suite aux coupes partielles dans les forêts tempérées nordiques (Eyre and Zillgitt, 1953; Tubbs,
1977, 1968). Pourtant, de plus en plus d’inquiétudes sont soulevées quant à la durabilité de
la présence de l’érable à sucre dans les forêts feuillus nordiques aménagées (Bose et al., 2017;
Duchesne et al., 2005; Matonis et al., 2011). Son abondance en déclin jumelée à l’augmentation
de la proportion de hêtre à grandes feuilles en régénération sont à la base de ces inquiétudes
(Bose et al., 2017; Duchesne et al., 2005; Gauthier et al., 2015).
Ce phénomène est d’autant plus préoccupant puisqu’en parallèle se déploie la maladie corti-
cale du hêtre (MCH). Elle résulte de l’infection d’un type de cochenille (Cryptococcus fagisuga
Lind.) d’origine exotique, suivie de champignons pathogènes (Neonectria faginata and N. di-
tissima)(Cale et al., 2013; Houston, 1994). La MCH entraîne une dégradation du bois qui peut
limiter le potentiel de valorisation du hêtre (Boulet and Huot, 2013). Une grande quantité de
drageons de hêtre peuvent émerger des racines de l’arbre mère en réaction à sa dégradation ou
à l’ouverture du couvert subséquent (Boulet and Huot, 2013; Hane, 2003; Houston, 1994; Roy
1and Nolet, 2018). Les drageons de hêtre auraient d’ailleurs de meilleures chances de survie que
les semis en plus d’avoir une meilleure croissance (Beaudet et al., 2007; Beaudet and Messier,
2008).
L’érable à sucre préfère les sols riches avec un drainage bon à modéré, mais il a une grande ca-
pacité d’adaptation (Boulet and Huot, 2013). Depuis quelques décennies cependant, il connaît
à certains endroits au Québec une augmentation de mortalité, de déperissement, de mort en
cime et donc de diminution en qualité (Côté and Ouimet, 1996). Le hêtre à grandes feuilles
pourrait également être une cause du déclin de l’érable à sucre. La diminution de la dispo-
nibilité de lumière causée par l’augmentation de l’abondance de gaules de hêtres limite le
développement de la banque de semis de l’érable à sucre : sa stratégie de régénération princi-
pale (Hane, 2003; Marks and Gardescu, 1998).
Malgré le rôle écologique important du hêtre, on cherche donc depuis de nombreuses années
à refréner le phénomène appelé « l’envahissement du hêtre dans les érablières » (Bose et al.,
2017; Duchesne et al., 2005). À l’échelle provinciale, l’abondance du hêtre à grandes feuilles a
considérablement augmenté dans les dernières décennies. Dans la sous-région 3bm, du domaine
bioclimatique de l’érablière à bouleau jaune, la densité moyenne aurait augmenté de plus
de 600 tiges/ha entre la première (1970-1979) et la 4e campagne d’inventaires (2003-2014),
dans les placettes-échantillons permanentes du Ministère des Forêts, de la Faune et des Parcs
(MFFP) (Direction de la recherche forestière, 2017). L’augmentation en densité peut être
expliquée en partie par le fait que cette espèce a été longtemps délaissée par les compagnies
forestières (Boulet and Huot, 2013). Les blessures de racines des hêtres résiduels aurait favorisé
le développement de drageons (Jones and Raynal, 1988). L’érable à sucre est plus brouté que le
hêtre par les herbivores comme le cerf de Virgine (Odocoileus virginianus) et l’orignal (Alces
alces) (Bose et al., 2018; Matonis et al., 2011). Le phénomène d’envahissement a aussi été
associé aux conditions pédologiques (Duchesne and Ouimet, 2009), mais des liens de causalité
demeurent difficiles à établir (Messier et al., 2011).
La disponibilité de lumière affecte la dynamique de l’érable à sucre et du hêtre. Ces deux
espèces sont communément considérés comme très tolérantes à l’ombre et peuvent survivre
plusieurs décennies sous couvert (Boulet and Huot, 2013; Burns et al., 1990). En revanche,
le hêtre croît en hauteur plus rapidement que l’érable à sucre dans des conditions de faible
ouverture de canopée (Canham, 1988, 1990). Selon Bose et al. (2017), sans perturbation na-
turelle majeure ou sans la création de grandes trouées par la récolte forestière, les forêts du
nord-est des États-Unis seront de plus en plus dominées par le hêtre. La coupe de jardinage,
un système de régénération créant de petites trouées en prélevant un ou plusieurs tiges uni-
formément (communément recommandé pour l’établissement d’espèces tolérantes à la lumière
comme celle des forêts feuillues du Québec), aurait avantagé le hêtre au détriment de l’érable à
sucre (Bannon et al., 2015; Collin et al., 2017; Larouche et al., 2013; Nolet et al., 2008; Poulson
and Platt, 1996). Nolet et al. (2008) soutiennent que l’érable serait avantagé par rapport au
2hêtre par des perturbations plus sévères.
Plusieurs études ont démontré que la création récurrente de grandes trouées produisant une
plus grande disponibilité de lumière favoriserait l’érable à sucre (Canham, 1988; Poulson and
Platt, 1996). Dracup et MacLean (2018) ont suggéré que 45% de prélèvement en surface terrière
était suffisant pour limiter les conditions favorables à la régénération en hêtre. Cependant,
la majorité des connaissances acquises sur le sujet a été acquise à petite échelle dans des
expériences contrôlées, qui peuvent être moins représentatives des conditions créées par des
interventions à une échelle industrielle (Puettmann et al., 2009). Des études sur les coupes
partielles ont révélées d’importantes différences entre un traitement expérimental et industriel,
particulièrement en lien avec l’hétérogénéité spatiale du prélèvement et de la disponibilité de
la lumière pour la régénération (Guay-Picard et al., 2015; Guillemette et al., 2013; Moreau
et al., 2020).
Un vaste territoire comme la forêt feuillue publique du Québec génère un contexte dans lequel
il n’y a pas de solution sylvicole simple pour favoriser l’établissement et le recrutement de
l’érable à sucre. L’approche sylvicole ayant actuellement le plus de succès, la création d’exclos
et le débroussaillage du hêtre, est coûteuse et n’est peut-être pas nécessaire dans toutes les
situations (Bohn and Nyland, 2003; Bose et al., 2018; Nyland et al., 2006). Le rétablissement
et le recrutement agressif du hêtre ainsi que le déclin subséquent de l’érable à sucre menacent
la viabilité économique des forêts feuillues aménagées dans un contexte industriel (Nelson
and Wagner, 2014). L’augmentation de la densité du hêtre aux dépens de l’érable à sucre
pourrait avoir comme effet de réduire la biodiversité des forêts concernées (Cale et al., 2013).
La disponibilité de la lumière est un facteur externe de croissance facile à contrôler avec les
opérations forestières : les forestiers peuvent contrôler la largeur d’une trouée (Kern et al.,
2017).
Les aménagistes du Québec prescrivent de moins en moins de coupe de jardinage (Ministère
des Forêts, de la Faune et des Parcs, 2009, 2020). Plusieurs autres raisons expliquent ce chan-
gement, mais ils s’appuient entre autres sur les précédents résultats qui soutiennent que le
hêtre est présentement favorisé par les faibles taux de prélèvement associés aux coupes de jar-
dinage (Direction de la recherche forestière, 2017). C’est donc la coupe progressive irrégulière
qui est depuis une dizaine d’années le traitement le plus communément appliqué (Ministère
des Forêts, de la Faune et des Parcs, 2020). Par ses différentes variantes, la coupe progressive
irrégulière est un système de régénération flexible permettant de créer des conditions favo-
rables à l’établissement d’espèces au besoins différents, mais peut être également définie par
un taux de prélèvement plus grand que les coupes de jardinage (Larouche et al., 2013; Ray-
mond et al., 2009). C’est la mesure de l’efficacité de ce changement de cap , mis en oeuvre à
grande échelle et ayant pour but d’augmenter la disponibilité de lumière pour la régénération,
qui constitue la motivation première à la réalisation du présent projet. Selon la Direction de
la recherche forestière (2017), les modèles doivent tenir compte des « effets des traitements
3sylvicoles sur la régénération des espèces à promouvoir ». Préciser les effets des interventions
en forêt permettrait de mieux modéliser la dynamique de succession, et par le même fait la
croissance, de la forêt feuillue du nord-est de l’Amérique du Nord des prochaines décennies.
Objectifs
L’objectif principal du projet était d’évaluer les effets des coupes partielles récentes appliquées
dans les forêts feuillues du sud-ouest du Québec sur la dynamique de l’érable à sucre et du
hêtre à grandes feuilles.
Objectif spécifique et hypothèse :
Plus spécifiquement, notre but était de vérifier si les différentes variantes de coupe partielle
produites dans un contexte industriel tendent à favoriser une succession forestière avec davan-
tage d’érable à sucre au détriment du hêtre à grandes feuilles.
Nous posons l’hypothèse qu’une augmentation de la disponibilité de la lumière en lien avec une
augmentation de l’intensité d’une coupe partielle favoriserait l’établissement et la croissance
de la régénération d’érable à sucre aux dépens du hêtre à grandes feuilles.
4Chapitre 1
Transition probability modelling of
regeneration shows when increased
levels of harvest could favour sugar
maple over American beech in
northern hardwoods
1.1 Abstract
The increasing dominance of American beech (FG, Fagus grandifolia Ehrh.) and the decreas-
ing proportion of sugar maple (AS, Acer saccharum Marsh.) in regeneration challenges the
long-term economic viability of commercially managed northern hardwoods in eastern North
America. Based on, inter alia, earlier studies showing that more light in the understory favours
AS over FG, the irregular shelterwood system has shifted from experimental to operational
implementation over the last decade. In this paper, we evaluated the success of such this shift
toward irregular shelterwood in promoting AS over FG by measuring the occurrence, abun-
dance of AS and FG seedlings and saplings, and growth of seedlings three to six years after
logging in northern hardwood forests of western Quebec, Canada. Results showed a domi-
nance of FG regeneration regardless of the harvest intensity, particularly among tall seedlings
and saplings. However, we found that the transition probability indices (projected relative
combined abundance and growth) of AS could be favoured, albeit to a limited extent, by an
increased basal area removal, particularly where the initial occurrence of AS in the advance
seedling regeneration is lower than 60% and the initial FG basal area is low in the overstory
(i.e. 6m2 ha-1 ). Our results highlight the importance of refining our operational management
strategy to effectively limit the increasing abundance of regeneration of American beech over
sugar maple in northern hardwood forests
51.2 Résumé
L’augmentation en dominance du hêtre à grandes feuilles (Fagus grandifolia Ehrh.) jume-
lée à la diminution de l’érable à sucre (Acer saccharum Marsh.) en régénération menace la
viabilité économique des forêts feuillues nordiques aménagées. En se basant sur l’hypothèse
que l’augmentation de la disponibilité de la lumière pour la régénération favoriserait l’érable
à sucre, la coupe progressive irrégulière est passée d’une mise en oeuvre expérimentale à opé-
rationnelle à grande échelle au cours de la dernière décennie. Nous avions comme objectif
de vérifier si des variantes de coupes partielles, telles que la coupe de jardinage et la coupe
progressive irrégulière, faites dans un contexte industriel, avaient tendance à favoriser la régé-
nération de l’érable à sucre au détriment de celle du hêtre. Nous avons mesuré le coefficient
de distribution, l’abondance et la croissance de la régénération dans des coupes industrielles
âgées de trois à six ans dans la forêt feuillue du Québec, Canada. Le suivi de la régénération a
permis de démontrer une indéniable dominance du hêtre à grandes feuilles, tout type de coupe
confondu, particulièrement chez les grands semis et gaules. Cependant,dans certaines condi-
tions, les indices de probabilités de transition (combinant la croissance et l’abondance relative)
de l’érable à sucre pouvaient être légèrement favorisés par l’augmentation du prélèvement en
surface terrière, dans certaines conditions. En se basant sur le coefficient de distribution et la
surface terrière marchande du hêtre avant la coupe, nous avons proposé de nouveaux critères
pour aider à décider dans quelles situations une augmentation de l’intensité de la coupe par-
tielle permettrait de favoriser significativement la régénération de l’érable à sucre. Au-delà de
ces résultats, l’étude met en lumière l’importance de raffiner le processus de diagnostic et les
prescriptions sylvicoles de nos forêts feuillues afin de limiter efficacement l’expansion du hêtre
à grandes feuilles.
61.3 Introduction
The increase in abundance of American beech (FG, Fagus grandifolia Ehrh.) over sugar maple
(AS, Acer saccharum Marsh.) in the regeneration in northern hardwood forests of eastern
North America in the last decades is concerning in light of the sustainable production of
good quality sugar maple timber. Not only is FG not normally a desirable species for timber
production, it is also severely affected by the exotic beech bark disease, an infection by two
fungi(Neonectria faginata and N. ditissima)that can be exacerbated by the presence of an
exotic insect (beech scale, Cryptococcus fagisuga Lindinger) (Houston, 1994). The disease
causes FG wood degradation and tree death without reducing the overall abundance of the
species (Cale et al., 2013; Garnas et al., 2011; Houston, 1994). On the contrary, either as a
reaction to the disease or as a consequence of an increased opening in the canopy, a dense
thicket of FG suckers and seedlings often develops in affected stands (Giencke et al., 2014;
Houston, 2001; Roy and Nolet, 2018). Due to both its high shade-tolerance and ability to
re-sprout from roots as suckers following disturbances, FG tends to be highly competitive in
forests affected by small scale disturbances (Beaudet et al., 1999; Roy and Nolet, 2018). As a
result, a feedforward mechanism is in place in northern hardwood forests whereby the factors
negatively affecting the vigor and quality of FG also promote its regeneration, at the expense
of local biodiversity (Cale et al., 2013; Giencke et al., 2014) and of the yield of high quality
timber (Pothier et al., 2013).
AS is one of the most valuable species from northern hardwood forests and is highly sought
after for so-called ‘appearance’ wood products such as furniture, cabinets and flooring as well
as for maple syrup production. It is also the main species found in the northern hardwoods
of Quebec : in the bioclimatic zone where AS is the dominant species, AS accounts for on
average 15% to 25% of the growing stock volume (Boulet and Huot, 2013). AS prefers rich
soil with moderate to good drainage, but it is highly adaptable (Boulet and Huot, 2013). Over
the last few decades in Quebec, the species has experienced increased mortality, defoliation of
the crown, and dieback resulting in decreased timber quality in Quebec (Bal et al., 2014; Côté
and Ouimet, 1996). Although environmental stressors have been identified as probable causes
for this AS decline (Bal et al., 2014; Bauce and Allen, 1991), the increase of FG abundance
in regeneration has also been considered as a predominant cause of AS regeneration failure
(Direction de la recherche forestière, 2017). Decreased light availability due to increasing FG
sapling abundance limits the development of the AS seedling bank, the main AS regenerative
strategy (Hane, 2003; Marks and Gardescu, 1998).Hane et al. (2003) suggested that negative
effects of FG thickets on AS also occur belowground where two species compete for the same
resources, and this could be exacerbated by a potential phytotoxic effect of FG on AS.
Past forestry practices, soil degradation, FG sprouting and preferential browsing are also re-
cognized as contributing to some extent to FG expansion and AS decline. In Quebec, the
increasing abundance of FG can also be partially explained by the fact that the species is of-
7ten left behind by forest companies (Boulet and Huot, 2013; Majcen et al., 2003). In addition,
damaged roots of residual FG trees resulting from logging operations may develop root sprouts
(Jones and Raynal, 1988). The decrease of the soil pH has also been associated with FG ex-
pansion (Arii and Lechowicz, 2002; Duchesne and Ouimet, 2009) although causal relationships
remain hard to identify (Bannon et al., 2015; Messier et al., 2011). Preferential browsing also
affects northeastern hardwood forest succession as white-tailed deer (Odocoileus virginianus)
and moose (Alces alces) were found to prefer AS over FG (Bose et al., 2018; Elenitsky et al.,
2020; Matonis et al., 2011).
In the absence of severe disturbances, the limited availability of light in the understory may
also alter the dynamics of AS and FG regeneration. Both AS and FG can survive for several
decades in the understory (Canham, 1990; Poulson and Platt, 1996). AS and FG have a
similar ecological niche ; however, under a very dense canopy, FG performs better than AS
and has greater lateral growth (Beaudet et al., 1999; Burns et al., 1990; Canham, 1988; Poulson
and Platt, 1996). Repetitive single-tree selection cuts have been recommended for northern
hardwoods as they create small gaps to establish shade-tolerant species. This silvicultural
approach may thus favour FG regeneration over AS since these gaps create low light availability
conditions with limited variability (Bannon et al., 2015; Collin et al., 2017; Nolet et al., 2008;
Poulson and Platt, 1996).
Accordingly, several studies have recommended that AS regeneration could be favoured over
FG in larger gaps or following a greater removal of the overstory canopy. Nolet et al. (2008)in-
dicated that a partial cut retaining more than 25% of the forest cover was not sufficient to
favour AS at the expense of FG although Dracup and MacLean (2018) suggested that removing
45% of basal area is sufficient to limit the conditions that are favourable for FG regeneration.
Other studies have also suggested that the repetitive occurrence of large gaps may favour AS
over FG by providing higher light availability in the understory (Canham, 1988; Houston,
2001; Poulson and Platt, 1996). However, most of these results were obtained from carefully
controlled experiments which may not be representative of the conditions created by silvicul-
tural interventions conducted at the industrial scale (Puettmann et al., 2009). Previous studies
of partial harvesting have revealed important differences between experimental and applied
treatment results, especially in terms of the higher spatial heterogeneity of tree removal, and
of light availability in the understory, after commercial operations (Guay-Picard et al., 2015;
Guillemette et al., 2013; Moreau et al., 2020).
The vast territory of Quebec’s public forests creates a situation where there is no simple silvi-
cultural solution to favour the sustainable establishment and recruitment of AS. The currently
recommended approach of mechanical removal of FG and fencing to protect against browsing
(Bohn and Nyland, 2003; Bose et al., 2018; Nyland et al., 2006) may prove expensive to apply at
the regional scale and it may not be necessary in all situations. Applying glyphosate to control
FG regeneration is a recognized solution (Bose et al., 2018),but its use is banned in Québec’s
8forests. We therefore need to implement other cost-effective, efficient solutions as the vigorous
understory re-establishment and recruitment of FG, and concomitant decline of AS, following
logging threatens the economic viability of these commercially managed forests(Direction de
la recherche forestière, 2017; Nelson and Wagner, 2014).
Based on the experimental evidence cited above that large openings could create regeneration
conditions more favourable to AS than FG, inter alia, practitioners in western Québec have
changed their preferred management approach in northern hardwood forests (Ministère des
Forêts, de la Faune et des Parcs, 2020, 2009). Instead of selection cutting, variants of the irre-
gular shelterwood system are now commonly applied (Ministère des Forêts, de la Faune et des
Parcs, 2020). With their different variants (continuous-cover, irregular and expanded-gap), ir-
regular shelterwood systems are flexible regeneration systems that facilitate the establishment
of species with different light requirements (Raymond et al., 2009). They can also be defined
by a higher harvesting rate than selection cutting and more irregular cutting cycles (Larouche
et al., 2013). However, no long-term studies have yet confirmed that this shift towards irregular
shelterwood systems is efficient in favouring AS regeneration over FG.
To rigorously test the hypothesis that the conditions created by a higher harvesting rate in
partial cuts can help favour AS regeneration over FG in commercially harvested forests, we re-
sampled 96 plots three to six years after the application of various partial cutting treatments
in the northern hardwood forest of Quebec, Canada. Our sampling plots were distributed
among 12 harvesting sites where a range of treatments from single-stem selection to irregular
shelterwood had been applied. In addition to assessing the current composition of the fo-
rest regeneration, we measured the growth of seedlings and projected growth over time using
transition probability indices (Guay-Picard et al., 2015; Hill et al., 2005; Kneeshaw and Ber-
geron, 1998). These indices portray the short-term effect of harvesting by weighting a species
abundance with its growth rate.
91.4 Material and methods
1.4.1 Study area
The study area is located in the northern hardwood forest of southwestern Quebec, Canada
between longitudes 74◦ 30’ 0” W and 76° 30’ 0” W and latitudes 45◦ 47’ 60” N and 46° 36’
0” N. Elevation in the region ranges from 270 to 440 m. The area is within the AS – yellow
birch (Betula alleghaniensis Britton) bioclimatic domain of Quebec’s northern hardwood forest
type. Mean annual temperatures in this domain vary between 2.5 and 4.0 ◦ C (Saucier et al.,
2009). Mean annual precipitation average around 1000 mm (Saucier et al., 2009). Although
it is dominated by AS, the main forest canopy in the area is also composed of FG, yellow
birch, red maple (Acer rubrum L.) red oak (Quercus rubra L.), balsam fir (Abies balsamea [L.]
Miller), eastern hemlock (Tsuga canadensis [L.] Carrière), American hop-hornbeam (Ostrya
virginiana [Mill.] K. Koch), and American basswood (Tilia americana L.). Approximately
half of the study area experienced different intensities of forest tent caterpillar outbreaks in
2016, 2017 and 2018 (Malacosoma disstria). The insect feeds on codominant and dominant
AS tree leaves in northern hardwood forests, but can also eat other deciduous species except
red maple (Boulet and Huot, 2013; Fortin and Mauffette, 2002; Ordre des ingénieurs forestiers
du Québec, 2009). Most part of the study area has been subjected to two or three commercial
harvest over the last century. The study area was located across both the advance front and
the killing front of the beech bark disease and damage was mostly prevalent in its southern
part (Ministère des Forêts, de la Faune et des Parcs, 2019; Roy and Nolet, 2018; Shigo, 1972).
Beech bark disease, or beech scale, was observed in half of our sites. The mean density of
white-tailed deer was estimated as ranging from 2.26 to 3.05 per km2 in 2017 for the whole
study area, but it can be expected even lower since our sites are from fields of crops (Ministère
des Forêts, de la Faune et des Parcs, personal communication, January 11th, 2020) while
mooses are present, but less extensive (∼ 0.24 per km2 in 2002) in the study area (Ministère
des Forêts, de la Faune et des Parcs, 2015).
1.4.2 Stand selection
Quebec’s Ministry of Forests, Wildlife and Parks provided a database of available sampling
plots established before harvesting. Twelve felling sites were first selected, each consisting
of various partial cutting treatments conducted between 2013 and 2016. Throughout each
felling site, plots had been established systematically every 150 to 200 meters prior to harvest.
We selected plots from the database with at least 25% of the basal area consisting of either
AS or FG before treatment, with good or moderate drainage and with at least 50-cm-thick
soils of glacial or fluvio-glacial origins, as mapped by the Ministry with photo-interpretation.
These soil characteristics are the most common in the study area. We then applied a stratified
random sampling method to select eight plots per harvesting site. To ensure variability in basal
area removal, plots were selected across a range of partial cutting treatments i.e. single-tree
10selection cuts, continuous-cover irregular shelterwood cuts and extended irregular shelterwood
cuts. Except when restricted by regulations or where terrain limited access, all plots had been
harvested with fully mechanized operations. Harvesting operations were conducted either in
the late summer, fall or winter. A total of 96 plots were sampled during the summer of 2019
(Figure 1.1).
-77°0'0" -76°0'0" -75°0'0" -74°0'0"
47°0'0"
47°0'0"
!
H Laurentides
Outaouais !
H
!
H
46°0'0"
!
H
!
H
!
H !
H!H !
H
46°0'0"
!
H
!
H
Montréal
Ontario
-76°0'0" -75°0'0" -74°0'0"
Québec
!
H Sites
Studied regions
Figure 1.1 – Study area and location of the 12 harvesting sites
1.4.3 Data collection
Pre-treatment sampling
The sampling plots database provided by the Ministry contained the pre-treatment data.
Variable-radius plots were established with a basal area prism of a factor of 2. All trees with a
DBH larger than 9 cm were tallied. Pre-treatment regeneration sampling considered seedlings
with minimum heights of either 15 cm or 40 cm, depending on the sites. In the Outaouais
region, a cluster of five, fixed-radius subplots was established, one in the center of the plot and
four others in the main cardinal directions, 10 meters from the center. Following provincial
standards, the subplot radius depended on the species sampled (between 1.13 m and 2.82
11m). The regeneration sampling design in the Laurentides region also consisted of five fixed-
radius subplots, using the same species-specific radii. However, in this region the first plot
was established 6 meters from the center in the direction of the next plot and the four others
were successively established at a 6-meter interval in the same direction. In both regions,
the presence of seedlings was recorded for each species to indicate occurrence, but not their
abundance.
N 2 Seedling and
sapling abundance,
competition cover,
growth
measurements
Species- specific
radius, from 1.13
to 2.82 m
BA prism
5 1 measurements
10 m 3
Canopy opening,
subplot location,
seedling
dominance and 4
occurrence
Figure 1.2 – Variable-radius plot design. In all subplots (grey dotted outline), we noted
subplot location and measured canopy opening, seedling dominance and occurrence. In subplot
2, 3 and 4 (black filling), we measured seedling and sapling abundance, competition cover and
seedling growth. We measured basal area (BA) from the center with a prism of factor 2.
Post-treatment sampling
Our post-cut sampling was conducted from late May until August 2019. First, we updated
the pre-harvest data in the main plot for all trees with a DBH larger than 9 cm, with the
identification of live and dead trees as well as stumps to confirm removal and obtain the
post-treatment basal area. To assess the regeneration, we reproduced the same regeneration
sampling design as in the Outaouais region and maintained the same method of distributing
subplots in a cross pattern instead of in a line as in the Laurentides (Figure 1.2). In all cases, it
was impossible to make sure the regeneration subplots were located at the exact same position
as in the pre-harvest assessment. A member of the fieldwork team estimated canopy opening
using a forest densiometer calculating an average of five measurements for each subplot, at a
height of 1.3 m. Also, we identified whether the subplot was located in a strip or a skid-trail.
12. The seedlings were divided into two height classes i.e. small seedlings from 15 to 40 cm in
height and tall seedlings from 40 cm in height to a DBH of 1 cm. We also tallied saplings
with their DBH (DBH > 1 to 10 cm). The presence of each species for each height class
was recorded in each subplot. The species that would most likely dominate the seedling class
and the subplot class was noted separately for each subplot. We defined dominance as the
tallest vigorous stem in its respective class. If equally dominant, up to three species were
identified in this assessment. Finally, we identified the competition cover (0, >0-25%, 25-75
%, 75-100%) for each regeneration height class. We considered as competition vegetation any
non-merchantable species that had reached at least 15 cm in height. The competition cover
classes were cumulative i.e. the cover of saplings considered as competition (e.g. stripped
maple (Acer pensylvanicum)) would affect all height classes including those below. Other
examples of competition species were Rubus idaeus, Sambucus pubens, Viburnum lantanoides
and Dryopteris carthusiana. In three of the five subplots (north, south and east), we counted
non-browsed seedlings per height class and per species. We considered a seedling to be browsed
if it had been damaged over the last 3 years, as indicated by the subsequent primary growth of
the seedling. In subplots with extreme seedling densities, from one-fourth to three-fourths of
the subplot was sampled for efficiency, and estimates were scaled up to that of the entire plot.
We measured the annual height growth of seedlings for the previous three growing seasons,
using scale scars. For coniferous species, except eastern hemlock and eastern white cedar
(Thuja occidentalis), we used the annual whorls of branches. We randomly chose two samples
per species per height class and per subplot for time for time efficiency purpose. Again, we did
not consider browsed seedlings because we wanted three full years of growth. We randomly
chose two samples per species per height class and per subplot to measure the annual height
growth. Again, we did not consider browsed seedlings because we wanted three full years of
growth. Growth of the current year was not considered since the assessments were made at
different times throughout the summer.
1.4.4 Data analysis
Annual height increment
To avoid limiting our assessment to current conditions and to take into account the dynamic
nature of regeneration establishment and growth, we used the concept of transition probabi-
lities first proposed by Kneeshaw and Bergeron (1998) and later applied by Hill et al. (2005)
and Guay-Picard et al. (2015). The first step of this method consists of predicting the height
growth of seedlings. For this, we produced an annual height increment linear mixed-effects mo-
del for the five most abundant species in our study sites i.e. AS, FG, yellow birch, American
hop-hornbeam and red maple, as well as for all the other species pooled together. These groups
were included as a six-level categorical variable in the model. Only the non-browsed seedlings
were considered. The model was fitted using the nlme package (Pinheiro and Bates, 2011) in
13the R statistical programming environment (R Core Team, 2018). To limit a potential bias
attributable to the climate-induced variability in height growth, our dependent variable was
the mean height increment of the last three years. For this, we only used the data from sites
that were harvested in 2013 and 2014 (24 subplots from eight felling sites) to average three
full years in post-treatment conditions only. Site, plot and subplot levels were considered as
nested random effects. A set of seven candidate explanatory variables was defined a priori, na-
mely species, seedling height, subplot location (strip or trail-located), subplot canopy opening,
subplot competition cover class, subplot sapling basal area and subplot seedling abundance
of all species except that of the subject. We also included three possible interactions in the
full model (species : seedling initial height, canopy opening : subplot location and canopy
opening : competition class). The initial height of the seedling was selected as a covariate for
its known effect on seedling growth (Guay-Picard et al., 2015). The other variables were linked
to understory resource availability, which can also influence seedling growth (Beaudet et al.,
2007; Canham, 1988; Hannah, 1991). The best model was selected based on the results of
likelihood-ratio tests for nested models (Pinheiro and Bates, 2011). For all analyses, residuals
were analyzed to ensure that statistical assumptions were met. When outliers were identified,
the results of the analysis were examined without them to ensure that any outliers were not
a large source of bias. All outliers were maintained.
Transition probability indices
Instead of giving a static picture in time, transition probabilities portray regeneration using the
current abundance and growth rate of each species (Guay-Picard et al., 2015; Hill et al., 2005;
Kneeshaw and Bergeron, 1998). Transition probabilities are in fact indices of the projected
relative abundance, in this case expressed at the subplot level. The method provides indices
of forest succession, in this case in the regeneration strata, but does not take into account
mortality and recruitment after data sampling. Using height growth predictions from the
model described above, we used the relative time to reach 2 m to weight the seedling density
in a given height class. For this, we predicted annual height increments for the mean initial
height of each height class (27.5 cm for small seedlings and 120 cm for tall seedlings) of
each species which was present in any given subplot. We then integrated the annual growth
increment function to obtain the predicted time for the seedling to reach 2 m and normalized
the data by calculating the ratio of time to reach 2 m for a given species in a given height
class to that of the slowest growing species. The reference of 2 m was chosen as an indication
of regeneration reaching the sapling stage. Transition probability indices were then calculated
using :
P2
i=1 (RAi /∆Ti )
Pt = Pn P 2 (1.1)
t=1 i=1 (RAi /∆Ti )n
14where Pt is the transition probability index for a given species t (t = 1,2, . . .,n), RAi is the relative abundance of species t in height class i(i = 1 (small seedlings), 2 (tall seedlings)) and ∆Ti is the relative time necessary to reach 2 m for species t in height class i. The sum of transition probability indices within a subplot is 1. For a given species, transition probability indices can therefore vary between 0 and 1 with several occurrences of 0 and 1 values. Accordingly, transition probability indices were modelled using a zero-one inflated beta (BEINF) distribution. We used the gamlss package (Rigby and Stasinopoulos, 2005; Stasinopoulos et al., 2017) in the R statistical programming environment (R Core Team, 2018) to run the analyses. As explained by Durocher et al. (2019), the BEINF() function defines the beta inflated distribution with a four-parameter distribution where µ describes the vector of location parameter values >0 and 0 and
fitted model, we predicted transition probability indices from two simulated databases. For
this, we created classes representative of the observed variability for each variable except basal
area removal and canopy opening, which were correlated variables. In theses cases, we created
classes for one while using the mean value of the other for each class.

                                               16
1.5 Results
1.5.1 Pre- and post-harvest attributes
Prior to treatment, the surveyed plots were mainly composed of AS. The mean initial basal
areas of AS and FG were 14.9 and 4.2 m2 ha-1 , respectively. The initial basal area of FG in our
plots varied from no FG stems in the plots to a maximum of 22m2 ha-1 . The applied partial cuts
reduced stand basal area by 40% on average. Among plots, however, basal area removal varied
from 0 to 80%. From an initial mean basal area of 24.8 m2 ha-1 , the average basal area of the
plots was reduced to 14.7 m2 ha-1 after treatment. At the time of our sampling, canopy opening
at the subplot scale ranged from 0 to 69% with an average of 12.4%. On average, subplots
located in a strip had a canopy opening of 8% (SD=10%) whereas those in a skid-trail had an
opening of 22% (SD=15%). There was a high variability among plots and subplots in terms of
canopy opening, proportion of basal area removed and final basal area not only between the
types of partial cuts, but also between plots with each type of cut (Figure 1.3).
Figure 1.3 – Attributes related to understory resource availability per treatment. STS : Single-
tree selection cut, CIS : continuous-cover irregular shelterwood cut, EIS : extended irregular
shelterwood cut. For subplot canopy opening, difference between strip (green solid line) and
skid-trail (black dotted line) is represented.
171.5.2 Regeneration characterization
Occurrence, abundance and dominance
Prior to harvesting, the mean occurrence of species in the advance seedling regeneration of
the surveyed subplots (as provided, combining small and tall seedlings) was 61% (SD= 39%)
for AS compared to 40% (SD= 41%) for FG. Three to six years after harvesting, AS had
maintained a higher mean occurrence than FG in the small seedling class with 77% (SD =
31%) compared to 56% (SD = 37%), respectively. However, in the tall seedling class the
occurrence was similar between species, with 61% (SD = 39%) compared to 64% (SD = 37%)
for AS and FG, respectively. The most abundant species within the small seedling class was
AS with mean densities of approximately 12 000 stems ha-1 (Figure 1.4). The abundance of
AS decreased sharply in the tall seedling class, so that FG became the most abundant species
with densities averaging 3200 stems ha-1 . FG saplings were also the most abundant. FG was
the most common dominant species in the two seedling classes combined as it dominated
232 of the 480 subplots sampled (48%). FG saplings also dominated 40% of the subplots. By
comparison, AS seedlings and saplings dominated only 25% and 19% of the measured subplots,
respectively.
Figure 1.4 – Abundance (mean + SE) and dominance of regeneration. Dominance was obser-
ved for seedlings (two classes combined) and for saplings and is defined as the tallest vigorous
seedling. AR.= Acer rubrum, AS.= Acer saccharum, BA= Betula alleghaniensis, FG. = Fagus
grandifolia, OV= Ostrya virginiana. Seedl. =seedlings, Sapl.= Saplings
18Growth and relative growth
The final annual growth model included the subplot location (strip or skid-trail), the canopy
opening, the species, the seedling height and the interaction of the latter two as explanatory
variables. Small AS seedlings located in strips 0% canopy opening were predicted to take the
longest time to reach the 2 m threshold (over 36 years).We considered these seedlings as the
reference to calculate the relative growth for seedlings in all other conditions. In comparison,
the fastest growing seedlings were predicted to be tall yellow-birch seedlings located in a skid-
trail with almost 70% of canopy opening that were predicted to reach the 2 m threshold in
approximately 1.6 years (Figure 1.5). Moreover, the fastest AS seedling was a tall seedling
located in a skid-trail with a subplot canopy opening of just over 50% that was predicted to
reach 2 m in 2.7 years. In comparison, the slowest FG seedling was a small seedling in a strip
with 0% canopy opening that was predicted to reach 2 m in 31 years. The fastest FG seedling
was a tall seedling in a skid-trail with 64% canopy opening for which the anticipated time to
reach 2 m was 2.1 years.
19Figure 1.5 – Predicted time to reach two meters in height as a function of measured subplot
canopy for five hardwood species and the other species pooled together, for two height classes
(small and tall seedlings) and for two subplot locations (skid-trail or strip). Tall seedlings
are all considered 120 cm high and small seedlings 27.5 cm high. AR.= Acer rubrum, AS.=
Acer saccharum, BA= Betula alleghaniensis, FG. = Fagus grandifolia, OV= Ostrya virginiana.
Seedl. =seedlings, Sapl.= Saplings
20Vous pouvez aussi lire