Integrating Ozonation to Lagoon Treatment: lab-scale bioreactor methodologies and pilot-scale preliminary costs
←
→
Transcription du contenu de la page
Si votre navigateur ne rend pas la page correctement, lisez s'il vous plaît le contenu de la page ci-dessous
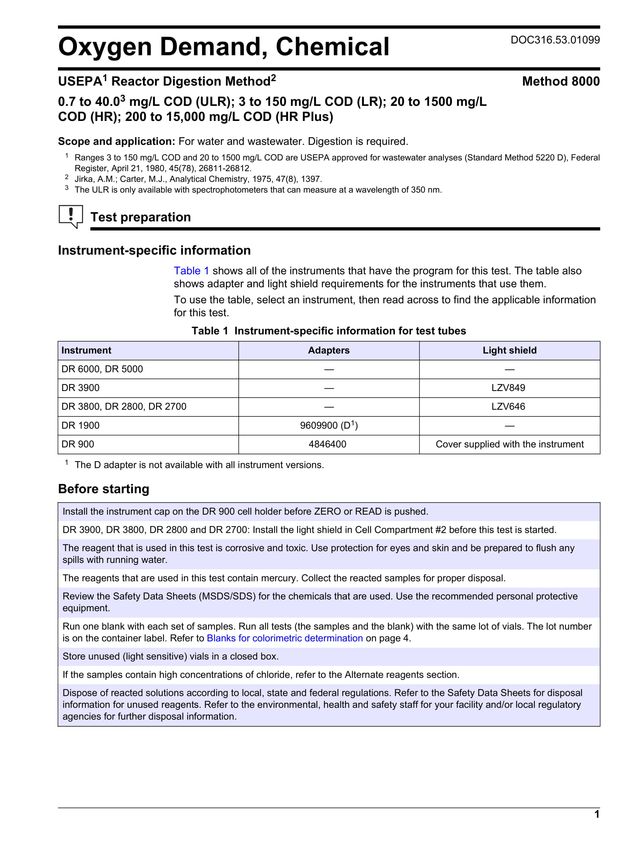
Integrating Ozonation to Lagoon Treatment:
lab-scale bioreactor methodologies and pilot-
            scale preliminary costs

                      Simina Alungulesa [260639135]
                          Department of Chemical Engineering
                             McGill University, Montreal

A thesis submitted to McGill University in partial fulfillment of the requirements of
               the degree of Master of Engineering (Thesis Option)

                                                Supervised by Viviane Yargeau
                                                                  August 2020

                                                                         Alungulesa ©
Research Thesis                                                                          Alungulesa ©

Abstract
Lagoon systems constitute an important part of wastewater treatment infrastructure in Canada and
they are common in small and remote communities, especially in First Nations (FN) communities.
In fact, more than 50% of wastewater treatment systems in FN communities are based on
facultative and aerobic lagoons. Although simple and low cost, these passive treatment systems
depend almost entirely on the natural biodegradation power of microorganisms that develop inside,
which are dictated by the surrounding climate conditions. Therefore, in regions subject to seasonal
variability such as Canada, a lagoon’s performance is challenged, and its treatment period is
limited. Indeed, a national assessment of FN wastewater infrastructure revealed that a fraction of
lagoon stations did not meet federal effluent discharge limits and approximately half of the
facultative lagoons were not reporting any effluent discharge data. Consequently, the new
wastewater systems effluent regulations that were implemented in June 2012 provided an incentive
for FNs to develop long-term strategies that focus on enforcing standards and protocols, operator
training and infrastructure investments.

A solution that has been proposed by the 3Cs laboratory to improve the performance of lagoon
systems is the integration of low dose ozonation to increase the biodegradability of wastewater,
while preserving microbial populations responsible for its treatment. In recent previous work, two
pilot tests were initiated during which a 15% volume fraction of a lagoon was ozonated at a low
dose in order to accelerate organic matter degradation. Preliminary results were promising, but due
to the difficulty in controlling and predicting lagoon conditions, further investigation was required
to confirm the role of ozone in the pilot tests. Therefore, the objective of this thesis was to study
the role of ozone in the pilot tests by developing a testing strategy at laboratory scale to investigate
and optimize the integration of ozonation to lagoon systems for enhancement of wastewater
quality. Additionally, a preliminary economic analysis was performed to assess the costs involved
in integrating ozonation to lagoon systems at pilot-scale.

The experimental design focused on simulating the aerobic conditions in a lagoon system by
performing a biological treatment in a bench-scale bioreactor. This setup was operated batch-wise
to treat synthetic wastewater using pre-incubated raw sludge collected at a local lagoon station.
Each experiment was carried out for a duration of 12 hours and involved ozonating 25% of the
bioreactor contents at various ozone doses during the different growth phases exhibited by bacteria
(i.e. lag, exponential and stationary). The ozonated portion was then returned to the bioreactor and
the biological treatment was resumed. The impact on COD removal rates, bacterial growth and
biodegradability of several emerging contaminants of concern (carbamazepine, atrazine,
ibuprofen, naproxen and gemfibrozil) was evaluated. During the method development phase, it
was found that performing ozonation towards the end of the lag phase (t = 5.5 hours) generated a
response in the biomass growth and removal of organic matter. In fact, in experiments conducted
in 100% synthetic wastewater, ozonating 25% of the volume at a dose of 10 mg O3/L increased
the biomass specific growth rate to 0.671 hr-1 from 0.603hr-1, which was recorded during the
control run. Similarly, a higher removal of COD was observed, as indicated by a final COD/CODo
ratio of 0.68 as opposed to 0.73 in the control run. When using a 50% mixture of raw and synthetic
wastewater to consider a more complex matrix, the specific growth rate was again increased to
0.439 hr- compared to 0.306 hr-1 in the control run. The final COD/CODo ratio followed a similar

                                                   2
Research Thesis                                                                     Alungulesa ©

trend with values of 0.88 and 0.80 in the control and ozonation experiments, respectively. These
results suggest that early ozonation might enhance biomass growth, which eventually facilitates
organic matter uptake. For the contaminants of emerging concern, although partial ozonation led
to significant removal of certain compounds, it did not promote further biological degradation.
However, in order to capture the full potential of low dose ozonation integration to a lagoon
system, it would be beneficial to conduct the experiments presented in this thesis at a wider range
of ozone doses and environmental conditions, and preferably in raw wastewater.

Finally, the preliminary economic analysis indicated that the use of a shared ozonation unit
between lagoon stations is a low-cost option compared to other conventional alternatives.
However, for lagoons that require significant improvement in treatment efficiency or that are
severely undersized, it seems that this strategy, although very economical, may not be sufficient.
If the results obtained are supported by more experiments, low dose ozonation could potentially
be used as a short-term solution to help lagoon system managers to reach compliance.

                                                3
Research Thesis                                                                         Alungulesa ©

Résumé
Les lagunages constituent une partie importante de l'infrastructure de traitement des eaux usées au
Canada et ils sont courants dans les petites collectivités éloignées, en particulier dans les
collectivités des Premières Nations (PN). En fait, plus de 50% des systèmes de traitement des eaux
usées dans les communautés des PN sont basés sur des lagunes facultatives et aérobies. Bien que
simples et peu coûteux, ces systèmes de traitement passifs dépendent presque entièrement du
pouvoir de biodégradation naturelle des micro-organismes qui s’y développent, qui sont influencés
par les conditions climatiques environnantes. Par conséquent, dans les régions sujettes à de grandes
variations saisonnières comme le Canada, la performance d’une lagune est mise à l’épreuve et sa
période de traitement efficace est limitée. En effet, une évaluation nationale de l'infrastructure des
eaux usées des PN a révélé qu'une fraction des stations lagunaires ne respectaient pas les limites
fédérales de rejet d'effluent et qu'environ la moitié des lagunes facultatives ne rapportaient aucune
donnée sur les rejets d'effluents. Par conséquent, le nouveau règlement sur les effluents des
systèmes de traitement des eaux usées qui a été mis en œuvre en juin 2012 a incité les PN à élaborer
des stratégies à long terme axées sur l'application des normes et des protocoles, la formation des
opérateurs et les investissements dans les infrastructures.

Une solution qui a été proposée par notre laboratoire pour améliorer les performances des systèmes
lagunaires est l'intégration d'une ozonation à faible dose aux lagunes pour augmenter la
biodégradabilité des eaux usées, tout en préservant les populations microbiennes responsables de
leur traitement. Lors de récents travaux antérieurs, deux essais pilotes ont été effectués au cours
desquels une fraction volumique de 15% d'une lagune a été ozonée à faible dose afin d'accélérer
la dégradation de la matière organique. Les résultats préliminaires étaient prometteurs, mais en
raison de la difficulté à contrôler et à prévoir les conditions de la lagune, une étude plus
approfondie était nécessaire pour confirmer le rôle de l'ozone dans les essais pilotes. Par
conséquent, l'objectif de cette thèse était d'étudier le rôle de l'ozone en développant une stratégie
d'essais à l'échelle de laboratoire pour étudier et optimiser l'intégration de l'ozonation aux systèmes
lagunaires pour l'amélioration de la qualité des eaux traitées. De plus, une analyse économique
préliminaire a été réalisée pour évaluer les coûts liés à l'intégration de l'ozonation aux systèmes
lagunaires.

La conception expérimentale a été centrée sur la simulation des conditions aérobies dans un
système lagunaire en effectuant un traitement biologique dans un bioréacteur de laboratoire. Les
expériences ont été menées de manière discontinue pour traiter les eaux usées synthétiques à l'aide
de boues brutes pré-incubées collectées dans une station lagunaire locale. Chaque expérience a été
réalisée pendant une durée de 12 heures et impliquait l'ozonation de 25% du contenu du bioréacteur
à différentes doses d'ozone au cours des différentes phases de croissance des bactéries (c'est-à-dire
latence, exponentielle et stationnaire). La partie ozonée était ensuite remise dans le bioréacteur
pour poursuivre le traitement biologique. L'impact sur les taux d'élimination de la DCO, la
croissance bactérienne et la biodégradabilité de contaminants préoccupants (carbamazépine,
atrazine, ibuprofène, naproxène et gemfibrozil) a été évalué. Au cours de la phase de
développement de la méthode, il a été constaté que l'exécution de l'ozonation vers la fin de la phase
de latence (t = 5,5 heures) génère une réponse dans la croissance de la biomasse et l'élimination de
la matière organique. En fait, dans des expériences menées dans des eaux usées 100% synthétiques,

                                                  4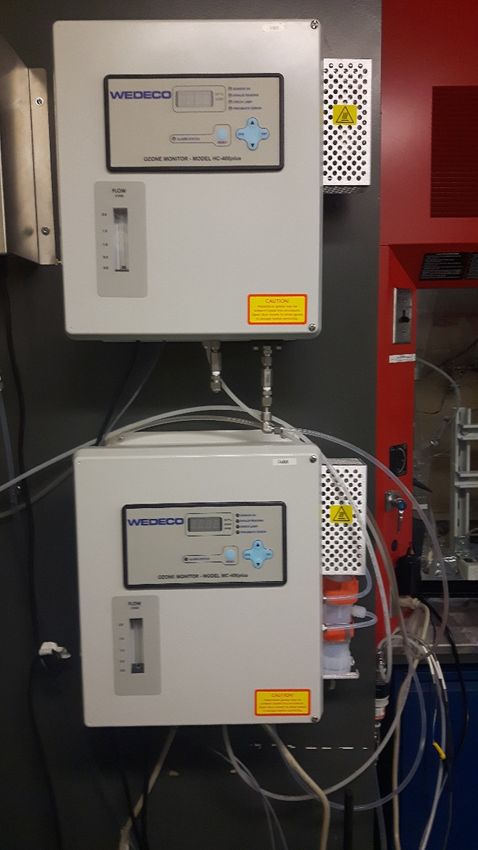
Research Thesis                                                                        Alungulesa ©

l'ozonation de 25% du volume à une dose de 10 mg O3 / L a augmenté le taux de croissance
spécifique de la biomasse à 0,671 h-1 comparativement à 0,603 h-1 observé pour le contrôle. De
même, une élimination plus élevée de la DCO a été observée, comme indiqué par un rapport final
DCO/DCOo de 0,68 au lieu de 0,73 pour le contrôle. Lors de l'utilisation d'un mélange à 50%
d'eaux usées brutes et synthétiques pour considérer une matrice plus complexe, le taux de
croissance spécifique a de nouveau été augmenté à 0,439 h-1 comparativement à 0,306 h-1 pour le
contrôle. Le rapport final DCO/DCOo a suivi une tendance similaire avec des valeurs de 0,88 et
0,80 dans les expériences de contrôle et d'ozonation, respectivement. Ces résultats suggèrent que
l'ozonation précoce pourrait améliorer la croissance de la biomasse, ce qui facilite finalement
l'absorption de matière organique. Pour les contaminants d’intérêt émergent, bien que l'ozonation
partielle ait conduit à une élimination significative de certains composés, elle n'a pas favorisé une
dégradation biologique supplémentaire. Cependant, afin de capter tout le potentiel de l'intégration
d'ozonation à faible dose dans un système lagunaire, il serait bénéfique de mener les expériences
présentées dans cette thèse en utilisant une plus large gamme de doses d'ozone et de conditions
environnementales, et de préférence dans les eaux usées brutes.

Enfin, l'analyse économique préliminaire a indiqué que l'utilisation d'une unité d'ozonation
partagée entre les stations lagunaires est une option peu coûteuse par rapport aux autres alternatives
conventionnelles. Cependant, pour les lagunes qui nécessitent une amélioration significative de
l'efficacité du traitement ou qui sont gravement sous-dimensionnées, il semble que cette stratégie,
bien que très économique, puisse ne pas être suffisante. Si les résultats obtenus sont étayés par
davantage d'expériences, l'ozonation à faible dose pourrait potentiellement être utilisée comme
solution à court terme pour aider les gestionnaires du système lagunaire à atteindre la conformité.

                                                  5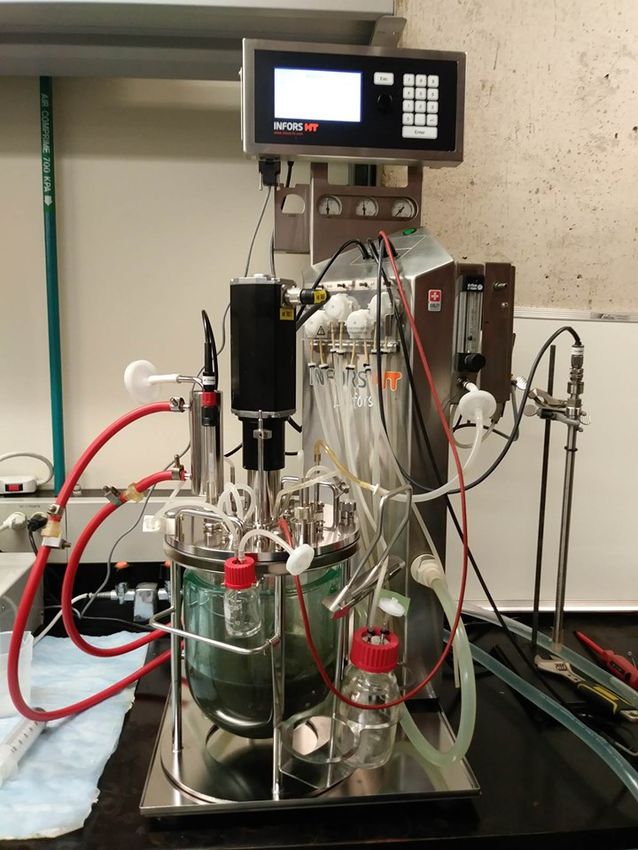
Research Thesis                                                                      Alungulesa ©

Acknowledgements
First and foremost, I would like to express my sincere gratitude to my supervisor, Dr. Viviane
Yargeau, for giving me the opportunity to participate in her research. I would like to thank her for
her guidance, support, and encouragement throughout the last two years.

I would like to thank the members of the 3Cs lab group, past and present. Marco Pineda and Marie-
Line Peyot for their constant help and for always taking the time to share their knowledge and
experience with me. Thank you to Beau Schlageter for sharing his knowledge of the project with
me. Linda, Yasmine, Chelsea, Elena, Kalyssa, Brent and Lena for making it a joy to come to the
lab every day! I also wish to thank Chris Metcalfe and Michael Doran for their help and
collaboration on this project, and Professor S. Omanovic for agreeing to be the internal reviewer
for my thesis.

Final big thanks to my friends and family for their support!

                                                 6
Research Thesis                                                                                                                                Alungulesa ©

Table of Contents
Abstract .......................................................................................................................................... 2
Résumé............................................................................................................................................ 4
Acknowledgements ........................................................................................................................ 6
List of figures ................................................................................................................................. 9
List of tables ................................................................................................................................. 12
Abbreviations ............................................................................................................................... 13
1      Introduction ......................................................................................................................... 14
    1.1        Background............................................................................................................................... 14
    1.2        Previous work ........................................................................................................................... 15
    1.3        Objectives .................................................................................................................................. 15
2      Literature Review ................................................................................................................ 16
    2.1        Lagoon Treatment Systems ..................................................................................................... 16
       2.1.1       Fate of suspended solids, organic matter and ammonia in lagoons ..................................................... 16
       2.1.2       Natural processes occurring in a lagoon .............................................................................................. 17
       2.1.3       Factors affecting lagoon treatment performance .................................................................................. 19
    2.2        Ozonation .................................................................................................................................. 20
    2.3        Integration of ozonation to biological treatment ................................................................... 21
       2.2.1       Effects of ozone on organic matter ...................................................................................................... 22
       2.2.2       Effects of ozone on nitrogenous compounds ....................................................................................... 26
       2.2.3       Effects of ozone on suspended solids ................................................................................................... 27
       2.2.4       Full-scale applications .......................................................................................................................... 28
3      Methodology ......................................................................................................................... 31
    3.1        Bacterial inoculum ................................................................................................................... 31
    3.2        Synthetic wastewater and Wastewater source ...................................................................... 32
    3.3        Bioreactor and ozonation system ............................................................................................ 34
    3.4        Experimental protocol for each test ....................................................................................... 36
       3.4.1       PHASE I – Sludge conditioning........................................................................................................... 36
       3.4.2       PHASE II – Control run ....................................................................................................................... 38
       3.4.3       PHASE III – Ozonation........................................................................................................................ 40
    3.5        Characterization of samples .................................................................................................... 42
       3.5.1       Determination of chemical oxygen demand......................................................................................... 42
       3.5.2       Determination of ammonia concentration ............................................................................................ 42
       3.5.3       Quantification of contaminants of emerging concern .......................................................................... 43
4      Results and Discussion ........................................................................................................ 44
    4.1        Characterization of bacterial inoculum and optimization of biological treatment............ 44
       4.1.1       Reproducibility and biological growth in the bioreactor ..................................................................... 44
       4.1.2       Synthetic wastewater volume change .................................................................................................. 46
       4.1.3       Ammonia removal during biological treatment and presence of nitrifying bacteria ........................... 47

                                                                                 7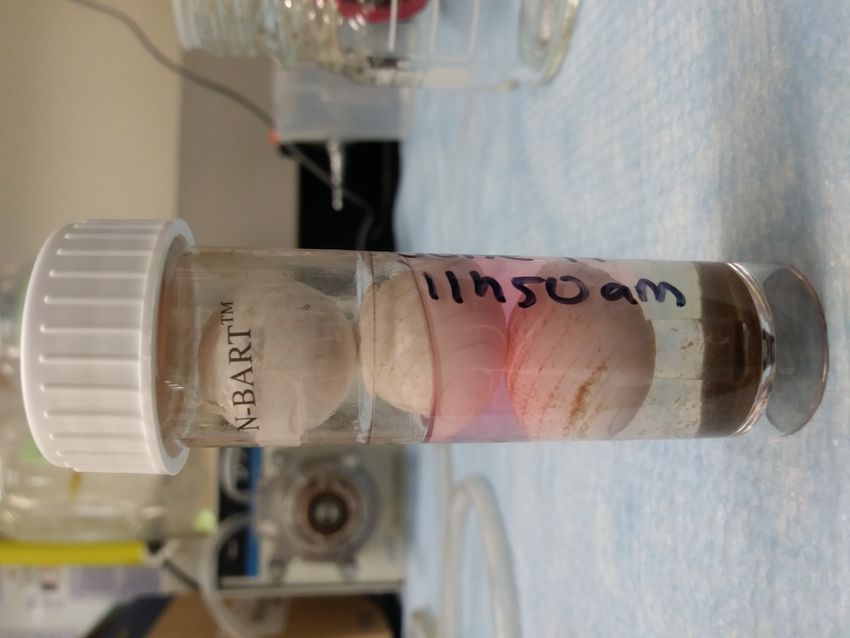
Research Thesis                                                                                                                                     Alungulesa ©

    4.2        Integration of ozonation to biological treatment experiments ............................................. 49
       4.2.1      Time of ozonation ................................................................................................................................ 49
       4.2.2      Wastewater matrix................................................................................................................................ 53
       4.2.3      Temperature ......................................................................................................................................... 55
    4.3        Assessment of the integration of ozonation to biological treatment .................................... 57
       4.3.1      Quantification of the impact on the growth rate of integrating ozone ................................................. 57
       4.3.2      pH levels ............................................................................................................................................... 59
       4.3.3      Dissolved oxygen levels ....................................................................................................................... 61
    4.4        Contaminants of emerging concern........................................................................................ 62
       4.4.1      Removal of CECs in the ozonated portion ........................................................................................... 62
       4.4.2      Removal of CECs in biological treatment with integrated ozonation .................................................. 63
5      Preliminary Economic Analysis ......................................................................................... 66
    5.1        Preliminary costs for the integration of ozonation to lagoons based on lab-scale results . 66
       5.1.1      Determination of the CAPEX and OPEX costs for a shared ozonation unit ....................................... 67
    5.2        Lagoon A Case Study ............................................................................................................... 70
       5.2.1      General information on the existing lagoon A system ......................................................................... 70
       5.2.2      Upgrade strategies proposed in 2017 ................................................................................................... 70
Conclusion .................................................................................................................................... 72
Limitations ................................................................................................................................... 73
Future work ................................................................................................................................. 74
References .................................................................................................................................... 75
Appendix I – Determination of chemical oxygen demand, COD ............................................ 82
Appendix II – Determination of ammonia ................................................................................ 86
Appendix III – Ozonation system setup .................................................................................... 89
Appendix IV – CECs matrix interaction ................................................................................... 90
Appendix V – Summary of experiments ................................................................................... 92

                                                                                   8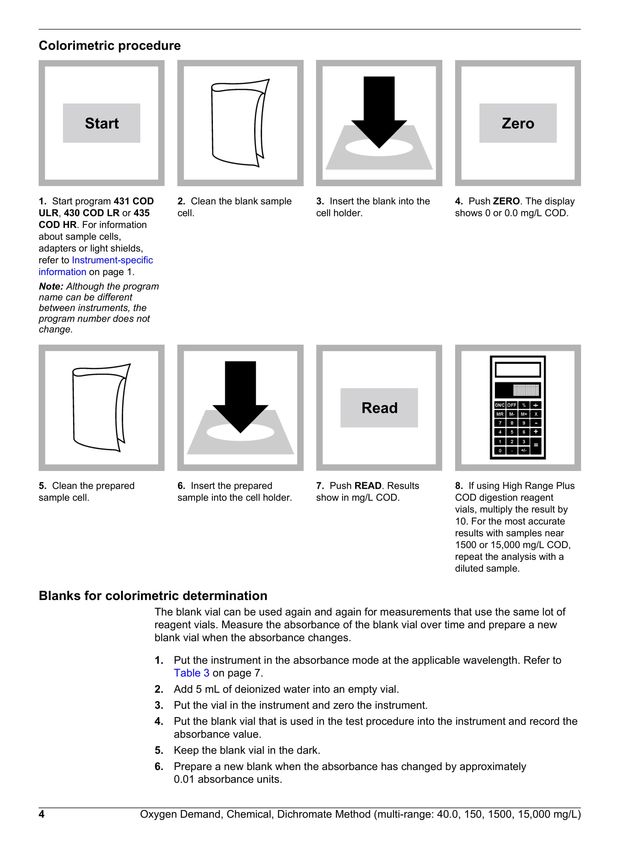
Research Thesis                                                                                                                      Alungulesa ©

List of figures
Figure 1. Biochemistry of a wastewater lagoon system, adapted from (Smith Engineering, 1995)
 ....................................................................................................................................................... 17
Figure 2. Lagoon layer differentiation due to seasonal variation ................................................. 20
Figure 3. BOD/COD as a function of ozone dosage .................................................................... 24
Figure 4. Settled lagoon sludge .................................................................................................... 32
Figure 5. Bioreactor setup ............................................................................................................ 35
Figure 6. Ozonation system schematic used in the 3Cs laboratory (Chassaing, 2018). LPM =
L/min, KI = Potassium Iodide ....................................................................................................... 36
Figure 7. Bioreactor setup for sludge conditioning ...................................................................... 37
Figure 8. H-BART test tubes. The wastewater sample is placed in a test tube where it is colored
with methylene blue (left). Bleaching of the methylene blue solution from bottom to top
indicates the presence of aerobic heterotrophic bacteria (center). The number of days after which
the entire tube is bleached (right) indicates the abundance of bacteria present (less days, higher
biomass). ........................................................................................................................................ 37
Figure 9. N-BART tubes. The wastewater sample is placed in a test tube for five days (left) to
allow for nitrification to occur. After the incubation period, a chemical reagent is added to detect
the product of nitrification (nitrite). The pink coloration (right) indicates presence nitrite, and
therefore of nitrifying bacteria. The stronger the coloration, the higher the concentration of
nitrifying bacteria. ......................................................................................................................... 38
Figure 10. Conditioned sludge after settling (left). Bioreactor contents at the start of the
experiment (center). Bioreactor contents after biomass growth (right)......................................... 39
Figure 11. Ozonation reactor ........................................................................................................ 40
Figure 12. Cell growth curve ........................................................................................................ 41
Figure 13. Biomass growth using sludge samples collected on different days. Total experiment
duration ranging from 12 to 25 hours at 25°C, 150 rpm mixing and initial DOsat levels. The error
bars indicate that for each time point, three separate samples were collected to measure the
OD600. ............................................................................................................................................ 45
Figure 14. Biomass growth in control runs with SWW volume change at 45 hours (CTL 3, left)
and 22 hours (CTL 4, right). Experiment conducted at 25°C, 150 rpm mixing and initial DOsat
levels. The error bars indicate that for each time point, three separate samples were collected to
measure the OD600. ........................................................................................................................ 47
Figure 15. Relationship between COD and TAN evolutions throughout biological treatment.
Total experiment duration of 45 hours at 25°C, 150 rpm mixing and initial DOsat levels. ........... 48
Figure 16. Biological treatment conducted over extended period of time to verify presence of
nitrifying bacteria. Total experiment duration of 205 hours at 25°C, 150 rpm mixing and initial
DOsat levels. ................................................................................................................................... 49
Figure 17. Biomass growth. Total experiment duration ranging from 96 to 98 hours at 25°C,
150 rpm mixing and initial DOsat levels. Ozonation conditions: ozonated fraction = 25% of total
volume (approx. 400 ml), ozone dose= 15 mg O3/L for EXP 5 and 20 mg O3/L for EXP 6. CTL:
control run – only biological treatment; EXP: biological treatment + ozonation (at t=25-26 hrs).
The error bars indicate that for each time point, three separate samples were collected to measure
the OD600. ...................................................................................................................................... 50

                                                                            9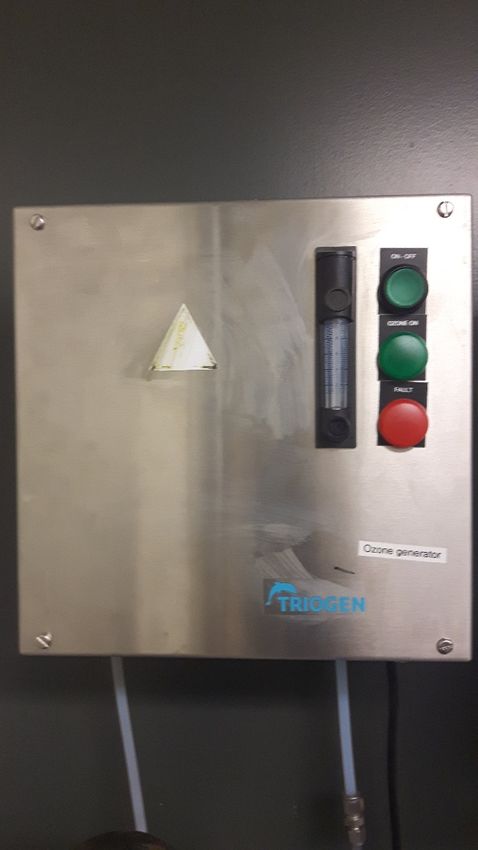
Research Thesis                                                                                                                  Alungulesa ©

Figure 18. Biomass growth (left) and COD removal (right). Total experiment duration 26 hours
at 25°C, 150 rpm mixing and initial DOsat levels. Ozonation conditions: ozonated fraction = 25%
of total volume (approx. 400 ml), ozone dose= 20 mg O3/L. CTL: control run – only biological
treatment; EXP: biological treatment + ozonation (at t=8.4 hrs). The error bars indicate that for
each time point, three separate samples were collected to measure the OD600. ............................ 51
Figure 19. Biomass growth (left) and COD removal (right). Total experiment duration 12 hours
at 25°C, 150 rpm mixing and initial DOsat levels. Ozonation conditions: ozonated fraction = 25%
of total volume (approx. 400 ml), ozone dose= 10 mg O3/L. CTL: control run – only biological
treatment; EXP: biological treatment + ozonation (at t=5.5 hrs). The error bars indicate that for
each time point, three separate samples were collected to measure the OD600. The ozonation
experiments were performed in triplicates (n=3). ......................................................................... 52
Figure 20. Biomass growth in 50:50 synthetic:raw wastewater. Total experiment duration of 12
hours at 25°C, 150 rpm mixing and initial DOsat levels. Ozonation conditions: ozonated fraction
= 25% of total volume (approx. 400 ml), ozone dose= 10 mg O3/L. CTL: control run – only
biological treatment; EXP: biological treatment + ozonation (at t=5.5 hrs). The error bars
indicate that for each time point, three separate samples were collected to measure the OD600.
The ozonation experiments were performed in triplicates (n=3). ................................................. 54
Figure 21. Comparison of COD removal in different water matrices (100 % SWW and 50%
mixture of raw and synthetic wastewater). .................................................................................... 55
Figure 22. Biomass growth in 50:50 synthetic:raw wastewater. Total experiment duration of 12
hours at 15°C, 150 rpm mixing and initial DOsat levels. Ozonation conditions: ozonated fraction
= 25% of total volume (approx. 400 ml), ozone dose= 10 mg O3/L. CTL: control run – only
biological treatment; EXP: biological treatment + ozonation (at t=5.5 hrs). ................................ 56
Figure 23. Biomass growth in 50:50 synthetic:raw wastewater. Total experiment duration of 12
hours at 15°C, 150 rpm mixing and initial DOsat levels. Ozonation conditions: ozonated fraction
= 25% of total volume (approx. 400 ml), ozone dose= 10 mg O3/L. CTL: control run – only
biological treatment; EXP: biological treatment + ozonation (at t=5.5 hrs for EXP 24 and t=15.5
hrs for EXP 26). ............................................................................................................................. 56
Figure 24. Specific growth rate. Total experiment duration 12 hours at 25°C, 150 rpm mixing
and initial DOsat levels. Ozonation conditions: ozonated fraction = 25% of total volume (approx.
400 ml), ozone dose= 10 mg O3/L. CTL: control run – only biological treatment; EXP: biological
treatment + ozonation (at t=5.5 hrs). ............................................................................................. 58
Figure 25. Specific growth rate in 50:50 synthetic:raw wastewater. Total experiment duration of
12 hours at 25°C, 150 rpm mixing and initial DOsat levels. Ozonation conditions: ozonated
fraction = 25% of total volume (approx. 400 ml), ozone dose= 10 mg O3/L. CTL: control run .. 59
Figure 26. pH levels. Total experiment duration 12 hours at 25°C, 150 rpm mixing and initial
DOsat levels. Ozonation conditions: ozonated fraction = 25% of total volume (approx. 400 ml),
ozone dose= 10 mg O3/L. CTL: control run – only biological treatment; EXP: biological
treatment + ozonation (at t=5.5 hrs). The ozonation experiments were performed in triplicates
(n=3). ............................................................................................................................................. 60
Figure 27. pH levels in 50:50 synthetic:raw wastewater. Total experiment duration of 12 hours
at 25°C, 150 rpm mixing and initial DOsat levels. Ozonation conditions: ozonated fraction = 25%
of total volume (approx. 400 ml), ozone dose= 10 mg O3/L. CTL: control run – only biological
treatment; EXP: biological treatment + ozonation (at t=5.5 hrs). Ozonation experiments were
performed in triplicates (n=3). ....................................................................................................... 61
Figure 28. Dissolved oxygen levels during experiments 14-18. .................................................. 62

                                                                         10
Research Thesis Alungulesa ©
Figure 29. Removal of selected contaminants of emerging concern in 100% synthetic
wastewater; final concentrations (t = 12 hours). ........................................................................... 63
Figure 30. Removal of selected contaminants of emerging concern in a 50% mixture of raw and
synthetic wastewater; final concentrations (t = 12 hours). ............................................................ 64
Figure 31. The runtime of an ozonation session based on the fraction of a lagoon volume to be
ozonated using a 50 gpm pumping capacity.................................................................................. 68
Figure 32. Electricity (kWh) and diesel consumption (L) based on runtime -left. Cost of
electricity and diesel based on runtime. ........................................................................................ 69
Figure 33. Triogen ozone generator (left) and Wedeco ozone detectors (right) (Schlageter, 2018)
....................................................................................................................................................... 89
Figure 34. Interaction of selected CECs with the dissolved organic matter present in the
synthetic wastewater. ..................................................................................................................... 91
11Research Thesis Alungulesa ©
List of tables
Table 1. Wastewater Effluent Quality Objectives (Minister of Justice, 2012) ............................. 14
Table 2. Ozone effects on the biodegradability of various types of wastewater .......................... 23
Table 3. Ozone effects on ammonia in various types of wastewater ............................................ 27
Table 4. Ozone effects on suspended solids in various types of wastewater................................ 28
Table 5. Full-scale combined ozonation and biological treatment technologies .......................... 29
Table 6. Synthetic wastewater recipe ........................................................................................... 33
Table 7. Wastewater characteristics.............................................................................................. 33
Table 8. Biomass growth in various media................................................................................... 34
Table 9. List of selected CECs, adapted from (Schlageter, 2018) ................................................ 34
Table 10. Bioreactor operation parameters ................................................................................... 38
Table 11. COD removal capability of the lagoon bacteria ........................................................... 46
Table 12. Direct effect of ozonation on CECs in the ozonated portion (25% of the total volume)
in different wastewater matrices. ................................................................................................... 63
Table 13. Summary of equipment information provided by Aclarus (Aclarus, 2020). ................ 67
Table 14. Ozone doses based on various ozone production rates and water pumping rates. ....... 67
Table 15. CAPEX summary ......................................................................................................... 68
Table 16. OPEX summary ............................................................................................................ 69
Table 17. Projected Wastewater Production ................................................................................. 70
Table 18. Costs associated with the proposed alternatives ........................................................... 71
Table 19. Summary of experiments .............................................................................................. 92
12Research Thesis Alungulesa ©
Abbreviations
Abbreviation Definition
BOD Biodegradable Oxygen Demand (mg/L)
cBOD Carbonaceous Biodegradable Oxygen Demand (mg/L)
cBOD-5 cBOD measured over 5 days (mg/L)
COD Chemical Oxygen Demand (mg/L)
DO Dissolved Oxygen (mg/L)
DOsat Dissolved Oxygen at saturation(mg/L)
TSS Total Suspended Solids (mg/L)
TDS Total Dissolved Solids (mg/L)
FN First Nations
WW Wastewater
SWW Synthetic Wastewater
WSERs Wastewater Systems Effluent Regulations
TAN Total Ammonia Nitrogen
CECs Contaminants of Emerging Concern
WWTP Wastewater Treatment Plant
TKN Total Kjeldahl Nitrogen (mg/L)
MLVSS Mixed Liquor Volatile Suspended Solids (mg/L)
WWTP Wastewater Treatment Plant
OD600 Optical density at 600 nm
DOM Dissolved organic matter
CAPEX Capital expenditure
OPEX Operational expenditure
13Research Thesis Alungulesa ©
1 Introduction
1.1 Background
The ever-growing environmental pressures of managing domestic wastewater is a pressing matter
for smaller and remote communities in Canada, especially for First Nations (FN) communities.
Due to financial restrictions and lack of human resources, many of them opt to treat their
wastewater using lagoons as opposed to other conventional wastewater treatment such as activated
sludge. Lagoon systems are comprised of one or more pond-like bodies of water that receive, hold
and treat wastewater through natural processes (Metcalf & Eddy et al., 2013).
As a response to the pervasive and longstanding issues of water infrastructure quality and
maintenance, the Government of Canada introduced the First Nations Water and Wastewater
Action Plan (Islam & Yuan, 2018). This was based on a 2011 extensive study done by Neegan
Burnside in which 97% of First Nations participated. A total of 532 wastewater systems serving
418 First Nations were examined. It was found that lagoons are the most common type of
treatment, of which 41% are facultative lagoons and 11% are aerated lagoons (Neegan Burnside,
2011). This national assessment revealed that 18% of lagoon-based treatments did not meet federal
effluent discharge limits and that 24% of the aerated lagoons and 47% of the facultative lagoons
were not reporting any effluent discharge data (Neegan Burnside, 2011). Consequently, the new
wastewater systems effluent regulations (WSER) that were implemented in June 2012 provided
an incentive for FNs to develop long-term strategies that focus on enforcing standards and
protocols, operator training and infrastructure investments (Minister of Justice, 2012). These
regulations, shown in Table 1, were put in place for wastewater treatment systems that are designed
to discharge wastewater effluent to natural receiving waters at a daily influent volume of 100 m3
per day or more, which is the case for many FN lagoons (Minister of Justice, 2012).
The WSER limits came into force on January 1, 2015, but the monitoring provisions came into
effect on January 1, 2013. According to a latest study led by Neegan Burnside in 2014-2015, 6%
of wastewater systems were identified as high risk and 41% as medium risk as opposed to 14 and
51% in 2011, respectively (Islam & Yuan, 2018). This risk analysis used was based on five
elemental weighing risks of effluent discharge (20%), system design (25%), operations (25%),
reporting (10%), and operators (20%) of the respective wastewater treatment facility (INAC,
2011). Overall, that assessment indicated that many municipalities were still struggling to adapt
their wastewater systems in order to follow the newly established regulations. However, the
timeline to for these municipalities to upgrade their wastewater treatment infrastructure is until
2040.
Table 1. Wastewater Effluent Quality Objectives (Minister of Justice, 2012)
Parameter Objective Source
cBOD-5 25 mg/L Provincial
TSS 25 mg/L Provincial
Unionized ammonia 1.25 mg/L Federal
expressed as nitrogen
14Research Thesis Alungulesa ©
Therefore, considering the widespread use of sewage lagoons across First Nations in Canada
coupled with a growing demand for safer and cleaner water, there is a need to investigate
new affordable and easily scalable processes to improve the effluent quality of municipal
wastewater from lagoon-based treatments.
1.2 Previous work
A solution that has been proposed by our laboratory was the integration of low dose ozonation to
lagoons as an integrated system to increase the biodegradability of wastewater (Larcher &
Yargeau, 2013; Schlageter, 2018). Ozone is an extremely reactive oxidant and is typically used as
a disinfection step after biological treatment (Metcalf & Eddy et al., 2013) but it can also be used
to speed up biological processes by partially oxidizing compounds found in wastewater, with the
goal of increasing their biodegradability in the subsequent biological treatment (Gottschalk, Libra,
& Saupe, 2008). Therefore, it was hypothesized that integrating ozonation to lagoons might
facilitate the assimilation of contaminants by microorganisms and ultimately assist municipalities
in reaching the required effluent discharge limits.
This project is a continuation of Beauregard Schlageter’s Master’s thesis (Schlageter, 2018)
supervised by Prof. Yargeau, which consisted primarily of conducting two pilot tests of integrating
ozone to lagoon treatment. The pilot tests were carried out at two FN communities in Ontario
where 15% of the volume of the secondary lagoons was ozonated prior to seasonal discharge.
These were conducted in partnership with Aclarus Ozone Water Systems and Trent University. At
both locations, results confirmed that statistically significant decreases in BOD and total ammonia
were observed. In addition, some preliminary ozonation laboratory experiments were performed
on synthetic wastewater (SWW) at various ozone doses with a mix of three non-pathogenic
bacterial species often found in wastewater effluent. The aim was to attempt to emulate lagoon
conditions. However, the results obtained demonstrated that no significant changes were observed
for the parameters that actually decreased during the pilot tests and revealed issues with the
methodology used to mimic the biological treatment at lab-scale.
1.3 Objectives
Based on the previous work presented above, further investigation was required to confirm the role
of ozone in the pilot tests and obtain a suitable methodology for lab-scale investigation of strategies
to integrate ozone to lagoon treatment. Therefore, the specific objectives of this research were to:
1. Develop a testing strategy at laboratory scale to investigate and optimize the
integration of ozonation to lagoon systems for enhancement of wastewater quality.
2. Perform a preliminary financial analysis to assess the economic feasibility of
integrating ozonation to lagoon systems.
The main challenges that were addressed throughout the development of the methodology
involved obtaining a consortium of microorganisms that would be representative of the biomass
present in a lagoon and optimizing the use of ozone so that it enhances biodegradability without
preventing biodegradation from occurring.
15Research Thesis Alungulesa ©
2 Literature Review
2.1 Lagoon Treatment Systems
2.1.1 Fate of suspended solids, organic matter and ammonia in lagoons
Lagoons are commonly used as passive treatment systems for municipal wastewater in remote
communities due to their low cost where land is available, simple design and operation, and
minimal operator expertise required. The complex natural ecosystem that develops in a facultative
lagoon is fundamental to its use for wastewater treatment. The incoming wastewater is treated
naturally through a combination of physical, biological and chemical processes. This type of
treatment mainly favours the partial removal of suspended solids (TSS) through settling and the
removal of biodegradable material (BOD) through degradation by various bacteria and
microorganisms present in the lagoon. Suspended solids are particles present water that can be
classified into various groups depending of their source; living or nonliving, size, mineral or
organic, dispersed as individual entities or associated in flocs (Zucker et al., 2015).
The importance of removing these two contaminants (i.e. TSS and BOD) is derived from the
negative impacts they have on the aquatic environment. For instance, a discharge of waste
containing high levels of BOD into water leads to an increased oxygen uptake by bacteria
necessary for the degradation of the incoming organic waste. This leads to a depletion of oxygen
in the water creating anoxic conditions and killing other aquatic species. As for the suspended
solids, they can increase the turbidity of water, which affects light penetration and can potentially
reduce photosynthesis leading to lower daytime release of oxygen. As well, fine particles can
damage sensitive gill structures of fish.
Although lagoons were not initially designed for ammonia removal, they are now required by
federal regulations to decrease the level of unionized ammonia to 1.25 mg-N/L or less. Nitrogen
is introduced into a lagoon via the influent water which usually contains organic nitrogen N from
fecal matter and other organic material. Through microbial activity, this organic nitrogen gets
converted into unionized ammonia NH3 and ammonium ion NH4 +, which can be measured as the
total ammonia nitrogen (TAN). This process is termed ammonification. Unionized ammonia can
react with water to form the ammonium ion as presented in the chemical equilibrium in equation
1. This equilibrium is pH and temperature dependent, with higher pH value (i.e. pH levels above
9) and temperature favouring the formation of unionized ammonia (Rezagama, Hibbaan, & Arief
Budihardjo, 2017). This latter form is toxic to aquatic organisms because it is uncharged and lipid
soluble which allows it to permeate through biological membranes more easily (Körner, Das,
Veenstra, & Vermaat, 2001).
!"! + "" $ ⇌ !"#$ + $"% (1)
16Research Thesis Alungulesa ©
2.1.2 Natural processes occurring in a lagoon
Since a facultative lagoon is not artificially aerated, both aerobic and anaerobic conditions coexist,
and three distinct layers form naturally as seen in Figure 1. The top layer is the aerobic zone where
most of the dissolved oxygen is introduced through algae photosynthesis, and the mixing of the
water surface by wind or rain. An equilibrium is established between algae that utilize sunlight,
carbon dioxide along with nutrients and ammonia to release oxygen, and bacteria that utilize this
oxygen to metabolize various biodegradable matter present in the wastewater into nutrients,
releasing carbon dioxide. The dead algae and bacteria cells re-enter the food chain as organic
matter that is to be degraded by various microorganisms. Therefore, aerobic treatment of the
wastewater in this layer provides odor control, nutrient and BOD removal (EPA, 2011). The depth
of this layer is dependent on the climate, the amount of sunlight and wind, and the growth of algae
(Casey, Knott, Hause, Favley, & Gloyd, 1997).
The bottom layer is the anaerobic zone where no oxygen is present. This zone also includes a layer
of sludge which forms due to the settling of suspended solids present in the wastewater. In this
layer, anaerobic bacteria utilize incoming organic material and metabolize it to various organic
acids and emit carbon dioxide, methane, ammonia and hydrogen sulfide. The anaerobic treatment
of the wastewater involves processes such as sludge digestion, denitrification and some BOD
removal (EPA, 2011).
Figure 1. Biochemistry of a wastewater lagoon system, adapted from (Smith Engineering, 1995)
The middle zone is the transition between the aerobic and the anaerobic layers where both of these
conditions exist. To avoid leaks to the groundwater below, lagoons are usually lined with material
such as clay or an artificial liner.
The microbial populations in a lagoon are loosely grouped as heterotrophs as they metabolize
mainly organic carbon, as well as a portion of nitrogen and other nutrients required for cell growth.
Heterotrophs have a very fast growth rate which renders them very resilient to environmental
stresses. The bacteria responsible for uptaking most of the nitrogen are autotrophs and are
classified as nitrifying bacteria. They have a much slower growth rate compared to heterotrophs
17Research Thesis Alungulesa ©
which makes them more sensitive to stresses such as seasonal change in temperature (i.e. winter
and spring snowmelt). In fact, efficiency of nitrification drops significantly at low temperatures
(Water Pollution Control Federation, 1998).
The mechanisms through which NH3 is removed from lagoons are:
1. Volatilization
Unionized ammonia is gaseous and will volatilize. The degree of volatilization is
dependent on the fraction of unionized ammonia in the lagoon which is pH and temperature
dependent as mentioned above. Mixing conditions will affect the magnitude of the mass
transfer. Therefore, at lower temperatures when biological activity is decreased and the
lagoon water is well mixed due to wind, the main process of ammonia removal is
volatilization (EPA, 2011).
2. Biological nitrification
This process involves the biological sequential oxidation of ammonia into nitrite NO2–
and nitrate NO3- as presented in equation 2 and 3:
!"! + $" ⇌ !$"% + 3"$ + ' % (2)
!$"% + "" $ ⇌ !$!% + 2"$ + ' % (3)
The bacteria associated with the first step are Nitrosomonas and those associated with the
second step are Nitrobacter (EPA, 2002).
It should be noted that nitrification will only occur once cBOD levels are low as nitrifying
bacteria do not compete well against BOD-removing bacteria (Smith Engineering, 1995).
A portion of the nitrate produced can undergo denitrification which reduces it into nitrogen
gas (N2) as depicted in equation 4. Some of the species of bacteria involved in this process
include Pseudomonas, Micrococcus, Achromobacter and Bacillus (EPA, 2011).
6!$!% + 5+"! $" → 3!" + 5+$" + 7"" $ + 6$"% (4)
These reactions are taking place within the bottom sediments under anoxic conditions in
facultative lagoons and are affected by temperature, redox potential and sediment
characteristics. In lagoons equipped with adequate mixing and aeration, denitrification is
negligible (EPA, 2011).
As well, the low concentrations of nitrates/nitrites measured in lagoon effluents indicate
that nitrification is generally not a significant process in terms of ammonia removal from
lagoons (Pano & Middlebrooks, 1982). However, the presence of nitrates in a natural body
18Research Thesis Alungulesa ©
of water can be detrimental to its ecosystem as it is assimilated by algae and stimulates
eutrophication.
3. Assimilation into biomass
The NO3– that is produced during the nitrification process as well as a portion of NH4+ can
be taken up by organisms to produce N-containing compounds such as proteins. Ammonia
assimilation in algal biomass could also account for a significant portion of its removal
given adequate conditions. It should be noted that this type of removal may result in
apparent reductions in ammonia, but unless algae is removed from the water, once the algae
starts to decay, whatever it had assimilated will get released back into the water body.
All of these processes are affected by temperature, DO concentration, pH levels, retention times
and wastewater characteristics. It is important to note that seasonal variations have a direct impact
on microbial and algae growth which subsequently affects the conversion of organic nitrogen into
its other forms.
Finally, the wastewater is kept inside the lagoon until the quality parameters meet the required
criteria. The wastewater is then discharged to natural water bodies.
2.1.3 Factors affecting lagoon treatment performance
As the use of a lagoon is mainly dictated by natural biological processes, its performance is highly
dependent on factors such as temperature, sunlight, dissolved oxygen and pH. These factors are in
turn affected by seasonal changes, which consequently leads to limitations in cold- climate
lagoons. In regions subject to colder weather, lagoons may spend several months per year covered
by an ice sheet blocking the diffusion of oxygen subsequently inhibiting aerobic processes. Below
freezing temperatures along with the lack of sunlight also slow down microbial activity. Therefore,
the performance of a cold-climate lagoon is tightly related to seasonal changes.
One of the immediate consequences of operating a lagoon in a cold-climate region such as Canada
is the discharge schedule, which is intermittent, and typically occurring once a year. The discharge
may occur in spring to take advantage of the higher flow rates from the receiving waters, or during
summer/early fall as this period provides a higher quality effluent in terms of BOD removal, but
may have a higher TSS concentration due to algae (Tilsworth & Smith, 1984). However,
discharging the lagoon once per year means that the wastewater must be retained in the lagoon for
one year which requires the use of a large land area.
The fundamental parameter that enables a lagoon to be used as a wastewater treatment system is
algal growth as this is simultaneously a nutrient sink and an oxygen provider to
heterotrophic/aerobic bacteria that enhance biodegradation of BOD. Once again, in cold-climate
regions, algal growth is limited to several months during summer during which efficient BOD
removal is provided. Figure 2 shows how the seasons affect the different layers found in a lagoon.
In spring, the increased sunlight melts the ice sheet covering the lagoon and warms up the top layer
of the lagoon which creates convection currents disturbing the thermal stratification that settled in
19Research Thesis Alungulesa ©
during the winter months. The increased turbulence results in benthal feedback which is when the
sludge accumulated at the bottom containing nutrients and other organic and inorganic material
gets released back into the lagoon (Hill, 2015b). This may result in temporarily higher ammonia
and BOD levels.
Figure 2. Lagoon layer differentiation due to seasonal variation
During summer, as the amount of sunlight increases and temperature rises, algae proliferates and
utilizes the nutrients released from the sludge, releasing oxygen in the lagoon. Most of the
biodegradable matter is metabolized by bacteria during this period.
As fall and winter approach, the decrease in temperature can have a considerable effect on lagoon
performance (Hill, 2015a):
• Causes destratification: as the temperature begins to drop, the top layer of the lagoon gets
colder and sinks which displaces the warmer water layer at the bottom to the top;
• Builds up BOD: metabolism of bacteria and algae slows down with decreased
temperature;
• Reduces DO: this is caused by ice covering the lagoon preventing intake of oxygen; and
• Creates sludge: BOD degradation is almost halted as the level of DO decreases, therefore
allowing easily degradable BOD to settle at the bottom increasing the sludge volume of the
lagoon.
2.2 Ozonation
Ozone (O3) is a highly unstable gas that is generated from oxygen molecules. It is typically
produced at the point of use and the most common method used is a corona discharge. Ozone is
formed as the electrical discharge ionizes oxygen molecules which then combine with molecular
oxygen.
Ozone is much more soluble in water than oxygen. When dissolved in water, it can undergo
reactions with some water matrix components. Ozone is an electrophile with high selectivity that
reacts mainly with double bonds, activated aromatic rings and non-protonated amines. However,
20Vous pouvez aussi lire


