L'économie canadienne peut-elle encore surprendre en 2020? - Matthieu Arseneau Chef économiste adjoint / Directeur général Économie et Stratégie

La page est créée Audrey Vaillant
 
CONTINUER À LIRE
L'économie canadienne peut-elle encore surprendre en 2020? - Matthieu Arseneau Chef économiste adjoint / Directeur général Économie et Stratégie
L’économie canadienne peut-elle
encore surprendre en 2020?

Matthieu Arseneau
Chef économiste adjoint / Directeur général
Économie et Stratégie

Cercle finance du Québec
15 janvier 2020
L'économie canadienne peut-elle encore surprendre en 2020? - Matthieu Arseneau Chef économiste adjoint / Directeur général Économie et Stratégie
Canada
L'économie canadienne peut-elle encore surprendre en 2020? - Matthieu Arseneau Chef économiste adjoint / Directeur général Économie et Stratégie
Canada: Des surprises positives pour l’économie et l’inflation
Indices de surprises économiques (Citigroup), 2019

             60                                                                                                      Canada

             50

             40

             30

             20
                      AUS
  Économie

                                                                                         Surprises
             10                                                 JAP                      positives

              0
                                                                CHI
             -10                                                      Surprises
                                                                      négatives                                      GBR
                                                    USA           Monde
             -20
                                                           EM

             -30
                                                             EUR
             -40
                -26   -24   -22   -20   -18   -16    -14   -12    -10   -8   -6     -4    -2    0    2   4   6   8    10      12
                                                                                  Inflation
 FBN Économie et Stratégie (Données via Bloomberg)
                                                                                                                                   3
L'économie canadienne peut-elle encore surprendre en 2020? - Matthieu Arseneau Chef économiste adjoint / Directeur général Économie et Stratégie
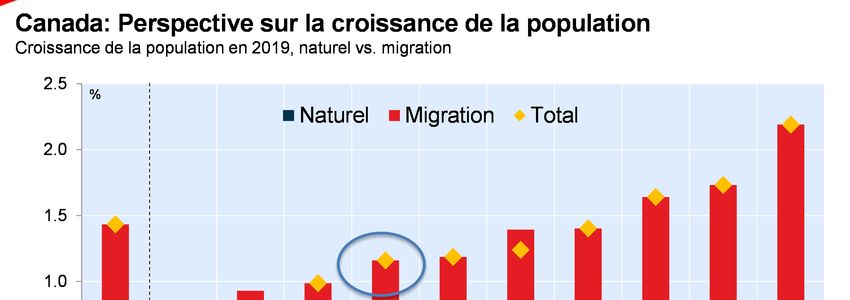
Canada : Une année faste pour l’emploi
Variation de l’emploi de décembre 2018 à décembre 2019

  350     Milliers                     Deuxième meilleure année
                                       dans l’expansion actuelle
  300

  250

  200

  150

  100

    50

     0

   -50
           Total                Temps      Temps            Public   Privé   Trav.    Hauts     Bas
                                 plein     partiel                           Aut.    salariés salariés
FBN Économie et Stratégie (données de Statistique Canada)
                                                                                                     4
L'économie canadienne peut-elle encore surprendre en 2020? - Matthieu Arseneau Chef économiste adjoint / Directeur général Économie et Stratégie
5
L'économie canadienne peut-elle encore surprendre en 2020? - Matthieu Arseneau Chef économiste adjoint / Directeur général Économie et Stratégie
Canada : Plus forte inflation des salaires en dix ans
Variations du salaire horaire pour des postes permanents (%, sur 12 mois)

4.8
      %

4.4

4.0

3.6

3.2

2.8

2.4

2.0

1.6

1.2

0.8
      1998     2000       2002       2004      2006       2008   2010   2012   2014   2016   2018   2020

   FBN Économie et Stratégie (données de Statistique Canada)
                                                                                                      6
L'économie canadienne peut-elle encore surprendre en 2020? - Matthieu Arseneau Chef économiste adjoint / Directeur général Économie et Stratégie
L’inflation de base à un niveau inégalé depuis dix ans
 Moyenne des trois mesures de base préférées de la Banque du Canada
2.8
      Var. a/a (%)
2.7
2.6
2.5
2.4
2.3
2.2                                                                                                                   +2.2%
2.1
                                                        Point médian de la fourchette cible de la BdC
2.0
1.9
1.8
1.7
1.6
1.5
1.4
1.3
      2007      2008   2009     2010    2011     2012      2013     2014     2015      2016     2017    2018   2019     2020

  FBN Économie et Stratégie (données de Statistique Canada)
                                                                                                                              7
L'économie canadienne peut-elle encore surprendre en 2020? - Matthieu Arseneau Chef économiste adjoint / Directeur général Économie et Stratégie
Taux directeur de la Banque du Canada vs. Règle de Taylor FBN

4.8                                                                           Règle de Taylor
      %
4.4                                                  Taux directeur═ β1 (inflation de base moins la cible) + β2 (Taux de
                                                     chômage moins TCIS) + β3 (Taux neutre) + β4 (Indice de stress
4.0                                                  financier FBN)

3.6

3.2

2.8

2.4                                                                                                     Règle de Taylor

2.0

1.6
                                                                                                                 Taux
1.2                                                                                                              directeur

0.8

0.4

0.0
          2002         2004         2006          2008      2010       2012        2014        2016       2018         2020
NBF Economics and Strategy (data via Refinitiv)
                                                                                                                             8
Regard sur les hypothèques à renouveler
Taux hypothécaire 5 ans actuel, taux contractuel des hypothèques à renouveler, % à renouveler
            Assuré             Non-Assuré
4.0                                                                                                      30
      %                          Jan 2019                                                        %   %

3.8
            Jan 2019                              24                    24                               25
3.6

3.4                                                                                                      20
                                                                                                19
3.2                             Jan 2020
                                                                                                         15
3.0          Jan 2020                                                                      2.9

2.8
                                                    2.8                                                  10
                                                                       2.7
2.6
                                                                                                         5
2.4

2.2                                                                                                      0
       Taux 5 ans actuel*   Taux 5 ans actuel*     2020               2021                2022

                            Taux hypothécaire (gauche)       % à renouveler (droite)
* Banques disponibles
FBN Économie et Stratégie
                                                                                                             9
Une mesure d’aide fiscale qui bénéficie aux ménages
Impact financier net du projet d’augmentation du montant personnel de base, par année budgétaire

 7
      $ milliards
                                                                                             6.2
                                                                            6.0
 6

                                                                  5.1
 5

                                        4.1
 4              3.7

 3

 2

 1

 0
            2020-21*                 2021-22                    2022-23   2023-24          2024-25

* Inclut $690 millions prévus pour l’exercice 2019-2020
FBN Économie et Stratégie (données du ministère des Finances)
                                                                                                     10
Canada: La confiance des entreprises s’améliore
Enquête sur les perspectives des entreprises, emploi & indicateur agrégé (12 prochains mois)

                                                                                                                60
       Unités standardisés                                                                               %
                                                                                                                50

                                                                                                                40

                                                                                           Intentions           30
                                                                                        d’embauche (R)
                                                                                                                20
  4
                                                                                                                10
  2
                                                                                                                0
  0
                                                                                                                -10
  -2                                                                                    Indicateur agrégé (G)

  -4

  -6

  -8

-10
       2002        2004        2006         2008      2010   2012     2014       2016           2018
 FBN Économie et Stratégie (Données via Datastream)
                                                                                                                      11
Canada: Rebond du nombre de logements vendus
Données désaisonnalisées; dernière observation: Novembre 2019

48
      000
46
                                                                                                 Nombre de
44                                                                                               logements
                                                                                                 vendus
42

40
                                                                                   Moyenne
38                                                                                 sur 10 ans

36

34

32

30

28

26

24
     1998     2000       2002        2004       2006   2008   2010   2012   2014   2016         2018
 FBN Économie et stratégie (données via CREA)
                                                                                                         12
Canada: Pas de laxisme quant aux critères d’octroi
Proportion des prêts hypothécaires accordés avec une cote de crédit faible (Score
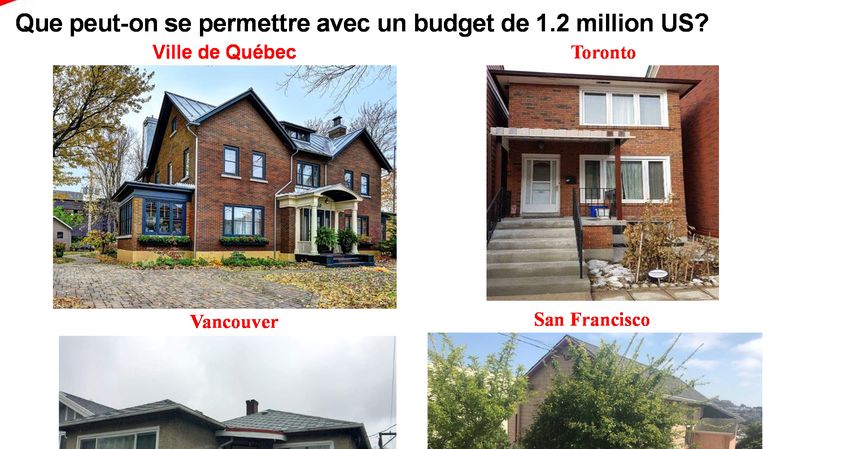
Canada : Mise en perspective de l’abordabilité du logement
Paiement hypothécaire mensuel sur le prix d’un logement médian (amortissement, 25 ans; terme, 5 ans)

100
         % du revenu médian

 90
                                                                                               Vancouver

 80

 70

 60
                                                                                                    Toronto

 50

 40                                                                                                 Canada

                                                                                                   Montréal
 30

 20
              1985            1990            1995           2000             2005   2010   2015              2020
 FBN Économie et Stratégie (données de Statistique Canada, Teranet-BNC, ACI
                                                                                                                14
Canada: Perspective sur la croissance de la population
Croissance de la population en 2019, pays de l’OCDE
 1.6
          %
          %
 1.4

 1.2

 1.0                    Naturel          Migration           Total
 0.8

 0.6

 0.4

 0.2

 0.0

 -0.2

 -0.4

 -0.6
        JAP PRT DEU POL GRC CZE ITA FIN FRA AUT NLD GBR DNK BEL CHE ESP NZL USA SWE NOR AUS MEX CAN
 FBN Économie et Stratégie (Données via Statistique Canada et U.S. Census)
                                                                                                      15
16
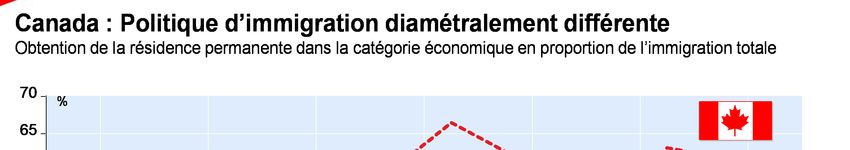
Canada : Le plus d’immigrants directement employables de l’OCDE
Délivrance annuelle de la résidence permanente dans la catégorie économique (2016)

 180
          Milliers

 160

 140

 120

 100

   80

   60

   40

   20

    0

 FBN Économie et Stratégie (l’OCDE data https://data.oecd.org/migration/permanent-immigrant-inflows.htm#indicator-chart)
                                                                                                                           17
Canada : La population née à l’étranger a un niveau de scolarité élevé
Pourcentage de la population immigrante de 25-64 ans ayant des études tertiaires (2017)

  CAN
  AUS
   IRE
   NZL
  MEX
  SWE
  DEN
   SWI
  USA
 OECD
   BEL
  PRT
  FRA
  AUT
  NLD
  ESP
  DEU
  GRC
    ITA                                                                                        %

          0               10              20     30           40            50            60       70
 FBN Économie et Stratégie (données de l’OCDE)
                                                                                                    18
Canada: Perspective sur la cohorte des premiers acheteurs de maison
Variation de la population et immigration (25 à 44 ans)

                                                                                                                    60
                                                       En 2018 et 2019, plus de 55%                          %
           Individus                                                                                                56
                                                       des immigrants étaient âgés
                                                            de 25 à 44 ans (d)                                      52

                                                                                                                    48

                                                                                                                    44
                                                                                                                    40

                                                                                                                    36
 300,000
                                                                                                                    32
 250,000
                                                                                                  Population (g)    28
 200,000

 150,000                                                                        Immigration (g)

 100,000
  50,000

       0

 -50,000

-100,000
                 1975       1980        1985       1990       1995   2000     2005     2010        2015      2020
 FBN Économie et Stratégie (Données via Statistique Canada)
                                                                                                                    19
Canada: Perspective sur l’endettement des 25 à 44 ans
Dette au revenu disponible pour la population âgée de 25 à 44 ans (2016)

  300

                                             253
  250                                                            Pourtant, rien d’indique que les familles
                                                                 immigrantes sont en situation de vulnérabilité
                                                                 financière:
                            203
  200                                                                   -58% paient leurs cartes de crédit en
                                                                        totalité (52% pour les natifs)

                                                                        -2% utilisent des prêts sur salaires (6%
  150                                                                   pour les natifs)

  100

    50                                                                                  32          27

     0
                            Endettement total                                     Dette excluant hypothèques

                                   Nés au Canada                    Immigrants (moins de 10 ans)
 FBN Économie et Stratégie (Données via « The Wealth of immigrants » de Statistique Canada)
                                                                                                                   20
Québec
Québec: Perspective sur la croissance économique
Croissance du PIB au Québec et au Canada

 5.0
       T/T % annualisé
 4.5
 4.0
                                                                                           QUE
 3.5
 3.0
 2.5
 2.0
 1.5
 1.0
                                                                                      Canada
 0.5
 0.0
-0.5
-1.0
-1.5
-2.0
-2.5
            2014               2015                2016               2017   2018   2019         2020
 FBN Économie et Stratégie (Données via Conference Board of Canada)
                                                                                                   22
Québec: Le taux de chômage sous la moyenne nationale
Taux de chômage au Québec et dans le reste du Canada (rdc)

 16
       %
 15

 14

 13

 12

 11

 10

  9

  8

  7                                                                                          Reste du
                                                                                             Canada
  6

  5
                                                                                               QC
  4
             1980          1985          1990             1995   2000   2005   2010   2015     2020
NBF Economics and Strategy (data via Statistics Canada)
                                                                                                    23
Canada: Perspective sur l’inflation salariale
Salaire horaire moyen des employés permanents

 6.5
       % (a/a) – moyennes trimestrielles
                                                                                                    QC
 6.0

 5.5

 5.0
                                                                                                    ON
 4.5
                                                                                                    CA
 4.0

 3.5

 3.0

 2.5

 2.0

 1.5

 1.0

 0.5

 0.0

-0.5
          1998       2000      2002        2004    2006   2008   2010   2012   2014   2016   2018   2020
 FBN Économie et Stratégie (Données via Statcan)
                                                                                                         24
Taux directeur de la Banque du Canada vs. Règle de Taylor FBN

                                                                                    Règle de Taylor
4.8
      %
                                                          Taux directeur═ β1 (inflation de base moins la cible) + β2 (Taux de
4.4                                                       chômage moins TCIS) + β3 (Taux neutre) + β4 (Indice de stress
                                                          financier FBN)
4.0

3.6

3.2                                                                                                    Québec – en utilisant la
                                                                                                       règle nationale (2.90%)
2.8

2.4                                                                                                                   Canada
                                                                                                                      (2.30%)
2.0

1.6
                                                                                                                Taux directeur
1.2                                                                                                                (1.75%)

0.8

0.4

0.0
          2002       2004         2006         2008          2010         2012      2014        2016       2018        2020
NBF Economics and Strategy (data from Bloomberg, Refinitiv, Statistics Canada)
                                                                                                                                25
Québec: Le plus haut taux d’épargne des ménages depuis T3 1995
Épargne nette en % du revenu disponible des ménages

24
      %
22
20
18
16
14
12
10                                                                                                              Québec

  8
  6
  4
                                                                                                                 RdC
  2
  0
 -2
               1985            1990             1995            2000             2005            2010    2015      2020
 FBN économie et stratégie, données de l’Institut de la Statistique du Québec et de Statistique Canada
                                                                                                                         26
Québec: Une année record en 2019
Nombre de transactions dans le marché de la revente

                                                                                                                22
                                                                                                        (000)
        (000)
                                                                                                                21
                                                                                                                20

12                                                                                                              19
                                                                                                       ON (r)
                                                                                                                18
11
                                                                                                                17
10                                                                                                              16

 9                                                                                                              15
                                                                                                                14
                                                                                                  QUE (l)
 8
                                                                                                                13
 7                                                                                                              12
                                                                                                  BC (r)
 6                                                                                                              11
                                                                                                                10
 5                                                                                           ALB (r)

 4
                                                                                          Reste du Canada (l)
 3
       2008       2009       2010       2011    2012   2013   2014   2015   2016   2017      2018       2019
 FBN Économie et Stratégie (Données via CREA)
                                                                                                                27
28
Québec: L’endettement des ménages sous la moyenne nationale
Endettement des ménages en % du revenu disponible, 2017

  220
          %

                                                                    197   200
  200

                                                              180
  180
                                          173

  160
                  149

  140

  120

  100
                  QUE                     CAN                 ONT   BC    ALB
 FBN Économie et Stratégie (Données via Statistique Canada)
                                                                                29
Québec: Perspective sur la dette gouvernementale
Dette brute en % du PIB (Comptes publics)
                                                                                            Prévision
     % du PIB
58
57
56
55
54
53
52
51
50
49
48
47
46
45
44
43
42
         1998     2000       2002   2004   2006   2008   2010   2012   2014   2016   2018   2020
 FBN Économie et Stratégie
                                                                                                   30
Québec: L’économie opère au dessus de sa capacité
Écart en pourcentage entre le PIB et le PIB potentiel (Réel)

 6
      %
 5

 4                                     Demande
                                       excédentaire                                              Québec
 3

 2

 1
                                                                                                   Canada
 0

-1

-2

-3                                                                  Offre
                                                                    excédentaire
-4

-5

-6
             1985           1990           1995              2000        2005      2010   2015   2020
 FBN Économie et Stratégie (données de Statistique Canada)
                                                                                                          31
Québec: Perspective historique sur l’équilibre budgétaire*
Solde budgétaire en % du PIB (2019-2020) vs. écart de production en % du PIB (2019)

                     1.2
                                % du PIB
                     1.0                                                                                                      2018
                     0.8
                                                                     2016                               2017                                      2000
                     0.6                                     2015                   2006
                     0.4                                                                         2007

                     0.2                                                                                                                   2019
                                              1998                                               2005                                                2020
  Solde budgétaire

                     0.0
                                                                     2014                                       1999
                     -0.2                                                                                                       2002
                                                                                                    2003
                     -0.4                                2012                                                     2004
                                                                                                                             2001
                     -0.6
                                                            2013
                                                                          2011                           2008
                     -0.8
                     -1.0
                                                         2010
                     -1.2        1997
                                                     2009
                     -1.4
                     -1.6
                                1996                                                                                                       % du PIB potentiel
                     -1.8
                         -2.8    -2.4      -2.0   -1.6   -1.2      -0.8     -0.4   0.0     0.4     0.8      1.2        1.6    2.0    2.4       2.8       3.2    3.6
                                                                                   Écart de production
 * Au sens de la loi sur l’équilibre budgétaire (après versements aux Fonds des générations)
 FBN Économie et Stratégie
                                                                                                                                                                32
33
34
Québec: Perspective sur l’immigration et résidents non-permanents
Immigration et residents non-permanents de juillet à juin l’année suivante

95,000
            individus
90,000

85,000

80,000                  Immigration
75,000                  Résidents non-permanents ex. interceptions GRC
                                                                                                             3m
70,000                  Interceptions GRC
65,000

60,000

55,000

50,000

45,000

40,000

35,000

30,000
                2002        2004        2006         2008        2010         2012      2014   2016   2018
 FBN Économie et Stratégie (données via Statistique Canada et Gouvernement du Canada)
                                                                                                              35
Une migration interprovinciale nette positive est-elle envisageable?
Québec: Migration interprovinciale nette et écart de taux de chômage entre le Québec et le Canada

 5.0                                                                                                              0

 4.5                                                                                                              -4,000

 4.0                                                                                                              -8,000

 3.5                                                                                            Migration         -12,000
                                                                                                interprovincial
 3.0                                                                                            nette (r)         -16,000

 2.5                                                                                                              -20,000

 2.0                                                                                                              -24,000

 1.5                                                                                                              -28,000

 1.0                                                        Écart de taux de                                      -32,000
                                                           chômage entre le
 0.5                                                      Québec et le reste du                                   -36,000
                                                              Canada (g)
 0.0                                                                                                              -40,000

-0.5                                                                                                              -44,000

-1.0                                                                                                              -48,000
              1980        1985        1990        1995        2000      2005      2010   2015        2020
 FBN Économie et Stratégie (données via Statistique Canada)
                                                                                                                       36
Canada: Perspective sur l’intégration au marché du travail
Taux de chômage de la population née au pays et des immigrants pour Québec et le reste du Canada

                   Canada ex. Québec                                                             Québec
15                                                                   15
     %                                                                    %
14                                                                   14
                                                                                         Immigrants
13                                                                   13

12
                                                                     12
11
                                                                     11
10                  Immigrants
                                                                     10
 9
                   Total
                                                                     9
 8                                                                                      Total
                                                                     8
 7
                      Natifs
                                                                     7
 6                                                                                      Natifs

 5                                                                   6

 4                                                                   5

 3                                                                   4
     2006   2008    2010       2012   2014   2016   2018      2020        2006   2008   2010     2012   2014   2016   2018   2020

 FBN Économie et Stratégie (données par Statistique Canada)
                                                                                                                             37
Canada: Perspective sur la population active
Population active (2019)

 4,000      (000)
             Immigrants=53%
 3,500

 3,000

                      1,935
 2,500                                     Immigrants=29%
                                                                               Immigrants=6%
                                                                                     126
 2,000                                               682
                                                              Immigrants=43%
 1,500

                                                                   670
 1,000                                                                               2,085
                      1,648                         1,582

   500
                                                                   785

      0
                     Toronto                      Montreal       Vancouver       Québec ex MTL
 FBN Économie et Stratégie (Données via Statistique Canada)
                                                                                                 38
Sommaire des prévisions
___
Monde:
      - Croissance de 2.9% en 2019, accélération à 3.2% en 2020
      - Chine avec une croissance d’environ 6% grâce à des stimulus monétaire/budgétaire
      - Les risques géopolitiques demeureront source d’inquiétudes: protectionnisme, populisme

États-Unis:
      - Croissance de 2.3% en 2019 et 1.9% en 2020 avec une inflation un peu plus élevée
      - Les trois baisses de taux réalisées par la Réserve fédérale nous apparaissent suffisantes
      - Taux 10 ans de retour au dessus de 2.0%

Canada:
      - Croissance au Canada de 1.6% en 2019 et 1.8% en 2020, QC 2.9% en 2019 et 1.9% l’an prochain
      - Banque du Canada : Des baisses de taux ne sont pas nécessaires à ce moment-ci
      - USD/CAD vers les 1.25 dans les prochains mois? Prix du pétrole autour de 60$.
                                                                                                    39
General - This Report was prepared by National Bank Financial, Inc. (NBF), (a Canadian investment dealer, member of IIROC), an indirect wholly owned subsidiary of National Bank of Canada. National Bank of Canada is a public company listed on the Toronto Stock Exchange. The particulars
contained herein were obtained from sources which we believe to be reliable but are not guaranteed by us and may be incomplete and may be subject to change without notice. The information is current as of the date of this document. Neither the author nor NBF assumes any obligation to update the
information or advise on further developments relating to the topics or securities discussed. The opinions expressed are based upon the author(s) analysis and interpretation of these particulars and are not to be construed as a solicitation or offer to buy or sell the securities mentioned herein, and
nothing in this Report constitutes a representation that any investment strategy or recommendation contained herein is suitable or appropriate to a recipient’s individual circumstances. In all cases, investors should conduct their own investigation and analysis of such information before taking or
omitting to take any action in relation to securities or markets that are analyzed in this Report. The Report alone is not intended to form the basis for an investment decision, or to replace any due diligence or analytical work required by you in making an investment decision. This Report is for distribution
only under such circumstances as may be permitted by applicable law. This Report is not directed at you if NBF or any affiliate distributing this Report is prohibited or restricted by any legislation or regulation in any jurisdiction from making it available to you. You should satisfy yourself before reading it
that NBF is permitted to provide this Report to you under relevant legislation and regulations.

Canadian Residents - NBF or its affiliates may engage in any trading strategies described herein for their own account or on a discretionary basis on behalf of certain clients and as market conditions change, may amend or change investment strategy including full and complete divestment. The
trading interests of NBF and its affiliates may also be contrary to any opinions expressed in this Report. NBF or its affiliates often act as financial advisor, agent or underwriter for certain issuers mentioned herein and may receive remuneration for its services. As well NBF and its affiliates and/or their
officers, directors, representatives, associates, may have a position in the securities mentioned herein and may make purchases and/or sales of these securities from time to time in the open market or otherwise. NBF and its affiliates may make a market in securities mentioned in this Report. This
Report may not be independent of the proprietary interests of NBF and its affiliates. This Report is not considered a research product under Canadian law and regulation, and consequently is not governed by Canadian rules applicable to the publication and distribution of research Reports, including
relevant restrictions or disclosures required to be included in research Reports.

UK Residents - This Report is a marketing document. This Report has not been prepared in accordance with EU legal requirements designed to promote the independence of investment research and it is not subject to any prohibition on dealing ahead of the dissemination of investment research. In
respect of the distribution of this Report to UK residents, NBF has approved the contents (including, where necessary, for the purposes of Section 21(1) of the Financial Services and Markets Act 2000). This Report is for information purposes only and does not constitute a personal recommendation, or
investment, legal or tax advice. NBF and/or its parent and/or any companies within or affiliates of the National Bank of Canada group and/or any of their directors, officers and employees may have or may have had interests or long or short positions in, and may at any time make purchases and/or
sales as principal or agent, or may act or may have acted as market maker in the relevant investments or related investments discussed in this Report, or may act or have acted as investment and/or commercial banker with respect hereto. The value of investments, and the income derived from them,
can go down as well as up and you may not get back the amount invested. Past performance is not a guide to future performance. If an investment is denominated in a foreign currency, rates of exchange may have an adverse effect on the value of the investment. Investments which are illiquid may be
difficult to sell or realise; it may also be difficult to obtain reliable information about their value or the extent of the risks to which they are exposed. Certain transactions, including those involving futures, swaps, and other derivatives, give rise to substantial risk and are not suitable for all investors. The
investments contained in this Report are not available to retail customers and this Report is not for distribution to retail clients (within the meaning of the rules of the Financial Conduct Authority). Persons who are retail clients should not act or rely upon the information in this Report. This Report does not
constitute or form part of any offer for sale or subscription of or solicitation of any offer to buy or subscribe for the securities described herein nor shall it or any part of it form the basis of or be relied on in connection with any contract or commitment whatsoever.
This information is only for distribution to Eligible Counterparties and Professional Clients in the United Kingdom within the meaning of the rules of the Financial Conduct Authority. NBF is authorised and regulated by the Financial Conduct Authority and has its registered office at 71 Fenchurch Street,
London, EC3M 4HD. NBF is not authorised by the Prudential Regulation Authority and the Financial Conduct Authority to accept deposits in the United Kingdom.

U.S. Residents - With respect to the distribution of this report in the United States of America, National Bank of Canada Financial Inc. (“NBCFI”) which is regulated by the Financial Industry Regulatory Authority (FINRA) and a member of the Securities Investor Protection Corporation (SIPC), an affiliate
of NBF, accepts responsibility for its contents, subject to any terms set out above. To make further inquiry related to this report, or to effect any transaction, United States residents should contact their NBCFI registered representative. This report is not a research report and is intended for Major U.S.
Institutional Investors only. This report is not subject to U.S. independence and disclosure standards applicable to research reports.

HK Residents - With respect to the distribution of this report in Hong Kong by NBC Financial Markets Asia Limited (“NBCFMA”)which is licensed by the Securities and Futures Commission (“SFC”) to conduct Type 1 (dealing in securities) and Type 3 (leveraged foreign exchange trading) regulated
activities, the contents of this report are solely for informational purposes. It has not been approved by, reviewed by, verified by or filed with any regulator in Hong Kong. Nothing herein is a recommendation, advice, offer or solicitation to buy or sell a product or service, nor an official confirmation of any
transaction. None of the products issuers, NBCFMA or its affiliates or other persons or entities named herein are obliged to notify you of changes to any information and none of the foregoing assume any loss suffered by you in reliance of such information. The content of this report may contain
information about investment products which are not authorized by SFC for offering to the public in Hong Kong and such information will only be available to, those persons who are Professional Investors (as defined in the Securities and Futures Ordinance of Hong Kong (“SFO”)). If you are in any
doubt as to your status you should consult a financial adviser or contact us. This material is not meant to be marketing materials and is not intended for public distribution. Please note that neither this material nor the product referred to is authorized for sale by SFC. Please refer to product prospectus
for full details. There may be conflicts of interest relating to NBCFMA or its affiliates’ businesses. These activities and interests include potential multiple advisory, transactional and financial and other interests in securities and instruments that may be purchased or sold by NBCFMA or its affiliates, or in
other investment vehicles which are managed by NBCFMA or its affiliates that may purchase or sell such securities and instruments.
No other entity within the National Bank of Canada group, including National Bank of Canada and National Bank Financial Inc, is licensed or registered with the SFC. Accordingly, such entities and their employees are not permitted and do not intend to: (i) carry on a business in any regulated activity in
Hong Kong; (ii) hold themselves out as carrying on a business in any regulated activity in Hong Kong; or (iii) actively market their services to the Hong Kong public.
Copyright - This Report may not be reproduced in whole or in part, or further distributed or published or referred to in any manner whatsoever, nor may the information, opinions or conclusions contained in it be referred to without in each case the prior express written consent of NBF.

                                                                                                                                                                                                                                                                                                                  40
Vous pouvez aussi lire