ACOUSTIC MONITORING OF BATS WITH SELF-ORGANIZING MAPS - Scriptieprijs
←
→
Transcription du contenu de la page
Si votre navigateur ne rend pas la page correctement, lisez s'il vous plaît le contenu de la page ci-dessous
ACOUSTIC MONITORING OF BATS
WITH SELF-ORGANIZING MAPS
word count: 27693

Arne Deloose
Student ID: 0130272

Supervisor(s): prof. dr. Bernard De Baets and dr. ir. Michiel Stock
Tutor(s): ir. Laura Hoebeke

A dissertation submitted to Ghent University in partial fulfilment of the requirements for the
degree of master in Bioscience Engineering.
Academic year: 2018 - 2019
De auteur en promotors geven de toelating deze scriptie voor consultatie beschikbaar te
stellen en delen ervan te kopiëren voor persoonlijk gebruik. Elk ander gebruik valt onder
de beperkingen van het auteursrecht, in het bijzonder met betrekking tot de verplichting
uitdrukkelijk de bron te vermelden bij het aanhalen van resultaten uit deze scriptie.

The author and promoters give the permission to use this thesis for consultation and to
copy parts of it for personal use. Every other use is subject to the copyright laws, more
specifically the source must be extensively specified when using results from this thesis.

Gent, June 7th, 2019

The promoters,

prof. dr. Bernard De Baets                   dr. ir. Michiel Stock

The author,

Arne Deloose
DANKWOORD

Deze thesis had niet tot stand kunnen komen zonder de medewerking van een hele groep
mensen, die ik dan ook graag bedank in dit deel. Allereerst mijn promotors Michiel Stock en
Bernard De Baets. Zij hebben het onderwerp aangeboden en de samenwerking met INBO
mogelijk gemaakt. Ook voor advies en begeleiding waren zij steeds beschikbaar, alsook
het doorsturen van de vele interessante referenties over vleermuizen en dataverwerking.
Ook wil ik mijn tutor, Laura Hoebeke, bedanken om elke week tijd vrij te maken voor mijn
vele vragen en voor het lezen en verbeteren van de vele versies van deze dissertatie.

Verder wil ik het INBO bedanken voor het beschikbaar stellen van het onderwerp en de bi-
jhorende data, alsook voor de uitleg rond vleermuizen en geluidsverwerking. Veel van deze
data werd in hun vrije tijd verzameld en daarom verdienen deze mensen zeker een extra
bedanking. In het bijzonder wil ik Thierry Onkelinx bedanken, die mijn thesis begeleidde
vanuit het INBO.

De mensen van Natuurpunt, voor het organiseren van de `Nacht Van De Vleermuis’, wat
een zeer leerrijke avond was waar ik veel heb geleerd. Ook voor de vele informatie over
vleermuizen waarvan ik nuttig gebruik heb gemaakt, en de aanbeveling van het zeer nut-
tige boek `Veldgids-Vleermuizen van Europa’ van Dietz and Kiefer.

Deze thesis maakte gebruik van vrij veel software. Daarom zou ik graag de onderzoekseen-
heid KERMIT, met in het bijzonder Joris Meys en Jan Roels, bedanken voor hun uitleg rond
Python, LaTeX and GitHub. Verder nog Bac Nguyen Cong voor de code rond distance metric
learning.

Als laatste, Niels Hilderson en mijn familie voor de vele morele steun tijdens het schrijven
en programmeren.

Arne Deloose

Juni 2019
ii
CONTENTS

Dankwoord                                                                                                          i

Contents                                                                                                         vi

Nederlandstalige samenvatting                                                                                   vii

Summary                                                                                                          ix

Graphical abstract                                                                                               xi

List of abbreviations                                                                                           xiii

1 Introduction                                                                                                    1

  1.1 Problem statement . . . . . . . . . . . . . . . . . . . . . . . . . . . . . . . . . . . . . . . .           1

  1.2 Objectives . . . . . . . . . . . . . . . . . . . . . . . . . . . . . . . . . . . . . . . . . . . . . .      1

  1.3 Outline . . . . . . . . . . . . . . . . . . . . . . . . . . . . . . . . . . . . . . . . . . . . . . . .     2

2 Ecology and traits of bats                                                                                      3

  2.1 What are bats? . . . . . . . . . . . . . . . . . . . . . . . . . . . . . . . . . . . . . . . . . .          3

  2.2 Species and evolution . . . . . . . . . . . . . . . . . . . . . . . . . . . . . . . . . . . . . .           4

       2.2.1 Species of bats . . . . . . . . . . . . . . . . . . . . . . . . . . . . . . . . . . . . . .          4

       2.2.2 Bats in Belgium . . . . . . . . . . . . . . . . . . . . . . . . . . . . . . . . . . . . . .          6

  2.3 Ecological and economical importance . . . . . . . . . . . . . . . . . . . . . . . . . . .                  8

  2.4 Echolocation . . . . . . . . . . . . . . . . . . . . . . . . . . . . . . . . . . . . . . . . . . . . 10

       2.4.1 Overlap with other senses . . . . . . . . . . . . . . . . . . . . . . . . . . . . . . . 10

       2.4.2 Mechanism . . . . . . . . . . . . . . . . . . . . . . . . . . . . . . . . . . . . . . . . . 11

       2.4.3 Limitations of echolocation . . . . . . . . . . . . . . . . . . . . . . . . . . . . . . 12

       2.4.4 Evolution of echolocation . . . . . . . . . . . . . . . . . . . . . . . . . . . . . . . . 13

       2.4.5 Classification of echolocation . . . . . . . . . . . . . . . . . . . . . . . . . . . . . 14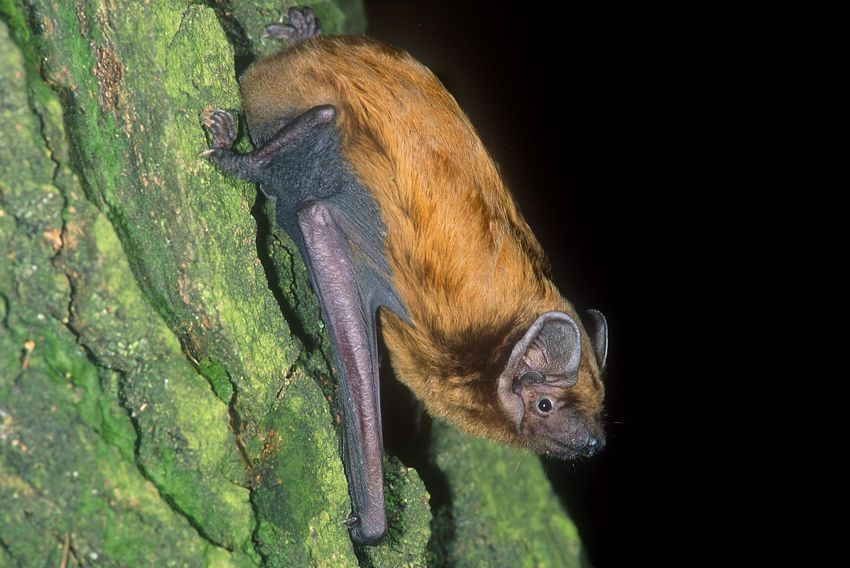
3 Conservation and monitoring of bats                                                                     17

  3.1 Threats . . . . . . . . . . . . . . . . . . . . . . . . . . . . . . . . . . . . . . . . . . . . . . . 17

  3.2 Conservation measures . . . . . . . . . . . . . . . . . . . . . . . . . . . . . . . . . . . . . 20

  3.3 Legislation . . . . . . . . . . . . . . . . . . . . . . . . . . . . . . . . . . . . . . . . . . . . . 20

       3.3.1 European Union . . . . . . . . . . . . . . . . . . . . . . . . . . . . . . . . . . . . . . 20

       3.3.2 Belgium . . . . . . . . . . . . . . . . . . . . . . . . . . . . . . . . . . . . . . . . . . . 21

  3.4 Non-governmental organizations . . . . . . . . . . . . . . . . . . . . . . . . . . . . . . . 22

  3.5 Current status . . . . . . . . . . . . . . . . . . . . . . . . . . . . . . . . . . . . . . . . . . . 23

       3.5.1 Worldwide . . . . . . . . . . . . . . . . . . . . . . . . . . . . . . . . . . . . . . . . . 23

       3.5.2 European Union . . . . . . . . . . . . . . . . . . . . . . . . . . . . . . . . . . . . . . 24

       3.5.3 Belgium . . . . . . . . . . . . . . . . . . . . . . . . . . . . . . . . . . . . . . . . . . . 24

  3.6 Monitoring . . . . . . . . . . . . . . . . . . . . . . . . . . . . . . . . . . . . . . . . . . . . . 25

       3.6.1 Non-audio methods . . . . . . . . . . . . . . . . . . . . . . . . . . . . . . . . . . . 25

       3.6.2 Audio methods . . . . . . . . . . . . . . . . . . . . . . . . . . . . . . . . . . . . . . 26

4 Ecoacoustics                                                                                            27

  4.1 What is ecoacoustics? . . . . . . . . . . . . . . . . . . . . . . . . . . . . . . . . . . . . . . 27

  4.2 Acoustic niche hypothesis and acoustic adaptation hypothesis . . . . . . . . . . . 27

  4.3 Applications of ecoacoustics . . . . . . . . . . . . . . . . . . . . . . . . . . . . . . . . . . 28

  4.4 Bat detectors . . . . . . . . . . . . . . . . . . . . . . . . . . . . . . . . . . . . . . . . . . . . 29

       4.4.1 Heterodyne detectors . . . . . . . . . . . . . . . . . . . . . . . . . . . . . . . . . . 30

       4.4.2 Frequency division detectors . . . . . . . . . . . . . . . . . . . . . . . . . . . . . 31

       4.4.3 Digital detectors . . . . . . . . . . . . . . . . . . . . . . . . . . . . . . . . . . . . . 31

  4.5 Commercial software for classification of bats . . . . . . . . . . . . . . . . . . . . . . 33

  4.6 Technical problems with bat detectors . . . . . . . . . . . . . . . . . . . . . . . . . . . 34

       4.6.1 Recording . . . . . . . . . . . . . . . . . . . . . . . . . . . . . . . . . . . . . . . . . . 34

       4.6.2 Variation in detectors . . . . . . . . . . . . . . . . . . . . . . . . . . . . . . . . . . 35

       4.6.3 Anomalies . . . . . . . . . . . . . . . . . . . . . . . . . . . . . . . . . . . . . . . . . 35

  4.7 Challenges with bat sounds . . . . . . . . . . . . . . . . . . . . . . . . . . . . . . . . . . 36

       4.7.1 Convergence . . . . . . . . . . . . . . . . . . . . . . . . . . . . . . . . . . . . . . . . 36

       4.7.2 Variation in calls . . . . . . . . . . . . . . . . . . . . . . . . . . . . . . . . . . . . . 36

       4.7.3 Interference . . . . . . . . . . . . . . . . . . . . . . . . . . . . . . . . . . . . . . . . 37

                                                     iv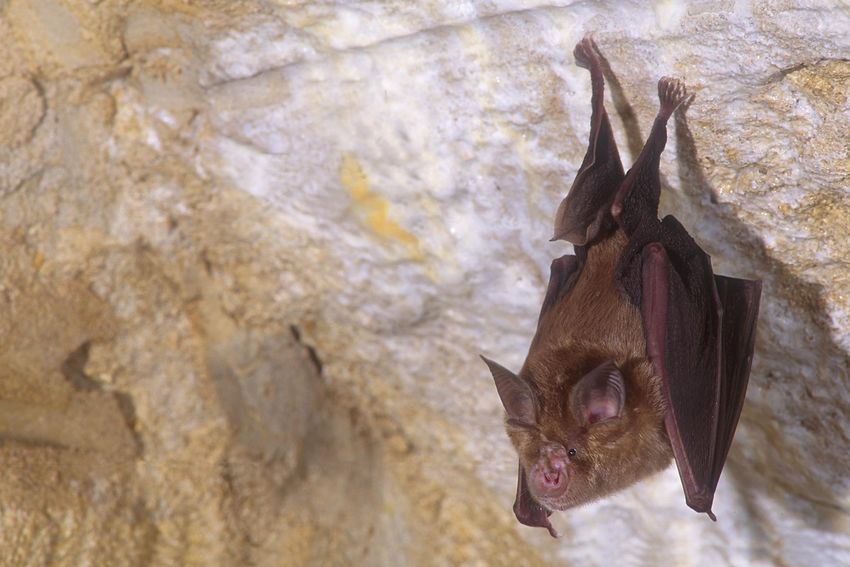
5 Machine learning for data analysis, classification and clustering                                        39

  5.1 What is machine learning? . . . . . . . . . . . . . . . . . . . . . . . . . . . . . . . . . . . 39

  5.2 Types of machine learning . . . . . . . . . . . . . . . . . . . . . . . . . . . . . . . . . . . 40

       5.2.1 Supervised learning . . . . . . . . . . . . . . . . . . . . . . . . . . . . . . . . . . . 40

       5.2.2 Unsupervised learning . . . . . . . . . . . . . . . . . . . . . . . . . . . . . . . . . 40

       5.2.3 Semi-supervised learning . . . . . . . . . . . . . . . . . . . . . . . . . . . . . . . 41

  5.3 Clustering methods . . . . . . . . . . . . . . . . . . . . . . . . . . . . . . . . . . . . . . . . 41

       5.3.1 K-means clustering . . . . . . . . . . . . . . . . . . . . . . . . . . . . . . . . . . . 41

       5.3.2 Self-organizing maps . . . . . . . . . . . . . . . . . . . . . . . . . . . . . . . . . . 42

  5.4 Distance metric learning . . . . . . . . . . . . . . . . . . . . . . . . . . . . . . . . . . . . 44

  5.5 Data transformation . . . . . . . . . . . . . . . . . . . . . . . . . . . . . . . . . . . . . . . 46

       5.5.1 Spectrograms and Fourier transformation . . . . . . . . . . . . . . . . . . . . . 46

       5.5.2 Scaleograms: wavelet transformation . . . . . . . . . . . . . . . . . . . . . . . 47

  5.6 Unbalanced data . . . . . . . . . . . . . . . . . . . . . . . . . . . . . . . . . . . . . . . . . 48

6 Pre-processing and clustering                                                                            51

  6.1 Data description . . . . . . . . . . . . . . . . . . . . . . . . . . . . . . . . . . . . . . . . . . 51

  6.2 Pre-processing . . . . . . . . . . . . . . . . . . . . . . . . . . . . . . . . . . . . . . . . . . . 53

       6.2.1 Transformation . . . . . . . . . . . . . . . . . . . . . . . . . . . . . . . . . . . . . . 53

       6.2.2 Region of interest extraction . . . . . . . . . . . . . . . . . . . . . . . . . . . . . 54

       6.2.3 Feature extraction . . . . . . . . . . . . . . . . . . . . . . . . . . . . . . . . . . . . 54

       6.2.4 Reference library . . . . . . . . . . . . . . . . . . . . . . . . . . . . . . . . . . . . . 58

  6.3 Analysis . . . . . . . . . . . . . . . . . . . . . . . . . . . . . . . . . . . . . . . . . . . . . . . 58

       6.3.1 Exploration methods . . . . . . . . . . . . . . . . . . . . . . . . . . . . . . . . . . 59

       6.3.2 Classification method: self-organizing map . . . . . . . . . . . . . . . . . . . . 59

       6.3.3 Visualization tool . . . . . . . . . . . . . . . . . . . . . . . . . . . . . . . . . . . . . 61

7 Results and discussion                                                                                   63

  7.1 Application of the tool . . . . . . . . . . . . . . . . . . . . . . . . . . . . . . . . . . . . . . 63

  7.2 Evaluation experiments . . . . . . . . . . . . . . . . . . . . . . . . . . . . . . . . . . . . . 66

       7.2.1 Description of the datasets . . . . . . . . . . . . . . . . . . . . . . . . . . . . . . 66

       7.2.2 Method: K-nearest neighbors and Kappa statistic . . . . . . . . . . . . . . . . 66

       7.2.3 Self-organizing maps . . . . . . . . . . . . . . . . . . . . . . . . . . . . . . . . . . 67

  7.3 Experiments . . . . . . . . . . . . . . . . . . . . . . . . . . . . . . . . . . . . . . . . . . . . 68

                                                     v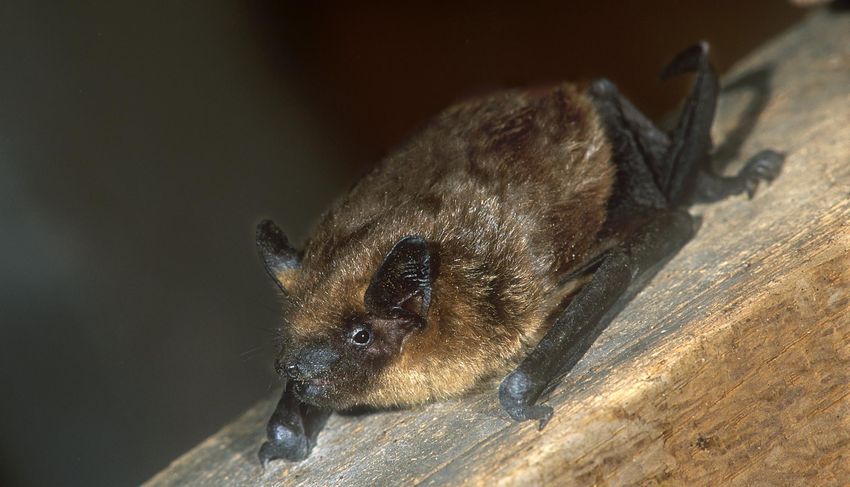
7.3.1 Experiment one: generalization within species . . . . . . . . . . . . . . . . . . 68

      7.3.2 Experiment two: influence of K and DML . . . . . . . . . . . . . . . . . . . . . 69

      7.3.3 Experiment three: generalization to different species . . . . . . . . . . . . . 71

8 Conclusions and future perspectives                                                        73

Bibliography                                                                                 75

                                             vi
SAMENVATTING

In Vlaanderen zijn er 18 soorten vleermuizen. Al deze soorten zijn beschermd onder Eu-
ropese en lokale wetgeving. Onder deze wetgeving moeten de populaties elke zes jaar ger-
apporteerd worden. Dit is vrij moeilijk gezien vleermuizen nachtdieren zijn en dus moeilijk
visueel te monitoren zijn.

Vleermuizen kunnen vliegen en jagen in complete duisternis. Hiervoor gebruiken ze echolo-
catie: ze zenden geluid uit en luisteren zorgvuldig naar de echo’s die terugkomen. Met deze
techniek kunnen vleermuizen hun omgeving in kaart brengen. Verschillende vleermuis-
soorten gebruiken verschillende geluiden, wat het mogelijk maakt om deze geluiden als
een monitoring techniek te gebruiken. Hiervoor worden hoogfrequente opnames gemaakt
en de resulterende spectrogrammen worden door experts geanalyseerd. Eén enkele nacht
op één locatie kan tot 1500 opnames bevatten, wat manuele labeling moeilijk maakt.

Data van het Instituut voor Natuur en Bos Onderzoek (INBO) wordt gebruikt om een prak-
tische tool te ontwikkelen. Deze tool maakt gebruik van self-organizing maps. Deze maps
maken gebruik van neuronen waarbij elk neuron een groep datapunten beschrijft. Het
resultaat hiervan is dat elke vleermuissoort gelinkt kan worden aan een of meerdere neuro-
nen. Als de geluiden reeds geclassificeerd waren, kan een neuron gelinkt worden met één
of meerdere vleermuissoorten. Als dit niet het geval is, kunnen enkele geluiden manueel
gelabeled worden en op basis hiervan kan een conclusie getrokken worden voor alle gelu-
iden die matchen met ditzelfde neuron. De data wordt dus verdeeld in groepen. De analyse
kan dan op groepsniveau gebeuren in plaats van op het niveau van individuele geluiden,
wat de analysetijd sterk verkort. Het doel van deze tool is dus niet de huidige analyse te
vervangen, maar eerder om deze efficiënter te laten verlopen. Hiermee kan een betere
monitoring van vleermuispopulaties gebeuren.
viii
SUMMARY

In Flanders there are 18 species of bats. All of these species are protected under European
and local laws. Under these laws, the populations must be reported every six years. Due
to the nocturnal nature of bats, visual monitoring is rather challenging.

Bats can fly and hunt in total darkness. To that end, they use echolocation: they emit
sounds and listen carefully to the echoes that return. Using this technique, bats can map
their surroundings. Different bat species use different sounds, which makes it possible to
use these sounds as a monitoring technique. To that end, high-frequency recordings are
made and the resulting spectrograms are analyzed by experts. For a single night in a single
location, this can result in more than 1500 recordings, which makes full manual labeling
difficult.

Data from the Research Institute for Nature and Forest (INBO) is used to develop a practical
tool. This tool uses self-organizing maps. These maps use neurons that describe a group of
datapoints. The result of this tool is that each bat species is tied to one or more neurons.
If sounds were already classified, a neuron can be tied to one or more bat species. If not,
a few sounds can be classified manually and from this a conclusion can be drawn for all
the sounds matching with this neuron. In other words, the data is divided into groups. The
analysis can then take place at the level of these groups instead of the level of individual
sounds, which shortens the time needed dramatically. The goal of this tool is not to replace
the current analysis, but to make it more efficient. This can lead to a better monitoring of
bat populations.
x
GRAPHICAL ABSTRACT

There are six steps in the analysis of bat sounds. A certain bat emits a sound (A). This
sound is then recorded by a bat detector (B). Based upon this sound, a spectrogram is
created and the bat sound is isolated (C). From this spectrogram, features are extracted
(D). These features are numbers that describe certain aspects of the spectrogram. Then,
this datapoint is plotted on a self-organizing map (E). Based upon how similar the datapoint
is to other datapoints, it takes a specific place in the map. Datapoints closer to it are
more similar while those farther away are less similar. An expert then looks at the different
regions in the map and ties them to one or more species (F). (Image source: Noun Project:
rivercon (first bat), andriwidodo (microphone), worker (laptop), maxim kulikov (soundwave),
leona grande (middle bat) and tulpahn (left bat))
xii
LIST OF ABBREVIATIONS

AAH: acoustic adaptation hypothesis

ANH: acoustic niche hypothesis

ATL: Atlantic region

BMU: best matching unit (SOM)

CE: critically endangered (Red List IUCN)

CON: continental region

DD: data deficient (Red List IUCN)

DML: distance metric learning

DMLMJ: distance metric learning through Jeffrey divergence

E: extinct (Red List IUCN)

EEA: European environment agency

EN: endangered (Red List IUCN)

EU: European Union

EW: extinct in the wild (Red List IUCN)

FD: frequency division bat detector

INBO: research institute for nature and forest

IUCN: international union for conservation of nature

KNN: K-nearest neighbors

LC: least concern (Red List IUCN)

MDS: multi-dimensional scaling

MSE: mean squared error
NE: not evaluated (Red List IUCN)

NT: near threatened (Red List IUCN)

ROI: region of interest

SOM: self-organizing map

SSIM: structural similarity index

TDSC: time domain signal coding bat detector

TE: time expansion bat detector

t-SNE: t-distribution stochastic neighboring embedding

VU: vulnerable (Red List IUCN)

ZCA: zero-crossing analyzer (bat detector)

                                             xiv
CHAPTER 1 INTRODUCTION Acoustic bat detectors are one of the most popular monitoring methods used in the study of bats, mainly to determine their presence, species and activity. The main advantage over other methods such as telemetry, light traps and winter counting, is their non-invasive nature and low labor cost. Bat detectors can be left out in the field to passively collect data for days or even weeks, which is generally not possible with other methods. 1.1 Problem statement The main bottleneck for bat detectors is the annotation of recordings and the large amounts of data collected. A single night can lead to hundreds of audio files that need to be an- notated manually. Because the annotation requires expert knowledge, citizen science is generally not an option. The Bat Detective project1 uses citizen science, but the main goal of this project is to separate bat calls from non-bat calls, not to classify individual bats. Annotation can also be done using software such as SonoBat or BatSound, but the accu- racy of these packages is limited, they can be quite expensive and they are generally not adapted to a specific region. Currently, Belgium does not have a practical tool adapted to the region. All reporting happens with manual annotation. Legislation at the level of the European Union requires member states to estimate populations of bats and report these every six years. 1.2 Objectives The objective of this research was to build a tool that can help with the annotation of bat sounds. There were not enough labeled data available to build an automated classifier. However, there were partially labeled data provided by the Research Institute for Nature and Forest (INBO). Based on these data, a tool was built to assist the manual classification. 1 https://www.batdetective.org/
1.3. OUTLINE

1.3     Outline

In Chapters 2 and 3, bats are discussed with a focus on the species, ecology, legisla-
tion, threats and conservation. Furthermore, monitoring methods and echolocation are
discussed. This is important to provide the proper context of the problem. Chapters 2 and
3 make clear why bats need to be monitored, the basis of the monitoring techniques and
the challenges associated with them. Chapter 4 focuses on ecoacoustics, the use of audio
data for monitoring purposes. Ecoacoustics is discussed in general and with a focus on
bat applications. This provides the proper context surrounding audio data and highlights
the potential challenges down the road. Chapter 5 discusses machine learning, a discipline
of computer science that can assist the analysis of the audio data from bats. These tech-
niques are then applied to a dataset provided by INBO (Research Institute for Nature and
Forest). This is discussed in Chapters 6 and 7. Finally, Chapter 8 contains the conclusions
and future perspectives.

All code used is available on Github2 .

  2 https://github.com/ArneDeloose/Masterproef2018Code

                                                   2
CHAPTER 2 ECOLOGY AND TRAITS OF BATS This chapter will focus on four subjects. Firstly: what are bats and what are their most important traits? Secondly: what are the different phylogenetic groups and species of bats in the world and in Belgium? Thirdly: what is the ecological importance of bats? And lastly, what is echolocation? Echolocation is one of the most important traits of bats and this will play a vital role in the way they are monitored (see Chapter 4). 2.1 What are bats? What are bats exactly? Formally speaking, bats are all mammals that belong to the order of the Chiroptera. These animals comprise about 20% of all classified mammal species, making them the second largest order, right after the Rodentia (Wilson, 2005). Bats have three important traits that distinguish them from other mammals. The first trait is also their namesake. `Chiro’ comes from the Greek `cheir’ which means hand and `pteron’ means wing (Merriam-Webster, 2019). In other words: a bat is a mammal that has transformed its hands into wings by using a membrane (patagium). This is not unique to bats. Several other species such as flying squirrels have similar membranes. However, bats are the only mammals that can use their wings for powered flight rather than simple gliding. Gliding means that an external force is needed to ascend. Powered flight means the wings provide the necessary lift on their own. Only three other groups of animals evolved flight: insects, birds and pterosaurs. Pterosaurs are sometimes excluded because they have been extinct for millions of years and their flight mechanics are not well understood (Dietz and Kiefer, 2017; Altringham, 2011; Sato et al., 2009). A second important trait of bats is their nocturnal nature. Most bats are nocturnal animals flying in twilight and darkness. Most likely, bats are nocturnal to avoid competition for food from other animals. Other theories are to avoid predators and to avoid overheating during the day (Speakman, 2001; Mikula et al., 2016; Voigt and Lewanzik, 2011). During the day, bats roost. Characteristic of bats is that they always hang upside down when roosting. This allows them to take flight very fast by letting themselves fall down (Dietz and Kiefer, 2017).
2.2. SPECIES AND EVOLUTION

The last important feature is echolocation, the ability to locate and identify objects using
sound. Bats are most notable in using this technique, although not all bats use it and
several other species such as dolphins, shrews and birds use a similar technique (Holland
et al., 2004).

2.2     Species and evolution

2.2.1     Species of bats

Bats come in various sizes. At the highest end, there is the giant golden-crowned flying
fox, which can reach wingspans of 1.7 m and weigh up to 1.6 kg (Nowak, 1999). At the
lowest end there is Kitti’s hog-nosed bat, which has wingspans of only 15 cm and weighs
only 2 g (Nowak, 1999). This size difference comes with a wide range of other differences.
Because of these differences, bats are traditionally divided into two groups: megabats and
microbats (Prothero, 2017).

As their name suggests, megabats are usually larger than microbats, but there are other
differences as well. Some differences are morphological, such as the absence of a tail, tra-
gus and noseleafs and the presence of a claw on the second finger. A tragus and noseleafs
both assist in echolocation, which is discussed in Section 2.4.2. Megabats do not need a
tragus, because they usually do not have echolocation. Notable exceptions are the ten
species of the Rousettus genus that can use tongue clicking noises as a primitive form of
echolocation. Furthermore, research by Boonman et al. (2014) suggests there are mega-
bats that use the sound of their own wings for echolocation. However, true echolocation
is most likely not possible due to their larger body size. This is discussed further in Sec-
tion 2.4. Instead, megabats rely on different senses, mainly smell and sight. This shift in
senses comes with relatively larger eyes compared to microbats. The use of their senses
also matches their diet. The usual diet of megabats consists of fruits and nectar. Since
these are stationary, an advanced system like echolocation is not necessary. Megabats
are a small group. Only 187 species of megabats are listed on the IUCN Red List (Inter-
national Union for Conservation of Nature), compared to 1244 bat species in total. The
IUCN Red List is the standard reference work to assess the current conservation status of
all species. Conservation is discussed in detail in Section 3.5. All megabats belong to one
family: the Pteropodidae. Common synonyms for megabats are flying foxes and Old World
fruit bats. The first name refers to their typical faces and size and the second name refers
to their habitats. Megabats are only found in the tropical and subtropical regions of Eurasia,
Oceania and Africa. Since our research focuses on Belgium, they will not be discussed any
further. For more information on megabats, we refer to Neuweiler (2000).

                                              4
CHAPTER 2. ECOLOGY AND TRAITS OF BATS
Microbats are much smaller. Their diet usually consists of insects, with some bigger bats
hunting frogs, lizards, fish or even other bats. A notable exception are the three vampire
bat species that feed on animal blood instead. Microbats are a larger group with around
1000 species (IUCN). The biggest groups within the microbats are the vespers or evening
bats with around 400 species and the Phyllostomidae or New World leaf-nosed bats with
around 200 species (IUCN). Microbats always have echolocation. They also have relatively
larger ears and smaller eyes than megabats. Most of them have a tail, which is always
absent in megabats. Microbats are found all over the world except for the coldest regions.
While they are found everywhere, biodiversity is centered around tropical and subtropical
areas (Dietz and Kiefer, 2017). An illustration of this is given in Figure 2.1.
Figure 2.1 Distribution of bat species per latitude in America. Cells of 100 km x 100 km
are used. The size of the circles indicates the number of cells with the same number of
species. Tropical areas have the highest biodiversity. Source: Dietz and Kiefer (2017).
The classification in megabats and microbats is based on morphology, diet and behavior.
However, modern classification is increasingly based on genetic data and evolution instead.
New research suggests that there are five microbat families that are genetically much closer
to megabats. Therefore, a new classification was proposed: Yinpterochiroptera and Yan-
gochiroptera. Yangochiroptera contains the remaining microbats. Yinpterochiroptera splits
immediately into Pteropodidae and Rhinolophidae. The first group contains the original
megabats, the second group contains five families that were originally microbats (Springer
et al., 2001). An illustration of this can be found in Figure 2.2.
All of this is part of a wider debate on the monophyletic nature of bats. A monophyletic
group is a group with a single common ancestor. Polyphyletic groups have multiple ances-
tors. Currently, it is not yet clear whether bats are monophylitic. It is entirely possible that
megabats evolved from a different ancestor than microbats. The current theories suggest
that flight developed only once and the two groups split about 60 million years ago. Cer-
52.2. SPECIES AND EVOLUTION
Yangochiroptera
Yinpterochiroptera
(microbats)
Pteropodidae Rhinolophidae
(megabats) (microbats)
Figure 2.2 New classification of bats.
Frequencies from: Obrist Martin K. (2007), the value of the Pond bat was missing.
Name (English) Name (Scientific) Frequency call (kHz) IUCN rating
Bechstein’s bat Myotis bechsteinii 27 − 104 NT
Brandt’s bat Myotis brandtii 28 − 104 LC
Pond bat Myotis dasycneme − NT
Daubenton’s bat Myotis daubentonii 27 − 81 LC
Geoffroy’s bat Myotis emarginatus 36 − 113 LC
Greater mouse-eared bat Myotis myotis 22 − 86 LC
Whiskered bat Myotis mystacinus 28 − 100 LC
Natterer’s bat Myotis nattereri 14 − 109 LC
Barbastelle Barbastella barbastellus 26 − 48 NT
Serotine bat Eptesicus serotinus 22 − 47 LC
Lesser noctule Nyctalus leisleri 22 − 49 LC
Common noctule Nyctalus noctula 18 − 34 LC
Nathusius’ Pipistrelle Pipistrellus nathusii 36 − 62 LC
Common pipistrelle Pipistrellus pipistrellus 43 − 74 LC
Brown long-eared bat Plecotus auritus 23 − 56 LC
Grey long-eared bat Plecotus austriacus 18 − 45 LC
Greater horseshoe bat Rhinolophus ferrumequinum 69 − 84 LC
Lesser horseshoe bat Rhinolophus hipposideros 90 − 111 LC
Table 2.1 Overview of the bat species present in Belgium.
IUCN ratings: LC: least concern, NT: near threatened
tain megabats later developed traits of microbats and that is why they were misclassified
(Springer et al., 2001).
This classification issue remains an unsolved problem. The problem relates to fossil data.
All flying animals have brittle skeletons to reduce weight. As such, bones do not fossilize
well. Research by Eiting and Gunnell (2009) estimates that only 12% of bat genera have a
fossil record. This makes accurate classification rather difficult.
2.2.2 Bats in Belgium
The primary focus will be on the bats of Belgium. An overview of species is given in Table
2.1 and the guilds are discussed further in Section 2.4.5. There are a total of eighteen
species in Belgium. This number is based on the species that are reported to the European
Union (EU). However, several sources claim that there are in fact more species (Wilson
(2005), Dietz and Kiefer (2017), Natuurpunt and IUCN data). The largest estimate would be
twenty-four species. We will first discuss the formal eighteen species and then move on to
borderline cases. Of the eighteen species, sixteen belong to the vesper bats. Vespers are
mostly insectivores, with some exceptions eating small birds or fish. They have relatively
large ears and small noses.
6CHAPTER 2. ECOLOGY AND TRAITS OF BATS
Within Belgium, the Myotis genus has the most representatives with a total of eight species.
Myotis bats are commonly called mouse-eared bats because they have long, narrow ears.
They usually fly in open spaces and have a high-range echolocation. An example of a Myotis
bat is the whiskered bat, shown in Figure 2.3a.
Continuing, there is one species of the Barbastella genus: Barbastella barbastellus. This
species is shown in Figure 2.3b. It is a rare species, so rare it was considered extinct
in Belgium until 2014, when Natuurpunt reported new sightings. They roost in damaged
trees, which become increasingly rare due to forest management. Barbastella species have
small eyes, a small nose and large, broad ears.
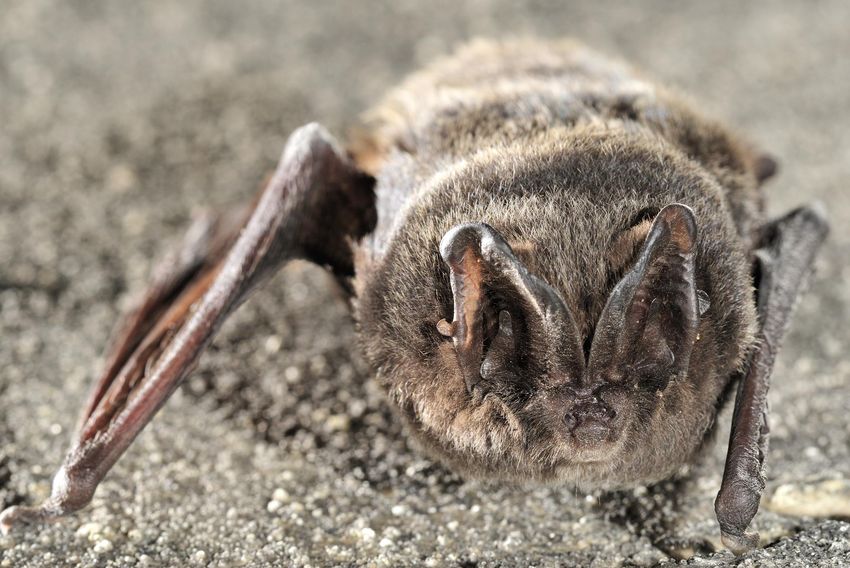
The next genus is the Eptiscus genus with only the serotine bat, shown in Figure 2.3c. While
this is an abundant species, populations are declining in many areas due to construction
works and better isolation. Eptiscus bats have buildings as their habitat. The serotine
bat has black ears and nose and is quite large, with wingspans of up to 38 cm. It shows
morphological similarities with the common noctule, but distinguishes itself rather easily
by flying out after sundown, while the common noctule flies out before sundown.
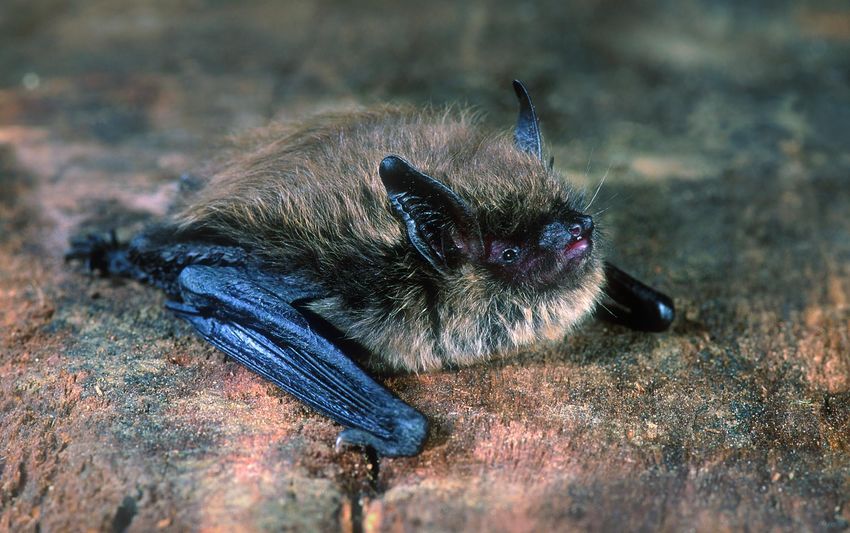
The next species are the common noctule and lesser noctule of the Nyctalus genus. The
common noctule is shown in Figure 2.3d. As was already mentioned, morphologically speak-
ing, these bats are similar to the Eptiscus genus, but they show different behavior. Apart
from the difference in emergence, they also have different winter tactics. Rather excep-
tionally, the common noctule shows female bias migration. The females migrate south in
winter, while the males hibernate.
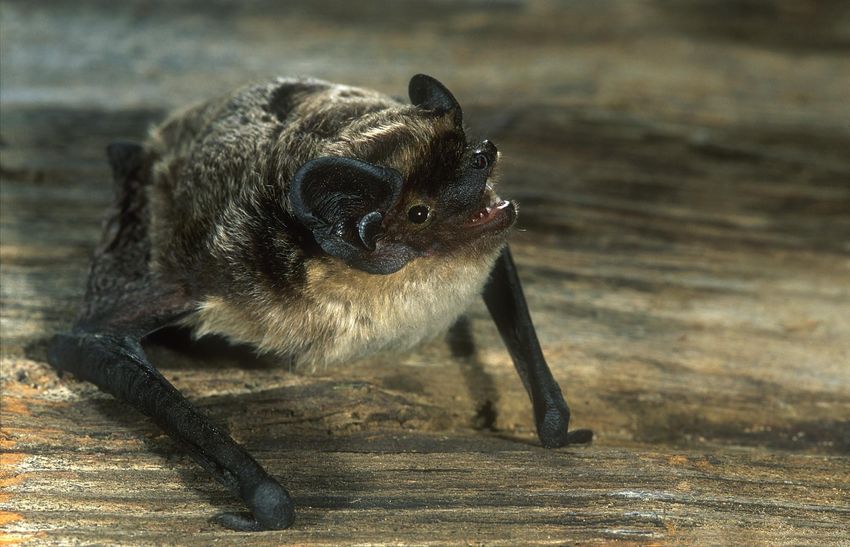
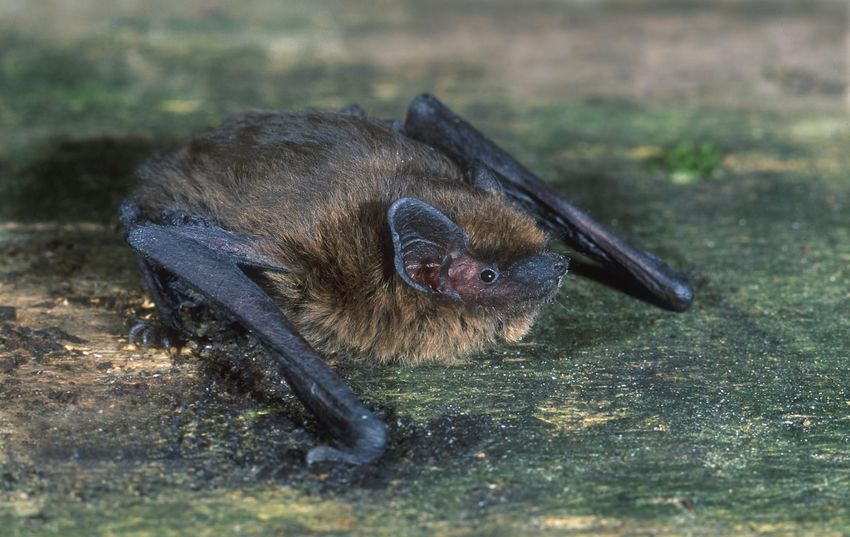
Next, there is the Pipestrellus genus with two species. The common pipestrelle is the most
abundant species of Belgium (according to Natuurpunt). Pipestrellus species are commonly
urban species. They hunt in parks or gardens and live in buildings. A picture of a common
pipestrelle is shown in Figure 2.3e.
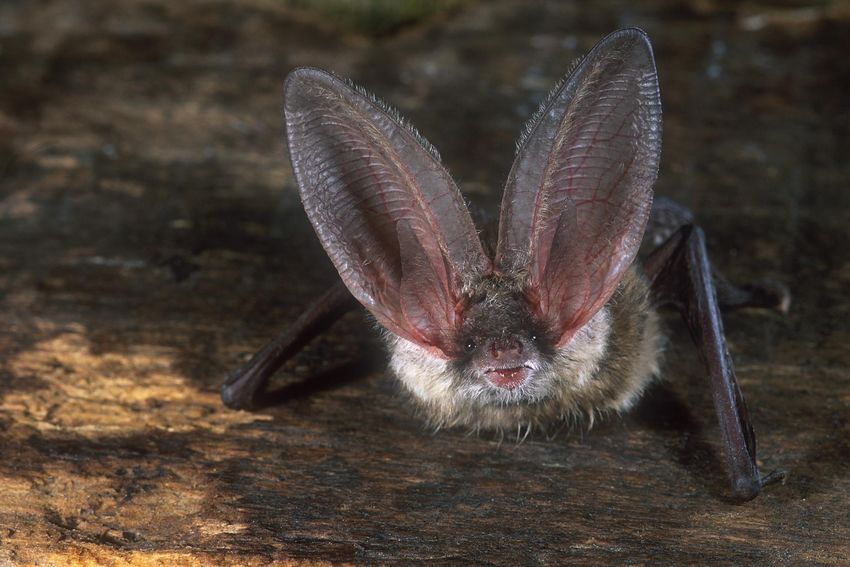
Lastly, there are the Plecotus or long-eared bats. Two species of this genus are present in
Belgium. As the name suggests, these bats have very long ears. They use relatively low
frequencies for echolocation, which have a long range. These species are not threatened
now, but there are concerns that climate change could affect that. They are known for their
long lifespans, low reproduction rates and small population, so their ability to adapt to rapid
changes is low. An example of the Plecotus genus is the Plecotus auritus, depicted in Figure
2.3f.
This leaves only two species that are not vespers. These last two are the Rhinolophus
ferrumequinum and Rhinolophus hipposideros from the Rhinolophidae family, commonly
called the horseshoe-bats. This is one of the families that was added to the Yinpterochi-
roptera, which means that these two species probably evolved from megabats. Character-
72.3. ECOLOGICAL AND ECONOMICAL IMPORTANCE
istic of these species are their horseshoe-shaped noseleaves that help with echolocation.
As we can see in Table 2.1, the two Rhinopholus species have a much higher echolocation
frequency. The Rhinolophus ferrumequinum is depicted in Figure 2.3g.
Apart from these bats, there are other bats that have an unclear status. It is not always
straightforward to determine whether a bat is present in a certain country. As an example,
the Alcathoe bat will be discussed (Myotis alcathoe). This species is morphologically almost
indistinguishable from the whiskered bat, but was recognized as a separate species based
on genetic data in 2001. Confirmed recordings show a patchy distribution with many iso-
lated records (Niermann et al., 2007). As such the IUCN lists its status as data deficient.
In Belgium, there are only thirteen recordings in the Walloon region (Nyssen et al., 2015).
All of this makes it difficult to conclude unambiguously whether the Alcathoe bat is perma-
nently present in Belgium or not. Apart from the Alcathoe bat, there are three other rare
bats in a similar situation. The greater noctule (Nyctalus lasiopterus), the parti-coloured bat
(Vespertillio murinus, shown in Figure 2.3h) and Kuhl’s pipistrelle (Pipistrellus kuhlii) are all
examples of rare bats with only a handful of isolated recordings.
This leaves two more bats: the soprano pipestrelle and the northern bat. Both of these
species are widespread in Eurasia, but do not have colonies in Belgium. However these
bats are present in parts of Germany and France that are very close to the border. Bats can
cover large distances in a single night. This makes it possible that while these bats do not
have permanent colonies in Belgium, they occasionally pass through and are detected this
way.
2.3 Ecological and economical importance
Bats have several important ecological and economic functions. For a full overview we refer
to Kasso and Balakrishnan (2013). The four most important ones will be discussed here.
In tropical climates, megabats play a vital role in flower pollination and seed dispersal. With
motion cameras, the main pollinator of the Australian baobab was shown to be the black
flying fox (Groffen et al., 2016). According to Hodgkison et al. (2006), 13.7% of trees in
Malaysia relies at least partially on bats for pollination and seed dispersal.
Microbats on the other hand are important for the control of insect populations. In research
by Boyles et al. (2011), it is estimated that the loss of bats would cost agriculture 3.7 to 53
billion dollars per year in extra pesticides and yield losses in the Unites States alone.
The excrement of bats can be collected as a fertilizer, called guano. Due to their short
digestion process, faeces from bats are rich in nitrates, phosphates and salts. Today, this
is still used in organic farming. In the past, it was also used to make gunpowder as a
8CHAPTER 2. ECOLOGY AND TRAITS OF BATS
(a) Myotis mystacinus (Whiskered bat). (b) Barbastella barbastellus (Barbastelle).
(c) Eptiscus serotinus (Serotine bat). (d) Nyctalus noctula (Common noctule).
(e) Pipistrellus pipistrellus (Common pipistrelle). (f) Plecotus auritus (Brown long-eared bat).
(g) Rhinopholus ferrumequinum (Greater horse- (h) Vespertillio murinus (Parti-colored bat).
shoe bat).
Figure 2.3 Bat genera in Belgium. All eight genera are represented by one species from
that genus. Source: Natuurpunt (Hugo Willocx and Yves Adams).
92.4. ECHOLOCATION
source of saltpeter. Around 1850, the US imported 760 000 tonnes of guano per year from
various islands in the tropics (Smil, 2004). In 1856, the US wrote the Guano Islands Act, a
federal law that allowed any US citizen to claim islands with guano (as long as they were
not occupied or claimed by a different country). It even empowered the president to use
the military to protect these islands. Roughly a hundred islands were claimed this way
in the past, with ten islands still being part of the US today (although several claims are
being disputed by Colombia and Haiti). Guano also plays a role in soil fertility and nutrient
transfer within an ecosystem.
Lastly, bats can be used as a bioindicator. Bioindicators are organisms whose population
or activity is indicative of the state of the environment. The pollution state of a river for
example can be assessed through the absence or presence of certain invertebrates. Jones
et al. (2009) report several stress factors that can lead to a change in population or ac-
tivity of bats. These stress factors are: extremes of drought, heat, cold and precipitation,
cyclones and sea level rise, deterioration of water quality, agricultural intensification, loss
and fragmentation of forests and pesticide use. This way, the presence of bats can be used
as a proxy for other problems, mainly climate change. de Oliveira et al. (2017) used this
technique successfully as a proxy for habitat destruction through deforestation in Brazil.
For countries in temperate climates such as Belgium, insect control is the most important
service that bats provide. The other three ecological functions are more important in tropi-
cal climates (Kasso and Balakrishnan, 2013).
2.4 Echolocation
The word sonar is short for sound navigation ranging, the use of sound to detect objects
(Encyclopaedia Britannica 2019). It is a technique that is mainly used in submarines. When
an animal uses this technique, it is called bio-sonar or animal echolocation. Microbats
are one of the most notable groups that use this technique. Most megabats do not use
echolocation at all. A notable exception is the genus Rousettus which uses a primitive form
of echolocation (Holland et al., 2004).
2.4.1 Overlap with other senses
Echolocation is the main sense microbats rely on for hunting, communicating and naviga-
tion. However, it is not the only sense they have. Despite popular belief, all bats have vi-
sion. This vision is usually mesopic (light/dark), but some bats can see in UV as well (Müller
et al., 2009). Bats also have magnetoreception. Contrary to birds, bats have polarity-based
reception. Birds estimate their latitude based on the strength of the magnetic field, bats
10CHAPTER 2. ECOLOGY AND TRAITS OF BATS
differentiate north and south. Research by Tian et al. (2015) shows that bats can use their
magnetoreception even at only one fifth of the normal magnetic field strength. These other
senses can provide extra information that is combined with information from echolocation.
Apart from the overlap between senses, there is also a physical overlap. The muscles used
in flight, breathing and echolocation can overlap. Because of this, echolocation is much
more common in flying animals (Speakman et al., 1989). Altringham (2011) suggests that
this coupling is more difficult for larger animals. This would make echolocation less interest-
ing for larger bats in terms of energy. However, research by Speakman and Racey (1991)
has found that the energy costs for flight are so high that echolocation is not significant in
comparison. It is possible that the main reason why megabats do not have echolocation is
simply because their diet does not require them to.
2.4.2 Mechanism
Echolocation works by emitting sounds from the larynx (voicebox) and analyzing the return-
ing echoes. From these echoes, three things can be determined. The first metric is distance
to the object. This is determined from the time delay between pulse and echo. The speed of
sound is around 340 metres per second. If the time between a call and the echo is one sec-
ond, the object is around 170 metres away. This 170 metres is then corrected for the speed
of the bat itself. If a bat is flying towards the object, the echo will return slightly faster. The
faster they fly, the bigger this effect becomes (Jones, 2009). The elevation of the object can
also be estimated. This is determined from interference patterns on the tragus. The tragus
is a circular bump that partly covers the ear canal (Figure 2.4). Horseshoe bats are able to
move their ears vertically independent of one another. This results in different intensities at
each ear which can be used to calculate elevation (Müller, 2004; Jones, 2009). Lastly, the
direction of the sound can be estimated. This is determined from the intensity difference
between both ears. When the object is to the left, the intensity at the left ear will be higher
(Jones, 2009).
Figure 2.4 Tragus of a bat ear. Source: Chiu and Moss (2005).
112.4. ECHOLOCATION
The intensity of the sounds can be a problem. Bat calls can have intensities of up to 140
decibels, louder than a military jet aircraft (Surlykke and Kalko, 2008). This means that in
theory, bats would damage their own hearing. However, they have developed two systems
to counter this. Firstly, bats are capable of contracting the muscles in their middle ear which
makes them temporarily deaf (Teeling, 2009). In low-duty echolocation, the time delay in
call and echo is large enough to allow for contraction and relaxation of these muscles.
However, in high-duty mode, bats emit continuous calls which make this impossible. High-
duty mode is mostly used when chasing an insect. This mode requires even more advanced
systems. In high-duty mode, bats use the Doppler effect (Jones and Holderied, 2007). They
know exactly how fast they are flying and adapt the frequency of their calls to this flight
speed. However, their ears are tuned to a different frequency range. Due to the Doppler
effect, returning echoes will have a higher frequency.
Apart from the echoes of their own sounds, bats can also detect the noises produced by
certain insects. Certain moth species take advantage of this. They have a tympanum
(hearing organ) that detects bat calls. When they hear calls, they produce sounds designed
to interfere with echolocation (Hoy and Fay, 1998). Other common responses for insects
are twitching of wings to produce random evasive movements. Butterflies are known to
use this technique. For a full overview of insect defensive mechanisms to bats, we refer to
Miller and Surlykke (2001).
The frequency range of microbat calls in Belgium is between 14 kHz and 113 kHz (see Table
2.1). It is possible bats go even higher, but as we will see later (Section 4.4), most detection
devices do not measure above 120 kHz. The range of human hearing is 20 Hz to 20 kHz,
so most calls cannot be heard by humans. This is referred to as ultrasound (Cutnell and
Johnson, 1997).
2.4.3 Limitations of echolocation
There are several limitations to echolocation. The most important ones will be summarized
here. A full overview is given in Schnitzler and Kalko (2001).
Firstly, there are clutter echoes. These are noise signals that come from the surroundings.
A classic example would be a butterfly flying between the leaves of a tree. Those leaves
will also create echoes. If those echoes interfere with the echoes of the butterfly, it is called
backwards masking (Schnitzler and Kalko, 2001).
Secondly, there is forward masking. Here, the cause is internal. The brain of bats needs
to do two things: send out calls and interpret the echoes. As long as these two activities
are separated well enough in time, there is no problem. But if the prey gets closer and
closer, these activities can start to overlap. This is similar to how it is difficult for humans
12CHAPTER 2. ECOLOGY AND TRAITS OF BATS
to talk and listen at the same time. It is also possible that the call overlaps with the echo
creating interference. Both make analysis difficult. We call this forward masking, because
the interference happened before the echo returned. In backwards masking, the interfer-
ence happens after the echo has returned. According to Kober and Schnitzler (1990), the
minimum detection distance is about 17 cm for every ms of signal. If the distance gets
smaller, forward masking is too strong to properly detect an object (Schnitzler and Kalko,
2001).
Thirdly, echolocation has a limited range. As sound waves travel through air, they get
absorbed. At some point, they will be too quiet to properly detect. Kober and Schnitzler
(1990) calculated that the maximum range of echolocation is on average about 10 m. This
range is dependent on many factors such as signal frequency, prey size, humidity and
temperature.
2.4.4 Evolution of echolocation
Echolocation plays a vital role in hunting preys. However, it also assists in flight and commu-
nication between bats (Schnitzler et al., 2003). Because of this, there are different theories
on the initial function of echolocation and its evolution.
The first theory is the flight first theory. Under this theory, flight developed only once in
bats. A primitive system of echolocation evolved later to help with orientation. Bats who
relied solely on sight would have trouble hunting at night, bats who use echolocation can
hunt whenever they want to. At night, there is less competition for food, hence bats with
echolocation could take this niche easily. Another possible reason to become nocturnal
could be to avoid predators. This theory can explain the differences between megabats
and microbats rather well. After flight was developed, several bats started to feed on fruits
and nectar. These bats developed better sight and smell. Other bats kept feeding on insects
and developed echolocation (Simmons et al., 2008; Speakman, 2001).
A different theory suggests the initial function of echolocation was communication between
bats. Here, flight would have developed after echolocation. Primitive echolocation found in
megabats such as clicking of the tongue supports this theory. Under this theory, megabats
would have lost their echolocation abilities later (Speakman, 2001).
Lastly, there are theories that suggest bats relied on sounds to locate prey from the very
beginning. These would be passive sounds from the prey itself. Hence their hearing im-
proved over time and it was only a small step to start using the reflection of their own
sounds to better locate preys. If an animal uses sounds made by a different animal, we
call it passive mode hearing. If they use the reflection of their own sounds, we call it active
132.4. ECHOLOCATION
mode hearing. Megabats either split off before the transition from passive to active mode,
or they lost their echolocation later (Speakman, 2001).
2.4.5 Classification of echolocation
Parameters of echolocation
A bat call has three important parameters: frequency, bandwidth and length. Each pa-
rameter can be varied resulting in different advantages and disadvantages (Denzinger and
Schnitzler, 2013). These parameters are graphically shown in Figure 2.5
Figure 2.5 Different parameters of a bat sound.
As mentioned before, frequency ranges between 20 and 120 kHz with most calls being
around 50 kHz. High frequencies create a high resolution of the environment. However,
these frequencies also get absorbed better into the air, meaning the range becomes smaller
(Lawrence and Simmons, 1982).
Bandwidth is the range of different frequencies present in a signal. A high bandwidth will
make it easier to determine direction, size and distance of an object. However, it does not
allow bats to use the Doppler effect or to tune their hearing to specific frequencies. As
mentioned before, this is important in high-duty mode (Denzinger and Schnitzler, 2013).
Lastly, length (signal time) is important. A long signal will increase the signal to noise ratio
which makes it easier to detect preys. However, echoes and calls can start to overlap,
which is difficult to deal with (forward masking). Only long calls can detect the wings of
insects (Denzinger and Schnitzler, 2013).
Guilds
Bats show some flexibility in adapting these parameters depending on the situation. Even
so, most bats prefer sticking to a certain type of signal and have evolved to use this signal
very effectively. Based upon this, they can be classified in different groups. One way to
define these groups is in terms of guilds. A guild was defined by Root (1967) as a group of
species that exploits the same class of environmental resources in a similar way. If animals
14CHAPTER 2. ECOLOGY AND TRAITS OF BATS
feed in a similar way, they belong to the same guild. We will discuss the five guilds from
Denzinger and Schnitzler (2013), which are also used in the field guide of Dietz and Kiefer
(2017). As an illustration, Figure 2.6 shows the signal of a representative of each guild.
Figure 2.6 Signals of a representative of each guild. Source: Denzinger and Schnitzler
(2013).
The first guild are the open-space aerial foragers. These bats hunt in open spaces and
hence face a significant problem. Preys will be distributed over large areas which makes
them difficult to locate. Hence, these bats will need long-range echolocation, which results
in long calls at low frequencies (around 30 kHz) with a narrow bandwidth. Their morphology
is adapted to this as well, with characteristic narrow wings to trade off extra speed for lower
agility. Typical examples of these bats are Nyctalus and Eptiscus species.
The second guild are edge-space aerial foragers. These bats hunt in edge spaces, which
are line-shaped structures such as hedges or the treeline of a forest. They face a chal-
lenge because there is a constant background of the edge structure (backwards masking).
To counter this, these bats use mixed signals. They have a shallowly modulated narrow-
band component which is either preceded or followed by a broadband, steeply downward
frequency-modulated component. The first one is used for insect detection, the second
one to fill in the surroundings (to avoid collisions). The first component (shallow one) is
species specific and can be used for determination. The second component (steep one)
is more general for this group. Typical members of this group are Pipistrellus species and
Barbastella species.
Next are the edge-space trawling foragers. Trawling is a word for fishing with a net and
this is reasonably accurate for this group. Trawling species will fish for signals by flying low
above water surfaces while emitting calls. The smooth water will make the calls echo away
from the bat except for the ones hitting the surface perpendicular. This is used to determine
152.4. ECHOLOCATION
the height above the water surface. The bat can easily detect objects on or above the water
surface. Their signals are usually similar to the second guild because the shores work as an
edge-space. A key difference is that trawlers tend to put a shallow modulated component
in between two steeply modulated components, which makes it possible to distinguish
between the two. However, when trawlers hunt above lakes, their signals are more similar
to open-space aerial foragers. Examples of this guild are Myotis species such as Myotis
daubentonii (Daubenton’s bat).
The fourth guild are the narrow space flutter detecting foragers. Narrow space is sometimes
changed to confined space instead. A confined space refers to an area which creates large
amounts of echoes from all sides. The middle of a forest is a simple example, but urban
areas can also serve as confined spaces. Backwards masking will be a significant problem
here. To overcome this, these bats tune their calls to specifically detect the beating of
insect wings. Insect wings are in constant motion which will create glints (rapidly changing
echoes). These bats will have long calls at a constant high frequency. Morphologically
they will have short, broad wings to increase their agility. An example of this guild are the
Rhinopholus species.
Lastly, there is the guild of the narrow space passive gleaning foragers. Gleaning is a
synonym for collecting. These bats will `collect’ insects from a surface. Rather uniquely,
these bats do not use echolocation to locate their prey. Instead, they listen to the sounds of
the insect itself (passive) along with sight and smell. As mentioned before, there is a theory
that suggests that all bats were originally passive gleaners. Echolocation can be present
for spatial orientation, however. In that case, their signals are similar to the first component
of open-space aerial foragers. Examples of these bats are Bechstein species and Plectocus
species. Bats that use a similar collecting technique with echolocation instead are called
narrow space active gleaning foragers, but this is a very rare guild.
Finally, there is one more guild that is often ignored. Some frugivorous and nectarivorous
bats use smell as their primary sense, but use echolocation to find the exact position of
fruit or nectar once they are close. This guild is often called narrow space active/passive
gleaning foragers, because they use both active methods (echolocation) and passive meth-
ods (smell). However, bats like this do not appear in moderate climates, so they will not be
relevant to our research.
16CHAPTER 3 CONSERVATION AND MONITORING OF BATS In this chapter we will focus on the conservation of bats. First, we discuss the threats that bats face. This is followed by a section about possible conservation measures. Next, we delve into legislation to conserve bats, with a primary focus on the European Union and Belgium. Non-governmental organizations are also discussed briefly. Then, the current state of bats is discussed, starting worldwide and then zooming in on the European Union and Belgium. Lastly, possible monitoring methods are discussed. 3.1 Threats Bats face many threats. Not all of them are unique to bats though. Habitat destruction for example is a threat to all animals, not just bats. In this section, both general threats and specific threats will be discussed. However, it is important to point out that even if a threat is general, it does not always hit species the same way. Bats in particular have certain properties that make them vulnerable. Most importantly, bats have a very low birth rate. Females usually only get one juvenile per year. Furthermore, it can take several years before a juvenile becomes sexually mature and starts to reproduce. This means that population growth is low, which makes recovery from events more difficult. Under normal circumstances, this low population growth is compensated by an exceptionally long lifespan. Wilkinson and South (2002) reports individuals of five bat species that lived for at least 30 years. This is about 3.5 times longer that the lifespan of a non-flying placental mammal of the same size. Additionally, bats have advanced systems to control time of birth. Some species store sperm during winter or freeze development of the embryo in the initial stages. Births happen in a narrow window around May or June in temperate climates. Normally this is an advantage, since food supply is optimal around this point. But if there is a disturbance during this narrow window, this can have disastrous consequences for a population (Dietz and Kiefer, 2017).
3.1. THREATS

The first threat bats face are diseases and parasites. The most important example is the
white-nose syndrome (WNS), a fungal growth. In the United Status, this is monitored by the
United States Geological Survey agency (USGS). They estimate that since 2008, millions
of bats have died in the US and Canada from WNS. The disease was first seen in North
America around 2006 and later on in Europe as well. However, in Europe there were no
casualties. Current theories suggest the disease developed in Europe and hence European
bats developed immunity against it. American bats did not have this evolutionary immunity,
which caused mass casualties. Whether increased globalization caused WNS to spread
from Europe to America is not clear (Fenton, 2012). Recent genetics research by Palmer
et al. (2018) has found that the alternate excision repair pathway in the fungus is not
functional. This means that the fungus can be killed easily by ultraviolet light or certain
DNA alkylating agents such as methyl methanesulfonate. In the future, this could lead to a
potential treatment of WNS.

Bats also contain a wide variety of other pathogens. Usually these do not pose a threat
to the bat itself, but they can infect humans. Indirectly, this poses a threat to bats since
they could be killed on purpose to prevent certain diseases from spreading. Viruses like
Ebola have been reported in bats, as well as the Corona virus, which causes severe acute
respiratory syndrome (SARS) in humans. The Henipa virus can be found as well. Lastly,
there are also five variants of the Lyssa virus found in bats: EBLV 1, EBLV 2, WCBV, BBLV
and LLEBV. Lyssa is known to cause rabies in humans, but so far, there are only three
confirmed and two unconfirmed human deaths of bat rabies, all of which related to EBLV 1
and 2. Even so, it is recommended to wear gloves and use a vaccine when handling bats
(Dietz and Kiefer, 2017).

Bats are also vulnerable to extreme temperatures. The most notable cases are the heat-
waves in Queensland, Australia. In 2014, an estimated 45 500 flying foxes, roughly half of
the population, died in a single day when temperatures reached up to 44.6 degrees Celsius
(Welbergen et al., 2014). Another day in 2018 killed 23 000 individuals (Kim and Stephen,
2018).

Changes in natural predators are quite limited.     Only owls, snakes, hawks, minks and
racoons can catch a bat and eat it. However, house cats are a big threat to bats. Cats
find a roost, catch bats as they emerge, and then play with their prey. They never eat a
bat. The Bat Conservation Trust in the UK reports that 30% of rescued bats were attacked
by house cats. Other research in Italy has found a very similar number (Ancillotto et al.,
2013).

Apart from these somewhat natural causes, there are many direct anthropogenic threats.
Roads and railroads are a common problem. Echolocation only works over short distances,
so bats will never detect a fast moving train or car in time. In Greece, an entire population

                                             18
CHAPTER 3. CONSERVATION AND MONITORING OF BATS
was exterminated because a road crossed the route between their hunting grounds and
roosting cave. Some species do not cross roads at all and fly around them or get stuck in
one area. It is estimated that roads kill about the same number of bats as house cats, but
exact numbers are difficult to estimate (Dietz and Kiefer, 2017).
Pesticides and chemicals can also pose a threat. Chlorinated components (HCHCs, DDTs,
PCBs, CHLs,...) can accumulate through the food chain. Therefore, the highest levels are
found in birds and bats (Senthilkumar et al., 2001). Pesticides can also have an indirect
effect. If a pesticide is used to kill insects, the food supply of bats is reduced. Apart from
pesticides, land transformation can also reduce insect populations (Matteson et al., 2013).
Changes in housing also affect bats. Many bats live in attics or other crevices in houses,
but due to renovations, demolishing and better isolation, these habitats are destroyed.
The most vulnerable of these habitats are winter resorts. These are places that are used by
thousands of bats to hibernate. A famous example are the basalt mines of Mayen in western
Germany. These old mines house between thirty and fifty thousand bats of sixteen different
species according to the German Federal Agency for Nature Conservation (Bundesamt für
Naturschutz). Around five million euro was spend on a conservation project. This project
included extensive surveys of the populations and restoration of the mines. Entrances were
barred with gates or sealed off and hazardous corridors were reinforced (Dietz and Kiefer,
2017).
Disturbance can be a problem as well. During the day bats go into a lethargic state and
some bats hibernate in northern climates (others migrate). Both are vital to energy conser-
vation. If bats are disturbed during lethargy or hibernation, it can have a significant effect
on their health (Dietz and Kiefer, 2017). Disturbance can also come in the form of light.
Apart from other effects, artificial light can delay the emergence from a roost, which gives
bats less time to hunt (Stone et al., 2015).
Poaching can also pose a threat. In some South-American cultures, the blood of bats is
believed to have healing properties. Lizarro et al. (2010) studied four major cities in Bolivia
(Cochabamba, La Paz, Santa Cruz and Oruro) and found that over 3 000 bats were sold per
month. But bats can also be hunted as a source of food. Goodman (2006) reports that in
Madagascar, the Hipposideros commersoni is hunted during periods of food shortage.
Bats are also threatened by wind turbines. Turbines can cause barotrauma (lung rupture
due to high pressure changes) or bats can hit the rotors. Exact statistics are limited, but
wind turbines are estimated to be a bigger threat than cats and traffic (Baerwald et al.,
2008; Dietz and Kiefer, 2017).
19Vous pouvez aussi lire