Screening of feasible applications of wind and solar in Mali - Feasibility of Renewable Energy Resources in Mali
←
→
Transcription du contenu de la page
Si votre navigateur ne rend pas la page correctement, lisez s'il vous plaît le contenu de la page ci-dessous
Screening of feasible applications of wind
and solar in Mali

Assessment using the wind and solar atlas for Mali.

                                   By:

  Ivan Nygaard, Per Nørgård, Luc Dewilde, Jake Badger, Mads Olander
 Rasmussen, Lars Boye Hansen, Ousmane Ouattara, Famakan Kamissoko,
    Alhousseini Issa Maiga, Souleimane Diarra, Nanourou Coulibaly

                            Draft Version :

                  Solar wind application report 29.11.12

                                                                      1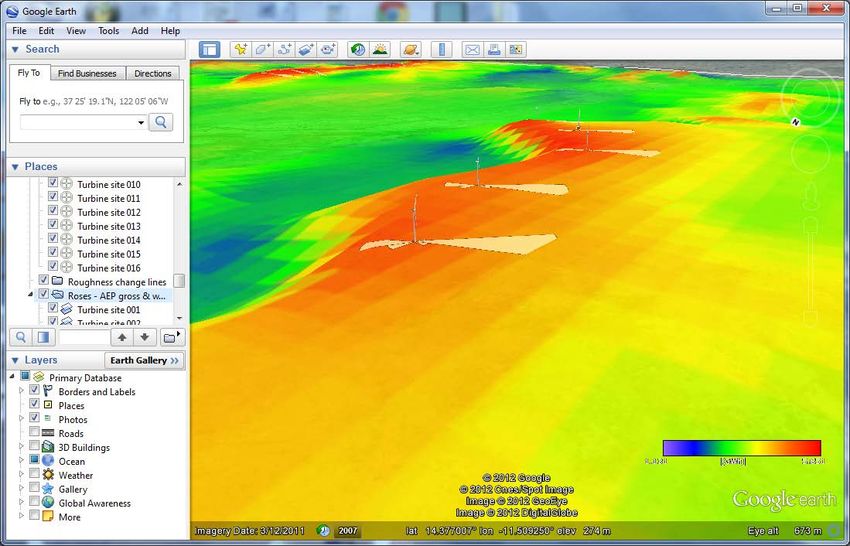
Contents

LIST OF ABBREVIATIONS                                                                   4

1     EXECUTIVE SUMMARY                                                                 6

2     PREFACE                                                                           7

3     THE ELECTRICITY SECTOR IN MALI                                                    9

3.1     Electricity sector reform                                                       9

3.2     Structure et organisation sectorielles                                         10
   3.2.1 Institutions publiques                                                        10
   3.2.2 Opérateurs du secteur                                                         11
   3.2.3 Organisations non gouvernementales                                            11
   3.2.4 Partenaires techniques et financiers                                          11
   3.2.5 Associations de consommateurs                                                 12

3.3     Demand forecast for electricity in the integrated system                       13
   3.3.1 Demand forecast                                                               13
   3.3.2 Extension of the integrated system                                            15
   3.3.3 Existing and planned production units for electricity and planned import      16
   3.3.4 Future avoided costs in the integrated system                                 19
   3.3.5 Conclusion                                                                    22

3.4     Demand forecast in the isolated grids (Centres isolées)                        22
   3.4.1 Tombouctou grid                                                               23
   3.4.2 Monthly variations                                                            24
   3.4.3 Diurnal variations                                                            25
   3.4.4 Production costs for electricity in isolated centres                          26

3.5     Electrification rurale.                                                        28

3.6     Power purchase agreements                                                      28

4     WIND RESOURCES IN MALI                                                          30

4.1     Introduction                                                                   30

4.2     Local measurements                                                             30

4.3     Annual wind resources                                                          32
   4.3.1 Wind speed                                                                    32
   4.3.2 Surface roughness and height                                                  33
   4.3.3 Wind power density                                                            34

4.4     Application of data using WAsP                        Error! Bookmark not defined.

4.5     Yearly and daily variations                                                    37

4.6     Integration with hydropower                                                    43

2
5     SCREENING OF APPLICATIONS FOR WIND POWER IN MALI                                  46

5.1         Examples of wind turbines and characteristics                                47

5.2     Case studies of wind applications                                                49
   5.2.1 Tombouctou                                                                      49
   5.2.2 Kamango wind farm                                                               50
   5.2.3 Kayhill wind farm                                                               51
   5.2.4 Akle Wind Farm                                                                  52
   5.2.5 Summary of case studies                                                         53

5.3     Main Technical Challenges in Building Wind farm in Developing countries.         54
   5.3.1 Logistics                                                                       54
   5.3.2 Grid issues                                                                     55
   5.3.3 Maintenance Issues                                                              55

5.4     Assessment of production costs in the four cases                                 56
   5.4.1 Financial parameters:                                                           56
   5.4.2 Dépenses d'investissement de capital (CAPEX)                                    57
   5.4.3 Génie civil et électrique                                                       57
   5.4.4 Couts opérationnelle et maintenance                                             58
   5.4.5 Données générales du modèle                                                     58
   5.4.6 Assessment of production costs                                                  58

5.5         Feasibility considerations                                                   60

5.6         Conclusion                                                                   61

6     SOLAR RESOURCES                                                                   63

6.1         Solar atlas                                                                  63

6.2         Annual variation in solar radiation                 Error! Bookmark not defined.

6.3         Diurnal variation of solar radiation                Error! Bookmark not defined.

7     APPLICATIONS FOR SOLAR ENERGY IN MALI                                             70
    7.1.1     Solar PV in the integrated electricity network.                            70
    7.1.2     PV in the local isolated grids.                                            71
    7.1.3     Decentralized applications outside the EDM grid                            72

7.2     Some recent initiatives under development                                        72
   7.2.1 Scatec Solar a Mopti                                                            72
   7.2.2 SPEC Solar et la centrale PV de Douentza.                                       73
   7.2.3 The Hybrid system of Ouessebougou                                               73

8     REFERENCES                                                                        74

APPENDIX A: LISTE DES PROJETS D’ELECTRIFICATION RURALE : 77

                                                                                          3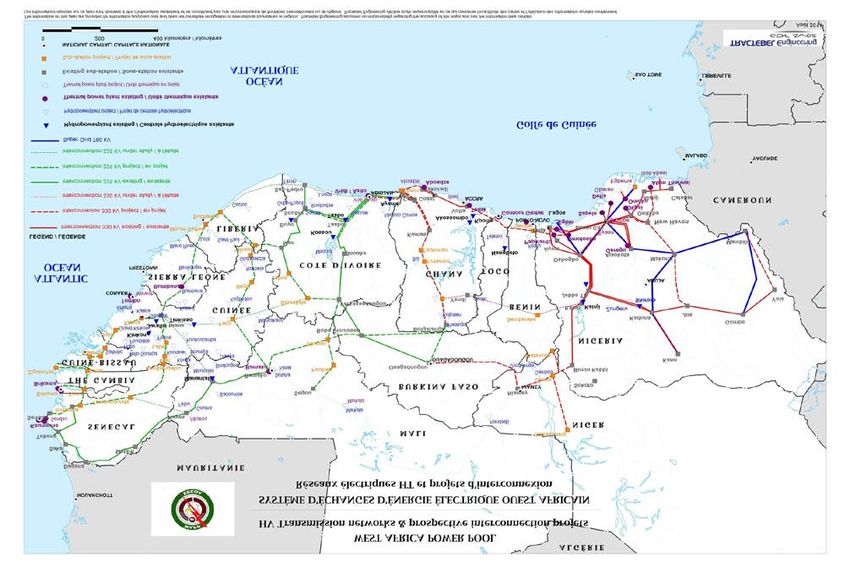
List of abbreviations
AMADER     Agence Malienne pour le Developpement de l’Energie Domestique et de
           l’Electrification Rurale
CNESOLER   Centre National de l’Energie Solaire et des Energies Renouvelables

DNE        Direction Nationale de l'Energie
ENI        Ècole Nationale d’Ingenieurs
FAO        Food and Agriculture Organization
GIMMS      Global Inventory Modeling and Mapping Studies
GTZ        Deutsche Gesellschaft für Technische Zusammenarbeit

IPCC       Intergovermental Panel on Climate Change
ITCZ       Intertropical Convergence Zone
KAMM       Karlsruhe Atmospheric Mesoscale Model
MMEE       Ministère des Mines, de l’Energie et de l’Eau
MSG        Meterosat Second Generation
NASA       National (USA) Aeronautics and Space Administration
NCAR       National (USA) Center for Atmospheric Research
NCEP       National (USA) Center for Environmental Prediction

NGA        National (USA) Geospatial-Intelligence Agency
NIR        Refers to the surface’s reflectance factor
NPP        Net Primary Productivity (Productivité Primaire Nette)
OMVS       Organisation pour la Mise en Valeur du Fleuve Sénégal
RED        Refers to the surface’s reflectance factor in the red part of the spectrum.
RMSE       Root Mean Square Error
SOGEM      Société de Gestion du barrage de Manantali
SRTM       Shuttle Radar Topography Mission
SSE        Surface meteorology and Solar Energy
TERNA      Technical Expertise for Renewable Energy Application
USGS       United States Geological Survey
UTM        Universal Transverse Mercator coordinate system
WAsP       Wind Atlas Analysis and Application Program

4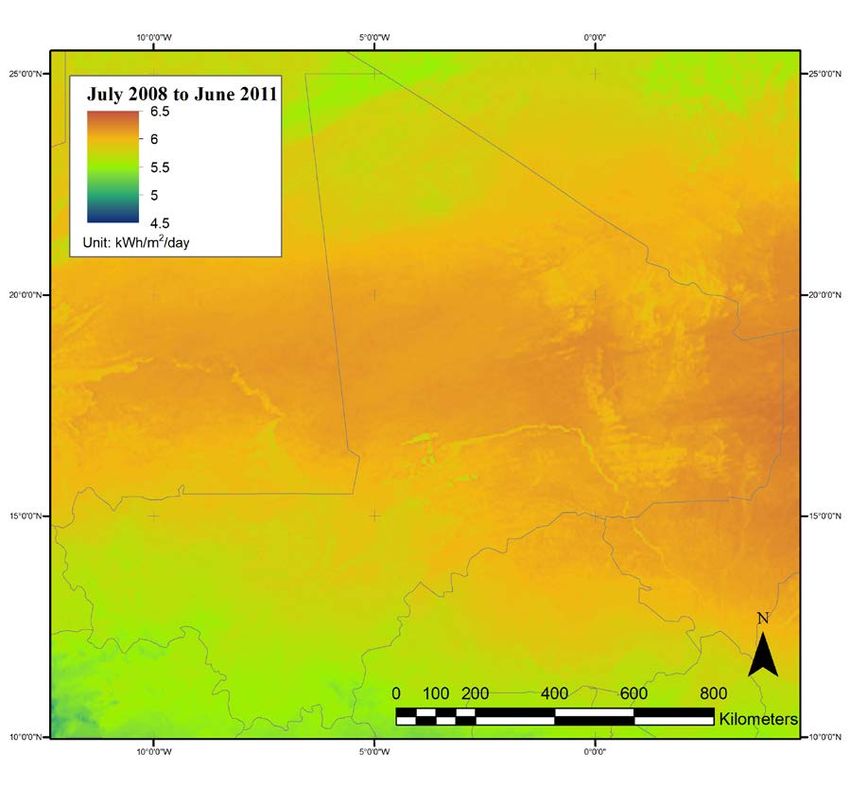
5
1 Executive Summary

6
2 Préface
La fourniture d’une source de services énergétiques abordable, fiable et respectueuse
de l’environnement est une condition préalable importante du développement de la
société malienne. Actuellement, la demande d’électricité augmente d'environ 10 %
par an, et la demande de carburant pour le transport augmente encore plus (BAD,
2010). Cette situation se traduit par d’énormes difficultés pour le gouvernement
malien et les opérateurs nationaux cherchant à réduire les importations de
combustibles fossiles, ainsi que pour la société d’électricité nationales et les
investisseurs privés s’efforçant de fournir suffisamment d’électricité à un prix
raisonnable.

Une grande partie de la production d’électricité vient de l’hydroélectricité à grande
échelle produite sur les fleuves Sénégal et Niger, mais les génératrices diesel petites
et moyennes fournissent encore environ 20 % de la production totale. Même si des
interconnexions sont prévues et construites pour satisfaire une partie de la demande à
l’aide de l'électricité produite à partir du gaz naturel au Ghana et en Côte d’Ivoire, il
existe encore de bonnes raisons politiques et économiques d’exploiter les abondantes
ressources énergétiques renouvelables du pays, telles que l’hydro-énergie, l’énergie
solaire, l’énergie éolienne, les résidus de la biomasse issus de l’agriculture et les
cultures énergétiques destinées à la production de biocarburants liquides.

Depuis les années 1980, le Mali a lancé, en coopération avec un certain nombre de
partenaires du développement, un certain nombre de projets et de programmes de
développement visant à augmenter l’utilisation des sources d’énergie renouvelables.
Le ministère des Mines, de l’énergie et de l’eau a élaboré une stratégie pour le
développement des énergies renouvelables au Mali, qui a été adoptée par le Conseil
des ministres le 26 décembre 2006 (MMEE 2007). Cette stratégie combine les
efforts de réduction de la pauvreté, de validation des ressources énergétiques
nationales et de garantie de la sécurité à long terme et de la viabilité
environnementale de l’approvisionnement énergétique. Compte tenu de
l’augmentation rapide des prix des carburants importés, tels que le gazole et
l’essence, l’évaluation de la possibilité de donner aux sources d'énergie
renouvelables un rôle central dans le futur système énergétique présente un intérêt
croissant : ces sources d’énergie renouvelable respectueuses de l’environnement sont
abondantes au Mali et deviennent de plus en plus concurrentielles.

Afin de planifier leurs futurs investissements dans le secteur des énergies
renouvelables, les autorités énergétiques maliennes, Electricité du Mali (EDM), les
opérateurs privés et les partenaires de la coopération internationale ont souhaité avoir
une évaluation plus précise de l’importance et des variations des ressources
d’énergies renouvelables au Mali. Par conséquent, l'Association nationale de
développement du Danemark (DANIDA), a financé une cartographie des ressources
d’énergies renouvelables intitulée « Faisabilité des ressources d'énergies
renouvelables au Mali ».

Une première phase d’évaluation du projet a eu lieu en 2007-2008. Le rapport du
projet soumis en 2008 et intitulé « Carte provisoire des ressources d’énergie
renouvelables du Mali » s’appuie entièrement sur des données satellite et des
modèles météorologiques.

Le présent projet a poussé la première étude plus loin en ajoutant des mesures au sol
des ressources éoliennes et solaires, ainsi que des études approfondies sur le terrain

                                                                                       7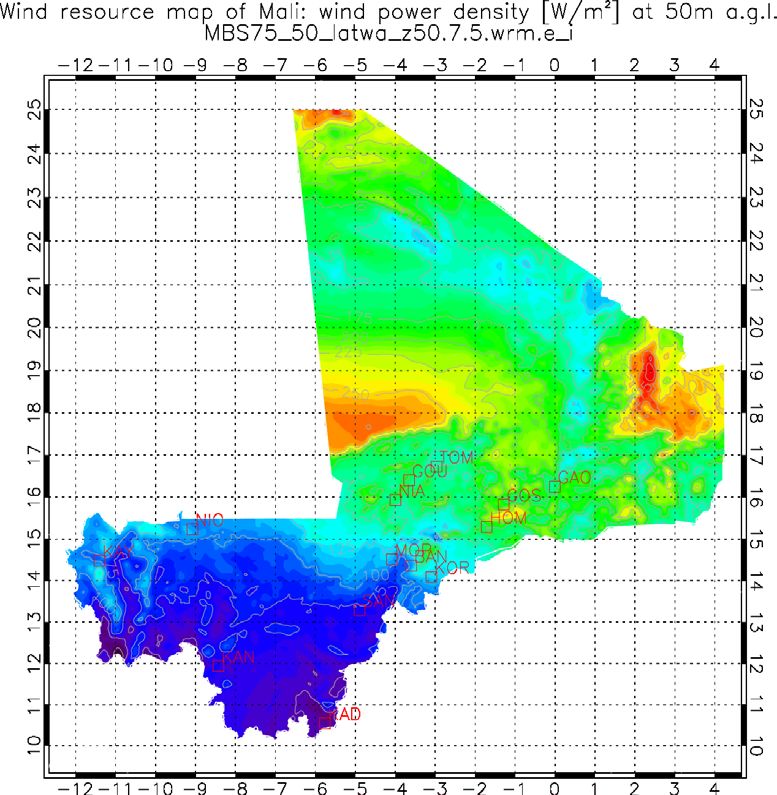
visant à évaluer les possibilités d’utiliser les déchets de la biomasse pour produire de
l’énergie et les impacts socio-économiques de la culture du manioc pour produire du
biocarburant. Toutefois, les ressources d’énergies renouvelables n’ont pas toutes été
cartographiées. L’exception la plus importante est le stock de ressources d’énergie
contenu dans la végétation ligneuse du Mali, qui ne peut pas être facilement évalué à
l’aide de données satellite et est en cours d’évaluation par d’autres projets.

Le présent projet a produit 5 rapports principaux :

1) Analyse des possibilités de production durable de bioéthanol à partir du manioc
   au Mali
2) Résidus agricoles pour la production d’énergie au Mali
3) Etude de préfaisabilité d’une centrale électrique à paille de riz
4) Estimation des ressources éoliennes et solaires au Mali
5) Examen des applications réalisables de production d’énergie éolienne et solaire
   au Mali : évaluation basée sur les cartes des ressources éoliennes et solaires du
   Mali.

Ce projet est mené par un groupe de départements universitaires, d’institutions de
recherche et de consultants dirigé par le Centre Risø du PNUE (CRP) de l’Université
technique du Danemark (DTU), en collaboration avec la Direction nationale de
l’énergie (DNE) et le Centre national de l’énergie solaire et des énergies
renouvelables (CNESOLER) du Mali. Les institutions sous-traitantes sont DTU
Wind Energy, DTU Electrical Engineering, Geographic Resource Analysis &
Science A/S (GRAS), Department of Geography and Geology (DGG), Université de
Copenhague, Ea Energy Analyses, 3E, Ecole nationale d’ingénieurs-Abderhamabe
Baba Touré (ENI-ABT) et Mali Folkecenter Nyetaa (MFC)

8
3 The electricity sector in Mali

3.1   Electricity sector reform

Le secteur de l’énergie électrique au Mali a été affecté par des profondes réformes
qui ont pris place entre 1995 et 2000, à la fois au niveau institutionnel et
organisationnel.

Au plan institutionnel les principales réformes intervenues dans le secteur de
l'électricité ont été les suivantes :
     • la privatisation de l’Énergie du Mali, par contrat de concession signé le 21
          décembre 2000 entre l'État et le groupement Saur International / Industrial
          Promotion Services West Africa, ce dernier détenant 60% des actions, les
          40% étant pour l'État, qui pourra les céder à des privés nationaux ou sous-
          régionaux ;
     • la mise en place de la Direction Nationale de l'Énergie, à partir de septembre
          1999 ;
     • la mise en place de la Commission de Régulation de l'Électricité et de l'Eau
          Potable, à partir du 15 mars 2000 ;
     • l'instauration d'un Fonds national de l'électrification rurale.

Depuis le 31 décembre 2005, après le retrait de Saur International, les actionnaires
de la société sont désormais l’État avec 66% des parts et Industrial Promotion
Services West Africa avec 34%.

En outre, ces réformes du secteur de l'électricité ont favorisé la diversification des
opérateurs intervenant dans le secteur. Ainsi, on note en plus d’EDM.SA,
concessionnaire du service public électricité intervenant dans 97 localités réparties
sur le territoire national, l’émergence de nouveaux opérateurs de projets pour
l’électrification rurale, conventionnés par l’Agence Malienne pour Énergie
Domestique et de l’Électrification Rurale et plusieurs autres opérateurs produisent de
l'électricité pour leur propre compte.

Depuis, la réforme globale du secteur de l’électricité et de l’eau potable, entreprise
par le gouvernement du Mali, à partir de 1998, tous les nouveaux textes législatifs et
réglementaires se sont imprégnés de la politique de décentralisation et aussi de la
politique de privatisation. En outre, ils clarifient les rôles et les responsabilités des
principaux acteurs.

La politique énergétique nationale, adoptée en 2006, sous-tend la stratégie macro-
économique du gouvernement du Mali. Son objectif global est de ‘’contribuer au
développement durable du pays, à travers la fourniture des services énergétiques
accessibles au plus grand nombre de la population et favorisant la promotion des
activités socio-économiques’’. Pour ce faire, elle est bâtie autour des quatre objectifs
spécifiques suivants :
    • satisfaire les besoins énergétiques du pays en qualité, en quantité et au
         moindre coût ;
    • assurer la protection des personnes, des biens et de l’environnement contre
         les risques inhérents aux services énergétiques ;
    • renforcer les capacités d’orientation, de gestion, de contrôle et de pilotage
         stratégique du secteur de l’énergie ;

                                                                                       9
•    renforcer pour le pays, les avantages de la coopération internationale dans le
           domaine de l’énergie.

3.2       Structure et organisation sectorielles

Au Mali, divers intervenants du secteur de l’énergie existent aussi bien dans le
secteur public que dans le privé ; les principaux en sont les suivants.

3.2.1      Institutions publiques

Parmi les institutions gouvernementales, il y a d’abord l’État qui est chargé de
définir la politique sectorielle de l’énergie, d’assurer le développement du secteur
dans l’ensemble du pays ainsi que la maîtrise d’ouvrage. Cette responsabilité de
l’État est assurée par le Ministère de l'Énergie et de l'Eau (MEE) ayant sous sa tutelle
les services techniques centraux ou spécialisés suivants :
     • la Direction Nationale de l'Énergie (DNE), service central, le Centre
         National de l'Énergie Solaire et des Énergies Renouvelables, service rattaché
         à la DNE, et les Directions Régionales de l'Hydraulique et de l'Énergie ainsi
         que les Services Subrégionaux de l'Hydraulique et de l'Énergie,
         démembrements de la DNE, qui ont pour missions, notamment (i) d’évaluer
         le potentiel des ressources énergétiques et veiller à leur mise en valeur, (ii)
         d’étudier, de contrôler et de superviser les travaux de réalisation des
         ouvrages énergétiques et veiller au respect des prescriptions techniques et
         des normes de sécurité, (iii) de participer aux actions de coopération dans le
         domaine énergétique ;
     • l’Agence Malienne pour le Développement de l’Énergie Domestique et
         l’Électrification Rurale, (AMADER) service spécialisé, est l’organe chargé
         de la maîtrise de l’énergie domestique et du développement et l’accès des
         populations rurales et périurbaines aux services d’énergies modernes ;
     • l’Agence Nationale pour le Développement des Biocarburants (ANADEB),
         est l’organisme chargé du développement et de la maitrise de l’exploitation
         et l’utilisation des biocarburants ;
     • l’Agence Malienne de Radioprotection, service spécialisé ;
     • l’Autorité pour la Promotion de la Recherche Pétrolière au Mali, service
         spécialisé.
     • Le MEME partage cette responsabilité de l’État avec les départements
         ministériels et les services techniques centraux et spécialisés suivants :
     • le Ministère de l’Économie et des Finances, ayant sous sa tutelle l’Office
         National des Produits pétroliers, service spécialisé ;
     • le Ministère des Mines, ayant sous sa tutelle la Direction Nationale de la
         Géologie et des Mines, service central, qui est chargé notamment d’assurer
         la responsabilité de la recherche et de l’exploitation des hydrocarbures ;
     • le Ministère de l’Environnement et de l’Assainissement, ayant sous sa tutelle
         la Direction Nationale de la Conservation de la Nature, service central ;
     • la Commission de Régulation de l'Électricité et de l'Eau, placée sous
         l'autorité directe du Premier Ministre, est l’organe indépendant chargé de
         veiller à l’application de la politique tarifaire et d’effectuer la régulation du
         service public de l’électricité et du service public de l'eau potable dans les
         centres urbains.

En plus de ces institutions gouvernementales nationales en charge de l’énergie,
viennent s’ajouter d’autres institutions inter gouvernementales dont l'Organisation
pour la Mise en Valeur du Fleuve Sénégal (OMVS), institution sous-régionale

10
regroupant le Mali, le Sénégal et la Mauritanie, qui possède le barrage à but multiple
de Manantali au Mali.
Il existe d’autres programmes d'énergie au sein d'organisations sous-régionales
auxquelles le Mali participe, notamment de la Communauté Économique des États
de l’Afrique de l’Ouest, de l’Union Économique et Monétaire Ouest Africaine et du
Liptako Gourma. On peut citer entre autres le projet d'interconnexion Mali Côte
d'Ivoire prévu pour 2012, l’interconnexion Ghana-Burkina Faso-Mali en 2014 et le
projet d’interconnexion avec la Guinée en 2021.
Par ailleurs, les collectivités territoriales sont appelées à être des acteurs essentiels
dans le développement du secteur de l’énergie, notamment de l’électrification rurale
et de la gestion des ressources énergétiques nationales.
3.2.2 Opérateurs du secteur
La compagnie « Energie du Mali » (EDM sa), résultat de la privatisation en 2000 de
la compagnie du même nom, détient le monopole pour assurer les services de
fourniture de l’électricité. EDM est concessionnaire pour 20 ans de l’ensemble des
moyens de production, transport et distribution d’électricité ainsi que la gestion de la
commercialisation de l’électricité et des achats avec les pays frontaliers.
La compagnie Eskom Energie Manantali (EEM sa), constituée dans le cadre du
Projet Énergie de l'OMVS, constitue la société de gestion de patrimoine qui a reçu le
droit d'usage sur le barrage de Manantali et les autres ouvrages de production et de
transport d'énergie électrique construits.
Les auto-producteurs, telles que les raffineries de sucre ou l’huilerie cotonnière du
Mali sont des opérateurs privés ayant signés des conventions de financement avec
l’Agence Malienne pour Énergie Domestique et de l’Électrification Rurale sur base
de candidatures spontanées pour l’électrification rurale.
Plusieurs entreprises, opérateurs économiques, industriels ou bureaux d’études
interviennent dans (i) la production, la vente, l’installation ou la maintenance de
produits et équipements énergétiques (thermiques, hydroélectriques, solaires
photovoltaïques, biomasse, gaz domestique), (ii) les travaux d’installations
électriques, (iii) les études et l’ingénierie conseil en matière d’énergie.
D’autres opérateurs privés sont chargés, dans le cadre de délégation du service
public accordée par le maître d’ouvrage, de la réalisation ou de la gestion et de la
maintenance des installations d’électricité.
3.2.3 Organisations non gouvernementales
Quelques Organisations Non Gouvernementales visent à développer avec les
institutions publiques des projets énergétiques en faveur des populations urbaines et
surtout rurales. Elles interviennent essentiellement dans les actions de promotion et
de sensibilisation des populations et, en minorité, dans la production et la
commercialisation des équipements énergétiques.
3.2.4 Partenaires techniques et financiers
Les partenaires techniques et financiers du secteur de l’énergie sont essentiellement
les projets, appuyés par les organismes bilatéraux et multilatéraux (Banque
11Mondiale, PNUD/FEM, GTZ, KfW, ONG, etc.), les organismes étatiques, et en minorité, les particuliers. 3.2.5 Associations de consommateurs Quelques associations de consommateurs sont actives au Mali. Elles militent pour la préservation des intérêts des consommateurs, en terme de qualité, de quantité et de prix sur les produits de grande consommation tels que l’électricité et les combustibles et jouent un rôle d’information et de sensibilisation des consommateurs et des autorités publiques sur les problèmes liés à la grande consommation. 12
3.3     Demand forecast for electricity in the integrated system

The forecast of the demand for electricity in Mali for this study is mainly based on
data from a Master Plan for Investment in the electricity sector in Mali conducted by
SOGREAH Consults for the DNE in 2008 and finally published in 2009
(SOGREAH 2009; SOGREAH 2008a; SOGREAH 2008b; SOGREAH 2008c). The
Master Plan is, along with the regional study from the West African Power Pool
(WAPP 2011c), the most comprehensive planning document for the Malian
electricity sector made available to the authors in February 2012, when this report
was drafted.

3.3.1    Demand forecast

The demand forecast is based on the assumption that a number of non-grid
connected towns, centres isolées, will be connected to the integrated system, reseau
interconnecté, (RI) according to the planning shown in Figure 3.3. This is especially
related to the realisation of la Boucle de Selingue, which according to the plan will
increase the demand significantly in 2011, 2012 and 2017.

The interest of the non-grid connected towns to connect to the grid is to substitute
thermal production with lower cost production such as hydro-power or imported
electricity.

Table 3.1. Forecast of annual demand in the integrated system (from Master Plan)

      MWh        Low scenario           Base scenario            High scenario
      2007           835 028                  835 028                835 028
      2008           878 038                  897 265                916 492
      2009           932 649                  963 623                994 596
      2010          1 000 444               1 045 240               1 090 036
      2011          1 207 271               1 275 607               1 343 943
      2012          1 433 294               1 531 765               1 630 235
      2013          1 506 743               1 628 911               1 751 080
      2014          1 580 642               1 728 827               1 877 012
      2015          1 712 008               1 894 713               2 077 417
      2016          1 797 511               2 013 213               2 228 914
      2017          2 026 716               2 297 491               2 568 267
      2018          2 165 313               2 484 785               2 804 257
      2019          2 258 003               2 623 406               2 988 809
      2020          2 354 473               2 769 968               3 185 463

As shown in Table 3.1, the expected annual demand for electricity varies between
2,354 and 3,185 GWh at the end of the period, which is more than three times the
demand in 2007. The demand forecast for the three scenarios is illustrated in Figure
3.1

                                                                                   13
3,500,000
3,000,000
2,500,000
2,000,000
Low scenario
Mwh
1,500,000 Base scenario
High scenario
1,000,000
500,000
0
2007
2008
2009
2010
2011
2012
2013
2014
2015
2016
2017
2018
2019
2020
Figure 3.1. Annual demand for electricity in RI (from Master Plan)
The Master Plan also forecasted the peak-load until 2020, which is shown in Table
3.2 and graphically in Figure 3.2. In line with the annual demand, the peak load is
expected to more than triple in 15 years.
Table 3.2. Projections of peak demand in the integrated system (RI)
MWh Low scenario Base scenario High scenario
2007 144 144 144
2008 154 154 154
2009 161 166 172
2010 173 180 188
2011 203 214 226
2012 235 251 268
2013 248 268 289
2014 261 286 310
2015 283 313 343
2016 298 334 370
2017 331 375 419
2018 355 408 460
2019 372 432 492
2020 389 457 526
Compared to the forecasts in « La politique énergétique nationale » from February
2006, the base scenario reaches the same level by 2020 (MMEE 2006. The
SOGREAH scenario, however, predicts a lower level in both 2010 and 2015.
Comparison is made in Table 3.3 below.
Table 3.3. Comparison of demand forecasts in SOGREAH (2009) and MMEE (2006)
Master Plan 2009 base scenario National energy policy, 2006
GWh MW GWh MW
2010 1 045 180 1310 230
2015 1 894 313 2110 370
2020 2 769 457 2680 465
14600
500
400
Low scenario
Peak load (MW)
300
Base scenario
200 High scenario
100
0
2007
2008
2009
2010
2011
2012
2013
2014
2015
2016
2017
2018
2019
2020
Figure 3.2. Forecast of peak demand in the integrated system (RI) (from Master Plan)
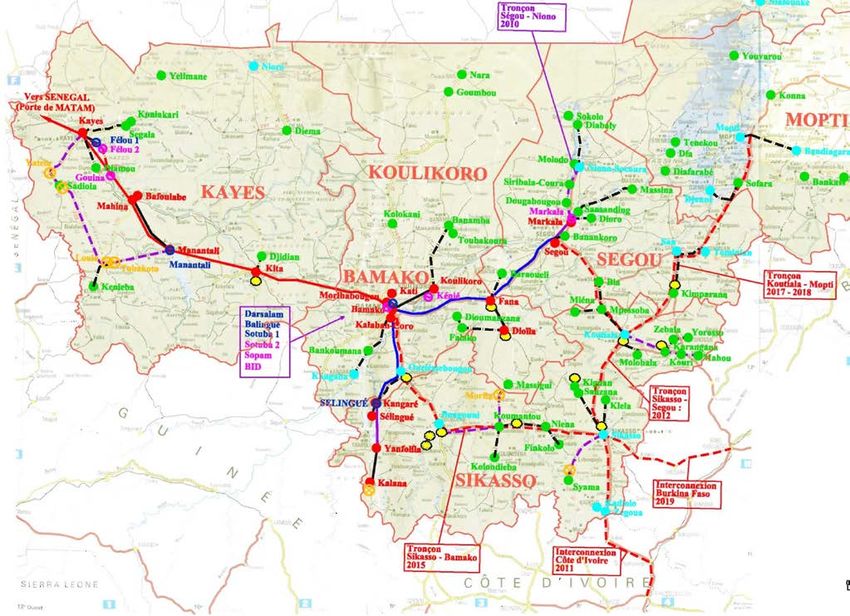
3.3.2 Extension of the integrated system
The long term plan for extension of the integrated system as presented in the Master
Plan is shown in Figure 3.1 (SOGREAH 2009). The map provides information on
two different issues:
The first issue is the connection of isolated centers to the integrated system.
The exact timing may prove to be different, but this plan gives strong indications on
which isolated towns will be connected in the near future and hence which towns
will experience lower costs. This will be of importance for the evaluation of the
feasibility of connecting solar, wind and biomass to the grid in existing isolated
centers. This will be dealt with more in detail in section 3.3.4.
The second issue is the plans for transnational transmissions lines, interconnections
from neighboring countries. As transnational transmission lines will lower the price
for electricity in the integrated system, the first operation date for these transmission
lines will be of importance for the feasibility of connecting solar, wind and biomass
producing units to the interconnected grids. This issue is dealt with in more details
in section 3.3.4.
15Figure 3.3. Long term plan for interconnections in the integrated system. (from Master Plan)
3.3.3 Existing and planned production units for electricity and planned
import
Installed thermal and hydro capacity in the integrated system by 2010 is shown in
Table 3.4, and the prospective planned production units and interconnections for
import of electricity are shown in Table 3.5. Besides installed capacity the tables
also provide estimated average production costs per kWh depending on the crude oil
price in USD/barrel.
Relationship between crude oil price and fuel cost for diesel (DDO) and heavy fuel
oil (HFO) are shown in Figure 3.4. Data are based on back ground info from the
Master Plan (SOGREAH 2009).
16Price of DDO Price of HFO
800,000 500,000
700,000 450,000
400,000
600,000
350,000
500,000
FFCA/tonne
FCFA/tonne
300,000
Price an harbour Price an harbour
400,000 250,000
Transport Transport
300,000 200,000
Profit Profit
150,000
200,000 TOTAL TOTAL
100,000
100,000 50,000
- -
65 75 85 95 105 115 125 65 75 85 95 105 115 125
USD/barrel USD/barrel
Figure 3.4. Relationship between crude oil price in USD/baril and fuel cost in Bamako in
FCA/tonne.
Table 3.4. Production capacity in the integrated system in 2010 and estimated production
costs per unit
Crude oil price (USD per barrel) 75 USD/b. 100 USD/b. 125 USD/b.
Installed Specific Fixed
Production unit Fuel type Total Costs
capacity consump. costs
MW g/kWh CFA/kWh CFA/kWh CFA/kWh CFA/kWh
DarSalam_TAC DDO 24.6 340 20 179 219 259
DarSalam_secour DDO 0.7 260 20 141 172 203
DarSalam_MTU_G8 - G11 DDO 8.8 220 20 123 149 175
GPS Darsalam DDO 18.0 220 20 123 149 175
Agreeko DDO 30.0 220 20 123 149 175
Balingue_MWM_G1 - G4 DDO 23.7 216 15 116 141 167
Balingue_MTU_G5 - G8 DDO 8.8 215 15 115 141 166
SOPAM HFO 56.0 210 20 88 103 119
BID HFO 45.0 210 20 88 103 119
Thermal capacity 215.6
Manantali Hydro 104.0 24
Sélingué Hydro 46.2 36
Félou Hydro 0.6 37
Hydro capacity 150.8
Total capacity 366.4
Source: Compiled based on EDM annual report 2010 (EDM 2011) and (SOGREAH 2008a) 1.
Table 3.5. Foreseen new thermal capacity in the integrated system
Crude oil price (USD per barrel) 75 USD/b. 100 USD/b. 125 USD/b.
Installed Specific Fixed
Production unit Fuel type Total Costs
capacity consump. costs
MW g/kWh CFA/kWh CFA/kWh CFA/kWh CFA/kWh
Centrale albatros HFO 92.2 210 20 88 103 119
Extension of BID HFO 20.0 210 20 88 103 119
Thermal capacity 112.2
Source: Based on (SOGREAH 2008a) and (EDM 2011)
1 Specific consumption is based on (SOGREAH 2008a) and (EDM 2011). Fixed costs for Darsalam
and Balingue are estimated based on financial information from 2006 and 2007 in SOGREAH back
ground material. Fixed cost for SOPAM and BID based on (SOGREAH 2008a) and fixed cost for
Agreko and GPS Darsalam are roughly estimated.
17Table 3.6 Planned capacity from hydro and import from neighbouring countries
Installed
Cost
Year Production unit Production type capacity
CFA/kWh
(MW)
100
Import from Cote D'Ivoire.
Interconnexion
2012 Capacity depending on availabiltiy 150 45 - 50
Cote d'Ivoire - Mali
in Cote D'Ivoire or Ghana
200
2013 Félou Hydro power 3 x 20 37
2014 Interconnexion Ghana-Burkina-Mali 160 65 - 100
2013 Markala Hydropower 3 x 2,5 56
2014 Sotuba 2 Hydropower 2 x 2,5 64
2015 Kénié Hydropower 3 x 14 46
2015 Talo Hydropower 2 98
2018 Gouina Hydropower 3 x 28,33 29
2021 Interconnexion Guinée 200 Not fixed
Source: Based on (EDM 2011) and (WAPP 2011b).
The planned future capacity from hydropower and from interconnections to
neighbouring countries are shown in Table 3.6. The interconnection from Cote
D’Ivoire was under construction in February 2012. Also the hydropower project in
Felou was under construction, while the stage of development of Markala is unclear.
According to (EDM 2011) and (WAPP 2011b) the projects of Sotuba 2, Kénie og
Talo are still at the planning stage.
The interconnections with Ivory Coast and Ghana are part of a regional planning
ensured by the West African Power Pool (WAPP). The latest updated regional plan
for the WAPP region was launched in 2011, and documented in (WAPP 2011a;
WAPP 2011b; WAPP 2011c). The objective of the West African power pool is to
reduce the cost of electricity in the region by interconnecting national grids and
substitute expensive diesel generation by electricity from hydropower and from
natural gas produced in countries such as Nigeria and Ghana.
Details for the three interconnections to Cote D’Ivoire, Burkina-Ghana and Guinea
planned to be in operation in 2012, 2014 2 and 2021 are already shown in Table 3.5.
They are all reflected in the regional plan from WAPP with minor differences in date
of operation.
Future costs of electricity in the WAPP will depend on specific contracts. According
to WAPP, the interconnection Mali – Burkina – Ghana, which is expected to be in
operation 2014 or 2015 will transport electricity from a new 400 MW combined
cycle plant in Aboadze (Ghana) (WAPP 2011b; 51).
The combined cycle plant will be fuelled by natural gas from Nigeria transported
through the West African Gas Pipeline. Recent problems in delivery of gas from the
West African Gas Pipeline to Ghana due to a ship accident, illustrates, that although
from the outset a cheap alternative, import from neighbouring countries may entail a
certain risk in terms of prices and in terms of security of supply (Africa Report
2012).
2 2015 according to WAPP (WAPP 2011c)
18The price per kWh will highly depend of how this risk is shared among the parties.
According to information from EDM in February 2012, the price is expected to be
between 65-100 CFA kWh, which is higher than for hydropower but lower than for
diesel generation.
Figure 3.5. High voltage transmission networks and prospective interconnection projects
(Source : WAPP 2011c)
3.3.4 Future avoided costs in the integrated system
For the analysis of the cost and benefits for EDM to include new production costs it
is necessary to estimate the avoided cost in the future. Avoided cost will be the
production cost for the most expensive unit which is running at a given time.
Figure 3.6 shows the monthly production from the existing production units in 2010.
The figure shows that the gas turbine at Darsalam, which is the most expensive unit,
is mainly producing during the month March to July, when the demand is highest.
During the rest of the year, e.g. in September 2010, it will only cover the morning
and the evening peak.
19Figure 3.6. Monthly production from production units in 2010: Source: (EDM 2011) This means that avoided costs depend on the time of the year and on the time of the day. Given that the thermal units will mainly be applied taking a least cost approach, the avoided cost for thermal units depending on the actual thermal load is shown in Figure 3.7 for different oil price scenarios. In the 100 USD/barrel scenario avoided costs for the gasturbine in Darsalam is 219 CFA/kWh, while the avoided costs for the diesel units at DarSalam, Agreeko and Balingué are in the range from 141-149 CFA/kWh. Avoided costs for the units SOPAM, BID and Albatros are in the range of 103 CFA/kWh. If the hydropower and the interconnections are established according to the plans above, the existing thermal units will only be used for peak-load and reserve. Figure 3.7. Costs curve for thermal production (based on Table 3.4 and Table 3.5) In this case the marginal cost in the system will be the interconnection with the highest cost, namely 65-100 FCFA/kWh, which is the expected cost for the interconnection Ghana, Burkina, Mali. This situation is reflected in the planning from DME, according to which the shares of electricity from hydro, thermal and interconnections will develop as shown in Figure 3.8 (SOGREAH 2008b). 20
Figure 3.8. Electricity production according to the planning in by DME (SOGREAH 2008b)

Future avoided costs in the system will be thus be dependent on: i) the increase in
future demand and ii) the extent to which the planned interconnections and
hydropower plants will be commissioned on time and be able to deliver the
estimated amounts of power. Large projects dependent on international funding such
as hydropower schemes and interconnections are most often delayed compared to the
original plans. This is mainly due to i) difficulties in cooperation between one or
several countries, ii) difficulties in bringing projects to financial closure, and iii)
difficulties in finalising big infrastructure projects within the timeframe.

Figure 3.9. Energy mix in the integrated system according to predictions from the World
Bank (WB 2009).

This is probably why the World Bank in its appraisal report of the support program
for EDM is taking a more conservative approach in its prediction of future power
supply (WB 2009). The World Bank prediction shows a higher demand than the
PLAN 2009, and maintains that 20 % of the production will be delivered by thermal
power plants, as illustrated in Figure 3.9.

                                                                                    21
The marginal costs in this case will hence be around of 103 CFA/kWh in the 100 USD/barrel scenario, and around 119 CFA/kWh for the 125 USD/barrel scenario. 3.3.5 Conclusion Based on the load curves in 2010, and an oil price of 100 USD/barrel, the marginal production cost in the integrated system is varying between 201 and 141 CFA/kWh depending on the time of the year. This cost level will continue until the interconnection to Ferkessedou, Cote d'Ivoire will be in operation in 2012. According to the Master Plan, after 2015 marginal costs will be between 65 and 100 FCFA (SOGREAH 2009). The exact cost will depend on the final outcome of negotiations of sales price for electricity to the Ghana – Burkina Faso, Mali interconnection. In case demand increases faster than predicted and in case of unforeseen delays in commissioning interconnections and hydro power plants there will still be a demand for thermal power in the system in the range of 20 %. In this case marginal production cost will be around 103 CFA/kWh in a 100 USD/barrel scenario and 120 CFA/kWh in the 125 USD/barrel scenarios. 3.4 Demand forecast in the isolated grids (Centres isolées) EDM is currently operating 19 isolated grids in Mali. The 19 centres are shown on the map in Figure 3.10 below. Figure 3.10. Map of Mali showing the current status of connection to the integrated systems (RI). (SOGREAH 2008c) 22
Sikasso, Koutiala and Niono will be connected to the integrated system in 2012.
Data for the 16 centres are shown in Table 3.7 below.
Table 3.7. Installed capacity, peak load, annual production and production costs in isolated
centres
Installed Estimated Estimated
Annual Production (1) Production cost (2)
Town capacity (1) Peak load (1) load (2) peak load (2)
Mwh CFA/kWh
MW Mwh MW
2009 2005 2010 Increase 2005 2010 Increase 2006 2007 2020 2020
Mopti/sevaré 7.20 3.50 5.26 8.5% 19,302 28,436 8.1% 140 133 47,133 8.7
Gao 6.51 2.00 3.23 10.1% 11,180 16,805 8.5% 159 146 33,487 6.4
Tombouctou 4.61 1.18 2.21 13.4% 6,049 11,415 13.5% 186 174 24,533 4.7
Bougouni 2.46 0.91 1.43 9.5% 4,423 7,354 10.7% 151 129 17,135 3.3
San 3.66 0.81 1.59 14.4% 3,765 7,162 13.7% 162 159 20,105 4.5
Niono 2.61 1.07 1.53 7.3% 5,058 6,595 5.5% 166 156 Connected to RI in 2012
Nioro 1.51 0.57 0.89 9.3% 2,727 4,697 11.5% 180 134 6,415 1.2
Kidal 2.96 0.46 0.99 16.5% 1,994 4,554 18.0% 187 129 7,283 1.6
Bandiagara 1.45 0.28 0.49 12.2% 1,067 2,248 16.1% 174 205 4,348 0.9
Douentza 0.88 0.21 0.41 14.0% 760 1,927 20.5% 249 181 3,484 0.7
Djenné 1.44 0.29 0.44 8.9% 1,028 1,860 12.6% 179 165 4,502 1.1
Dire 0.76 0.21 0.47 18.2% 781 1,702 16.9% 193 210 4,465 1.2
Goundam 0.72 0.20 0.35 12.2% 617 1,414 18.0% 265 192 4,837 1.2
Kangaba 0.45 0.14 0.23 10.7% 637 1,236 14.2% 192 190 1,765 0.3
Niafunke 0.66 0.18 0.26 7.3% 759 1,121 8.1% 196 207 2,662 0.6
Ouelessebougou 0.44 0.12 0.21 10.8% 544 947 11.7% 275 190 5,862 1.3
Tominian 0.24 0.14 0.17 4.1% 412 773 13.4% 212 210 1,595 0.4
Reseau
Tombouctou 6.75 1.76 3.28 13.3% 8,206 15,652 13.8% 195 182 36,497 7.8
Note: 1) is based on EDM annual report (EDM 2011) and 2) is based on production costs from EDM
available in background information for Master Plan (SOGREAH 2008b).
Ouelessebougou was equipped with a 220 kWc solar PV system in 2011 as the first
hybrid system operated by EDM. All the isolated centres are potential markets for
hybrid systems for wind or solar PV.
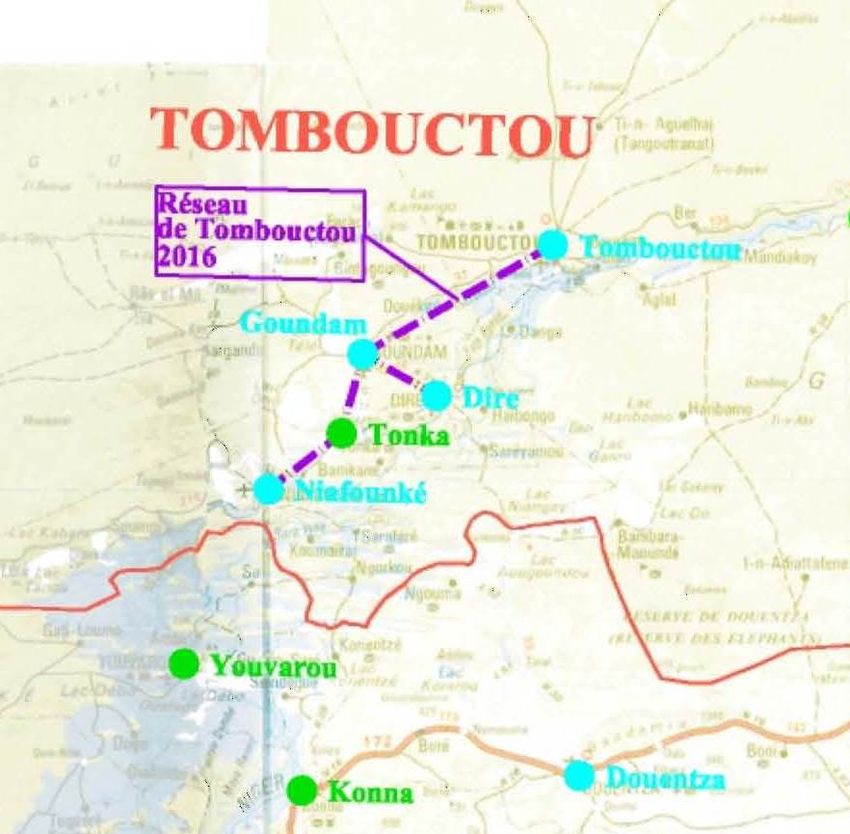
3.4.1 Tombouctou grid
According to the Master Plan, 5 centres consisting of Tombouctou, Goundam, Dire,
Tonga and Niafunke, should be interconnected by a new 65 kV grid (Reseau
Tombouctou) by 2016. Reseau Tombouktou could hereby be a potential candidate
for a larger hybrid solar or wind diesel system, as avoided costs for solar and wind
produced electricity in this system will be higher than in the integrated system.
Further details on the Tombouctou grid is provided in Figure 3.11 and Figure 3.12.
45000
40000
35000
30000 Niafunke
25000 Tonga
GWh
20000 Dire
15000 Goundam
Tombouctou
10000
5000
0
2007 2010 2015 2020
Figure 3.11. Forecast of annual demand in the Tombouctou grid
23Figure 3.12. Map showing the potential grid between Tombouctou and neighbouring towns. Besides the existing 19 centres the following a number of smaller towns are expected to be electrified by EDM from 2012 and onwards with grid extensions from the existing grid. 3.4.2 Monthly variations Integration of solar and wind in small systems will be more feasible from an economic point of view if load variations over the year are similar to the production patterns for wind and solar. As examples, this section shows monthly variations of of demand from the Tombouctou grid in Figure 3.13, from smaller towns in the grid in Figure 3.14 and from Tombouctou itself in Figure 3.15. The load variations are from EDM annual report in 2010 (EDM 2011) Figure 3.13. Monthly variation in the Tombouctou grid (EDM 2011) 24
Figure 3.14. Monthly load variations in three smaller towns in the Tombouctou grid (EDM
2011)

Figure 3.15. Monthly load variations in the town of Tombouctou (EDM 2011)

3.4.3 Diurnal variations
In the isolated centres the daily load curve varies according to the mix of consumers
connected to the grid. This means that load curves will vary significantly from one
grid to another. As an example daily load curves for the week with maximum load
and from the week with minimum load are shown in Figure 3.16 and Figure 3.17.

                                                                                    25
Figure 3.16. Daily load curves for Nioro in the week with maximal load in 2009 Figure 3.17. Daily load curves for Nioro in the week with minimal load in 2009. 3.4.4 Production costs for electricity in isolated centres The production cost for electricity in the isolated centres is considerably higher than in the integrated area. The production prices in 2006 and 2007 are shown in Table 3.7 . Based on the average production price for 2006 and 2007 and given that the oil price in 2006 and 2007 was about 65 USD/barrel, the production price have been estimated for fuel costs of 75, 100 or 125 USD/barrel. These price estimates are shown in Table 3.8. 26
Table 3.8. Estimated production costs for isolated centres based on 2006 and 2007
production costs.

                                          Fuel
                         Specific                          Total production cost (CFA/kWh)
                                      independent
      Town              consump.                             depending on crude oil price
                                          costs

                         g/kWh         FCA/kWh       65 USD/b.   75 USD/b. 100 USD/b. 125 USD/b.
Mopti/sevaré                246.0             33.2       136.6       148.1      177.1        206.0
Gao                         240.9             51.0       152.2       163.5      191.9        220.2
Tombouctou                  259.9             70.8       180.0       192.2      222.8        253.3
Bougouni                    255.5             33.1       140.5       152.5      182.5        212.6
San                         205.5             74.4       160.8       170.4      194.6        218.8
Niono                       272.0             46.6       160.9       173.7      205.7        237.7
Nioro                       232.2             59.3       156.8       167.7      195.1        222.4
Kidal                       239.4             57.3       157.8       169.1      197.3        225.4
Bandiagara                  259.4             80.7       189.7       201.9      232.4        262.9
Douentza                    245.3            111.7       214.8       226.3      255.2        284.0
Djenné                      281.5             53.7       172.0       185.3      218.4        251.5
Dire                        259.2             92.8       201.7       213.9      244.3        274.8
Goundam                     300.0            102.4       228.5       242.6      277.9        313.2
Kangaba                     264.0             80.0       190.9       203.3      234.4        265.4
Niafunke                    269.4             88.6       201.8       214.5      246.2        277.9
Ouelessebougou              271.5            118.4       232.5       245.3      277.2        309.1
Tominian                    272.0             97.1       211.4       224.2      256.1        288.1

The estimated production costs for electricity (100 USD/barrel) at isolated centres
are shown in Figure 3.18.

 Ouelessebougou
       Goundam
       Douentza
       Tominian
        Niafunke
             Dire
        Kangaba
      Bandiagara
    Tombouctou
         Djenné
           Niono
             San
           Kidal
           Nioro
             Gao
       Bougouni
   Mopti/sevaré
                    -          50.0         100.0       150.0       200.0      250.0

Figure 3.18. Estimated production costs for electricity at isolated centres with a fuel cost of
100 USD/barrel

Table 3.8 and Figure 3.18 shows that the avoided costs at the isolated centres are
significantly higher than in the integrated system. This is mainly because the smaller
systems have lower efficiency (higher spec. consumption) and higher operation and
maintenance costs. Therefore smaller installations of solar and windpower in hybrid

                                                                                                27
with existing diesel may be economically feasible in these grids. Further details will
be provided in chapter 5and 7.
3.5 Electrification rurale.
In Mali, smaller towns outside the existing and planned grid is considered to be
included in the rural electrification programme under the responsibility of l’Agence
Malienne pour le Développement de l’Energie Domestique et de l’Electrification
Rurale (AMADER).
AMADER est un Etablissement Public à caractère Administratif (EPA) doté de la
personnalité morale et de l’autonomie financière, créé par la Loi N° 03-006 du 21
mai 2003. L’Agence a pour mission principale la maîtrise de la consommation
d’énergie domestique et le développement de l’accès à l’électricité en milieu rural et
périurbain en vue de réduire la pauvreté et de favoriser la croissance économique du
pays.
Two different approaches to rural electrification were planned in Mali :
1) A concession approach: according to which concessions for rural
electrification should be attributed to private operators after a tendering
process. For the concessions, the country is divided into 8 Zones
d’Electrification Multi - sectorielle (ZEM). The process has been under way
for some years, but in spite of a high level of subsidies it has proven difficult
to attract private operators, which could mobilize the sufficient equity
funding to implement the plans for the zones. According to information
from AMADER in February 2012, this process has come to a halt.
2) An application approach: according to which private operators are asked to
submit proposals for electrification of a specific smaller town or groups of
towns. This approach is called ‘Projets à Candidatures Spontanées’. The
projects are eligible to an investment subsidy (up to 80 % of the initial
investment) depending on the feasibility of the project, and with a maximum
subsidy of …….. 111 smaller towns, with a total number of 32000 clients
had achieved access to electricity through this program by the end of 2010
(AMADER 2011)
A full list of the 111 smaller towns already electrified is provided in Appendix 1,
along with a list of planned projects.
The towns are mainly electrified through mini-grids fuelled by diesel. Due to the
high diesel prices and the reduced cost of solar PV panels, this market seems
interesting for hybrids combining solar PV and diesel. This option is further explored
in section 6.1.3.
3.6 Power purchase agreements
A number of African countries have implemented or are in the process of
implementing general power purchase agreements for renewable energy, such as
solar and wind sold to the grid. Experiences from Africa and elsewhere shows that a
well prepared power purchase agreement can be an important factor for larger scale
implementation of renewable energy sources to the grid (Haselip, Nygaard et al.
2011; Haselip 2011; Pegels 2011 5
28The first individual power purchase agreement in Mali is apparently made between
EDM and the sugar factory SOSUMAR. According to the interview with
management from SOSUMAR, they are planning a bagasse fired power plant of 30
MW el to be established for own consumption of process energy and electricity (27
MW el ) and for electricity to the grid (3 MW el ). According to the interview, a power
purchase agreement has been concluded with EDM, but no details were revealed
(SOSUMAR 2012).
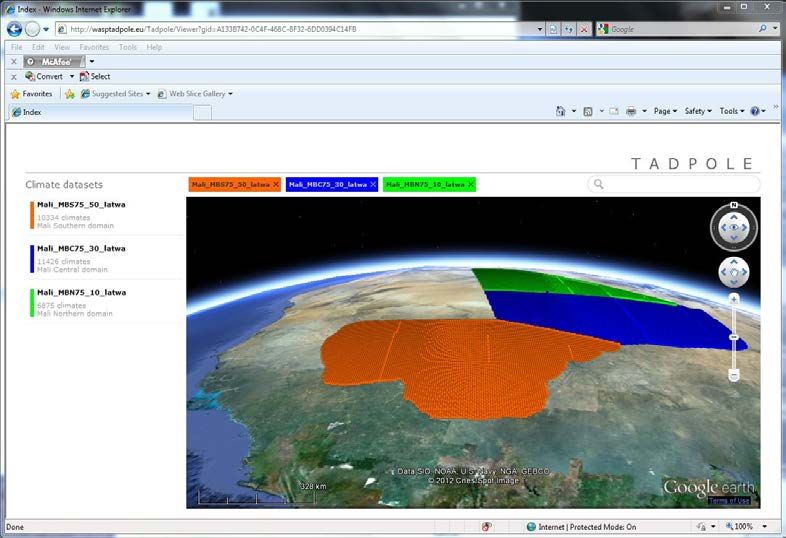
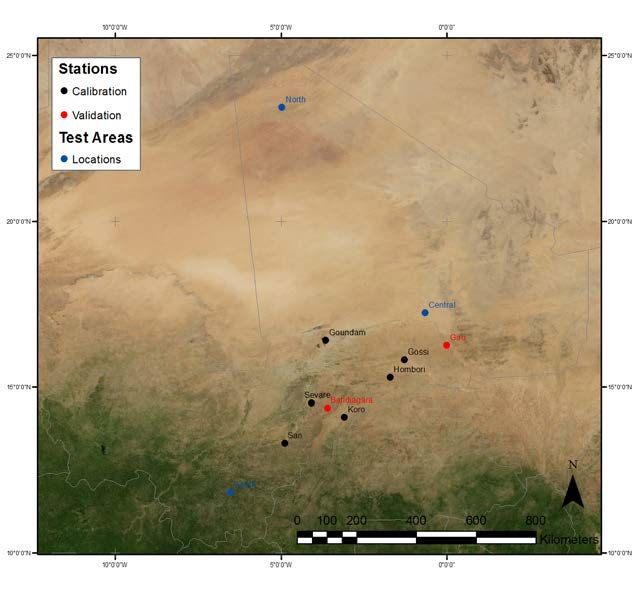
294 Wind resources in Mali This chapter brings a summary of the resource assessment reported in the report ‘Estimation of wind and solar resources in Mali’ (Badger, Larsen et al. 2012), and adds valuable information of the annual and the daily variation of wind speed and wind power density. The chapter ends up discussing the opportunities for large scale integration of wind with existing hydropower capacity. 4.1 Introduction The estimation of the wind resources in Mali is based on a combination of global meteorological data for the past 30 years 3 and local wind measurements at 14 locations over the past years. The two sources of data is combined using the KAMM / WAsP analyses. The results of the analyses are presented in graphical form as wind resource maps. The ‘simulated wind atlas’, based on a KAMM analysis of data from the global data base, indicates the estimated wind resources in a specific height level. The ‘generalized wind atlas’, based on the simulated wind atlas in combination with maps with information on the topography and the surface roughness, indicates the resources at specific height level assuming flat land and homogeneous surface roughness. The actual wind resources for a specific site can then be estimated based on the generalized wind resources for that region in combination with the actual information of the local topography and surface roughness. The local wind measurements serve a double purpose. Firstly they can be used by WAsP to estimate the local wind resources close to the measurement site, and secondly they have been used to evaluate and calibrate the generalized wind atlas. Based on a set of wind speeds and wind directions at a given site and height (either from local measurements or from a KAMM analysis) and detailed information of the local topography and surface roughness, the computer programme, WAsP can be used to estimate the generalized local wind resource as well as the actual wind resource at any given site and height in the local region where the local generalized wind resource is valid (typically in an area of 50-100 km, dependent on the local conditions). 4.2 Local measurements An overview of wind measurements performed since 2008 by CNESOLER at 14 locations is given in Table 4.1 and Figure 4.1. The wind has been measured for at least one year at each site. The measurements are not directly comparable as the measurement heights vary from 22 m to 50 m (Table 4.1), and as the wind resources vary from year to year, as illustrated in Figure 4.9 later in this chapter. The maximum recorded 10-minutes average wind speeds are indicated in the table for each site. None exceeds 45 m/s. 3 http://www.cdc.noaa.gov/cdc/reanalysis/ 30
Exactly one year of wind data have been extracted from each site and screened for
errors as input to WAsP to eliminate seasonal bias in the results, and WAsP regional
wind resource data files have been estimated for each site.

Figure 4.1: An overview of the wind measurements performed by CNESOLER at 14 sites started in 2008.
(Data source: CNESOLER, 2012)

                                                                                     31
Station UTM29 Data from Height Wind Power P@50m
2 2
Goundam E 1072 km N 1821 km 01-03-2009 50 m 5.5 (32) m/s 160 W/m 185 W/m
2 2
Niafunke E 1036 km N 1768 km 01-03-2009 50 m 5.4 (37) m/s 149 W/m 170 W/m
2 2
Tombouctou E 1144 km N 1859 km 01-03-2009 40 m 5.2 (33) m/s 130 W/m 136 W/m
2 2
Koro E 1139 km N 1566 km 01-06-2009 50 m 5.1 (31) m/s 125 W/m 136 W/m
2 2
Kayes E 240 km N 1602 km 01-09-2010 40 m 4.2 (24) m/s 80 W/m 122 W/m
2 2
Gao E 1464 km N 1818 km 01-11-2008 40 m 4.8 (38) m/s 112 W/m 119 W/m
2 2
Nioro E 438 km N 1685 km 01-09-2010 40 m 4.4 (25) m/s 93 W/m 110 W/m
2 2
Bandiagara E 1083 km N 1595 km 01-06-2009 50 m 4.3 (36) m/s 96 W/m 101 W/m
2 2
Mopti E 1030 km N 1610 km 01-11-2008 40 m 4.4 (43) m/s 88 W/m 95 W/m
2 2
San E 945 km N 1473 km 01-06-2009 50 m 4.4 (35) m/s 82 W/m 92 W/m
2 2
Hombori E 1284 km N 1704 km 01-11-2008 22 m 3.9 (37) m/s 91 W/m W/m
2 2
Gossi E 1328 km N 1765 km 01-11-2008 22 m 4.1 (37) m/s 78 W/m W/m
2 2
Kangaba E 563 km N 1321 km 01-09-2010 40 m 3.7 (18) m/s 50 W/m 60 W/m
2 2
Kadiolo E 855 km N 1170 km 01-09-2010 40 m 3.1 (20) m/s 33 W/m 51 W/m
Table 4.1: Measured mean and 10-minutes maximum (in parentheses) wind speeds and calculated wind
power densities at measured height and at 50 m height (@ 1.225 kg/m3 standard air density) for one year of
data for 14 stations during 2008-2011, sorted by the estimated generalized power density at 50 m and 3 cm
surface roughness length. (Data source: CNESOLER, 2012)
4.3 Annual wind resources
4.3.1 Wind speed
The spatial distribution of average wind speed in Mali is illustrated in Figure 4.2.
The figure shows the ‘simulated wind speed’ at 50 m a.g.l based on a KAMM
analysis of data from the global data base. The map has been created using a surface
description at 7.5 km resolution, which means that it does not take into account the
actual, detailed local conditions of the topography (orography) and the surface
roughness. It may therefore be possible to find local sites e.g. with local speed-up
effects due to the topography, providing a higher wind energy potential than
indicated by the maps.
The results are also available as a set of local wind resource data files (WAsP wind
resource input files) at geographical distributed grid points. WAsP input files are
available at the web, as described in section 4.4. Examples of estimation of annual
power generation from cases of wind farms at specific locations using WAsP is
given in section 5.2
32Figure 4.2: Annual mean simulated wind speed in m/s) at 50 m a.g.l. (Badger, Larsen et al. 2012)
4.3.2 Surface roughness and height
In general, the wind resources increase with the height above ground, depending on
the surface roughness. As a first order approximation in the lower surface layer,
relevant for wind power, a logarithmic vertical wind speed profile can be assumed:
u 2 /u 1 = ln(z 2 /z 0 )/ln(z 1 /z 0 )
where
u is the wind speed
z is the height
z 0 is the roughness length (see Table 4.2)
33Class z 0 (m)
3 0.4 Open forest
2 0.1 Farmland with shelters
1 0.03 Open farmland
0 0.0002 Sand / water
Table 4.2: Surface roughness length (Ref: WAsP)
4.3.3 Wind power density
The most useful way to describe the wind resource available at a potential site is
using the concept of wind power density. The wind power density is measured in
watts per square meter and indicates how much energy is available at the site for
conversion by a wind turbine.
The relation between the wind speed and the power in the wind is:
P = ½qAu3
where
P is the power flow
q is the air density
A is the swept area
u is the wind speed
This means that the power density (P/A) is proportional to the air density (see Figure
4.3) and to the cube of the wind speed. Consequently a 10% change in wind speed
corresponds to a 30% change in power density.
1,25
Air density (kg/m3)
1,2
0m
1,15
200m
1,1 400m
1,05 600m
20 30 40
Air temperature (C)
Figure 4.3: Air density as function of the air temperature and the
height level for standard air pressure at sea level.
34In the literature, sites are classified according to wind power density as shown in
Table 4.3. The wind resource map, showing the spatial distribution of annual
simulated wind power density is shown in Figure 4.4. This map is the most
illustrative map for visual identification of potential sites.
Table 4.3: Wind power classes
Wind power Power density Indicative Power density Indicative
class W/m² at 10 m wind speed W/m² at 50 m wind speed
1 0-100 0-4.4 0-200 0-5.6
2 100-150 4.4-5.1 200-300 5.6-6.4
3 150-200 5.1-5.6 300-400 6.4-7.0
4 200-250 5.6-6.0 400-500 7.0-7.5
5 250-300 6.0-6.4 500-600 7.5-8.0
6 300-400 6.4-7.0 600-800 8.0-8.8
7 400-1,000 7.0-9.4 800-2,000 8.8-11.9
Figure 4.4: Estimated average wind power density for Mali (in W/m2) at 50 m height level (Badger,
Larsen et al. 2012)
35Vous pouvez aussi lire