Consumer Mobility, Online and On-site Commerce and the Geographic Concentration of Economic Activity: Evidence from 20 Billion Transactions ...
←
→
Transcription du contenu de la page
Si votre navigateur ne rend pas la page correctement, lisez s'il vous plaît le contenu de la page ci-dessous

Consumer Mobility, Online
and On-site Commerce and
the Geographic Concentration
of Economic Activity: Evidence
from 20 Billion Transactions

DAVID BOUNIE
YOUSSOUF CAMARA
JOHN W. GALBRAITH

                                  2021S-17
                       CAHIER SCIENTIFIQUE   CS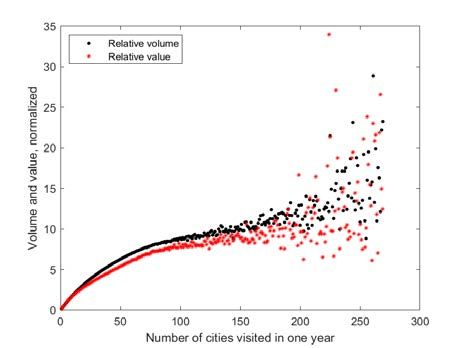
The purpose of the Working Papers is to disseminate the results of research conducted by CIRANO research members in order
to solicit exchanges and comments. These reports are written in the style of scientific publications. The ideas and opinions
expressed in these documents are solely those of the authors.
Les cahiers de la série scientifique visent à rendre accessibles les résultats des recherches effectuées par des chercheurs
membres du CIRANO afin de susciter échanges et commentaires. Ces cahiers sont rédigés dans le style des publications
scientifiques et n’engagent que leurs auteurs.

CIRANO is a private non-profit organization incorporated under the Quebec Companies Act. Its infrastructure and research
activities are funded through fees paid by member organizations, an infrastructure grant from the government of Quebec, and
grants and research mandates obtained by its research teams.
Le CIRANO est un organisme sans but lucratif constitué en vertu de la Loi des compagnies du Québec. Le financement de son
infrastructure et de ses activités de recherche provient des cotisations de ses organisations-membres, d’une subvention
d’infrastructure du gouvernement du Québec, de même que des subventions et mandats obtenus par ses équipes de recherche.

CIRANO Partners – Les partenaires du CIRANO
Corporate Partners – Partenaires corporatifs
Autorité des marchés financiers
Bank of Canada
Bell Canada
BMO Financial Group
Business Development Bank of Canada
Caisse de dépôt et placement du Québec
Desjardins Group
Énergir
Hydro-Québec
Innovation, Science and Economic Development Canada
Intact Financial Corporation
Manulife Canada
Ministère de l'Économie, de la Science et de l'Innovation
Ministère des finances du Québec
National Bank of Canada
Power Corporation of Canada
PSP Investments
Rio Tinto
Ville de Montréal
Academic Partners – Partenaires universitaires
Concordia University
École de technologie supérieure
École nationale d’administration publique
HEC Montréal
McGill University
National Institute for Scientific Research
Polytechnique Montréal
Université de Montréal
Université de Sherbrooke
Université du Québec
Université du Québec à Montréal
Université Laval
CIRANO collaborates with many centers and university research chairs; list available on its website. Le CIRANO collabore avec
de nombreux centres et chaires de recherche universitaires dont on peut consulter la liste sur son site web.

© April 2021. David Bounie, Youssouf Camara, John W. Galbraith. All rights reserved. Tous droits réservés. Short sections may
be quoted without explicit permission, if full credit, including © notice, is given to the source. Reproduction partielle permise
avec citation du document source, incluant la notice ©.

The observations and viewpoints expressed in this publication are the sole responsibility of the authors; they do not necessarily
represent the positions of CIRANO or its partners. Les idées et les opinions émises dans cette publication sont sous l’unique
responsabilité des auteurs et ne représentent pas nécessairement les positions du CIRANO ou de ses partenaires.

                                             ISSN 2292-0838 (online version)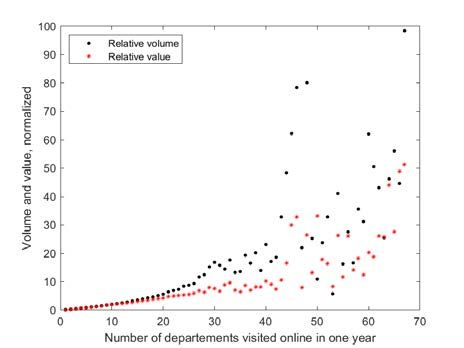
Consumer Mobility, Online and On-site Commerce and the
        Geographic Concentration of Economic Activity:
            Evidence from 20 Billion Transactions *
                  David Bounie †, Youssouf Camara ‡, John W. Galbraith §

                                                    Abstract
The geographical pattern of consumers’ expenditures, whether made on-site or online, has implications
for the location of economic activity and regional economic development. Data limitations have however
limited our knowledge of this aspect of consumer behaviour. This paper uses transaction data to
investigate such geographical patterns, and the impact of online commerce on these and on inter-regional
retail trade linkages between cities and regions. We build original mobility and inter-regional retail trade
measures from nearly 20 billion domestic consumer transactions made through bank cards, in France
2018-19. We find evidence that online consumer expenditure are more heavily concentrated in the
already-large regional economies, relative to on-site expenditure, which suggests that the increasing
movement toward online purchasing tend to increase the concentration of overall economic activity, and
may have important implications for regional economic development.

Keywords: Consumption Expenditure, Consumer Mobility, Inter-Regional Trade, Ecommerce

                                                    Résumé
La répartition géographique des dépenses des consommateurs, qu'elles soient effectuées dans les
commerces physiques ou en ligne, a des répercussions sur la localisation de l'activité économique et le
développement économique régional. Le manque de données a toutefois limité notre connaissance de la
répartition géographique des dépenses des consommateurs. Cet article utilise des données de transaction
par carte bancaire pour étudier l'impact du commerce en ligne sur les comportements de dépense des
consommateurs et sur les liens commerciaux entre les villes et les régions. Nous construisons des mesures
originales de mobilité des consommateurs et de liens commerciaux entre villes et régions en utilisant près
de 20 milliards de transactions par cartes bancaires en France sur la période 2018-19. Nous montrons que
les dépenses de consommation en ligne par rapport à celles réalisées dans les commerces physiques sont
plus fortement concentrées dans les économies régionales de taille importante, ce qui suggère que la
croissance du commerce électronique tend à augmenter la concentration de l'activité économique globale,
et peut avoir des implications importantes pour le développement économique régional.

Mots-clés : Dépenses de consommation, Mobilité des consommateurs, Commerce interrégional,
Commerce électronique

*
   This research has been made possible by the collaboration of Groupement des Cartes Bancaires CB, and was
conducted within the Research Chair “Digital Finance” under the aegis of the Risk Foundation, a joint initiative by
Groupement des Cartes Bancaires CB, Telecom Paris and University of Paris 2 Panthéon-Assas. We would like to
thank Philippe Durand, Ludovic Francesconi, Katérina Levallois, Ngo van Long, Loys Moulin, and Samuel Willy
for their helpful comments on earlier versions of the paper.
†
  i3, CNRS, Telecom Paris, Institut Polytechnique de Paris; Email: david.bounie@telecom-paris.fr.
‡
  i3, CNRS, Telecom Paris, Institut Polytechnique de Paris; Email: yocamara@telecom-paris.fr.
§
  Department of Economics, McGill University; CIREQ, CIRANO; Email: john.galbraith@mcgill.ca.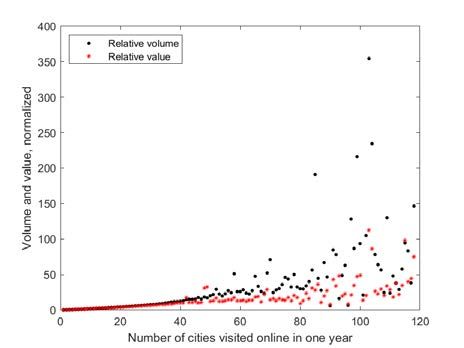
1    Introduction
The study of commercial relations among countries or regions has been a classic and rich
research theme in international economics since the pioneering work of Tinbergen (1962)
and Linneman (1966). These studies use gravity-type equations and data on shipments of
goods by establishments to investigate the determinants of international and regional trade
patterns. The results of these and many subsequent studies show that distance, despite
technological progress in transportation and communications, continues to be an important
explanatory factor in inter-regional and international trade.

    Producers, wholesalers and retailers are nonetheless not the only economic agents play-
ing a role in external goods purchases. Consumers also move outside their home regions,
often making purchases in neighbouring regions as they do so, not only of goods but also
of services; these activities are not well captured by traditional measures based on deliv-
eries of goods among businesses. Since household consumption represents a significant
part of national income, typically more than 50%, understanding these final-consumption
purchases is a potentially important element in our understanding of interregional trade.

    What, then, is known about the mobility of consumers and the commercial relations
that they undertake in other cities, regions or countries? Economists have in fact little
knowledge of consumer mobility, as traditional macroeconomic data sources do not con-
tain precise, localized data on individual consumption expenditures. It is therefore difficult
to study how consumer mobility affects local economies and the commercial relations be-
tween cities and regions within a country.

    Understanding consumer mobility and its effects on regional or national economies is
important for a number of specific reasons. Currently, for example, the global pandemic
and induced restrictions on the movements of consumers have affected individuals’ ex-
penditures outside the home region. Towns or regions which depend relatively heavily on
expenditures of visitors from outside have been relatively heavily affected (Bounie et al.,
2020); deeper knowledge of the consumption changes brought about by reduced mobility
may permit better design of policy for regional economic development. Secondly, the im-
portance of purchases undertaken when consumers move outside the home region varies
substantially across sectors, and there is evidence that in economic sectors where travel
frictions matter relatively more, employment tends to be more highly concentrated, and

                                              1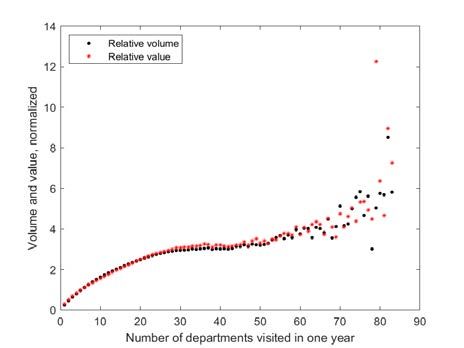
establishments more dense (Agarwal et al., 2019a). Thirdly, online purchases have become
an increasingly important factor in aggregate consumption. The convenience of online
commerce has clearly led consumers to prefer this mode of purchase for many goods, trav-
elling less frequently to physical stores (Gentzkow, 2007; Pozzi, 2013). But geographical
location still continues to play a key role in online commerce for a large number of physical
goods because they need to be locally delivered by retailers, or because (particularly in the
case of cross-border commerce) there may be information frictions (see for instance Rauch,
1999; Huang, 2007; Head and Mayer, 2014; Allen, 2014; Chaney, 2018). The change in
consumer mobility due to the development of online commerce has nonetheless modified
the geography of economic activities, and thus the economic relations between regions.

    The objective of this article is to improve our understanding of these effects by measur-
ing the movements of individual consumers, building consumer mobility and expenditure
indicators to estimate trade relationships among cities and regions, and estimating the im-
pact of online commerce on consumer mobility and these inter-regional trade relationships.

    To do so, we use one of the richest data set that has been made available to researchers,
consisting of the set of card payments made on approximately 70 million bank cards in
France, over the two-year period 2018-19, totaling nearly 20 billion transactions. The de-
tailed information on timing and location of the transaction, the nature of the merchant, and
the type of purchase, i.e. online or off-line,1 allows us to contrast the patterns of consump-
tion observable in each of these two classes of consumer payment. Individual cardholders’
movements are tracked via the distances between distinct geographical purchasing loca-
tions, and we are able to impute a home location for each individual. With this information
we are able to estimate the number of distinct geographical locations visited, as well as
the number and value of the cardholder’s home (city or département) or away-from-home
transactions.2 The measures are then used to construct inter-city or inter-département retail
trade volume and value. The measures of mobility or trade relations between geographical
areas can be applied to off-line or online trade, since all retailers’ geographical locations
can be identified, and online and off-line purchases are indicated separately in the trans-
action data. Although the consumer does not physically move in the course of an online
transaction, goods may be delivered, or ordered online and consumed on site (e.g., hotel
   1 By‘off-line’ we will mean on-site or ‘point-of-sale’ transactions.
   2 Excluding overseas territories,
                                   France is divided into 95 administrative regions known as ‘départements’,
which will be important units of analysis in the present study.

                                                     2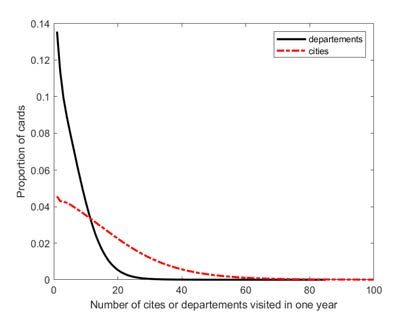
stays); the product identification codes embodied in the data allow us to distinguish some
such types of purchase. Finally, with these measures of inter-regional retail trade, we are
able to estimate online and off-line gravity models.

   A number of specific results emerge from the analysis of these billions of payment
card transactions. (1) Perhaps surprisingly, we find that a card ‘travels’ out of the home
region on average less online than off-line; in each case there is a high degree of disper-
sion of the degree of mobility across individuals. Online transactions are also on average
more concentrated on a smaller number of cities and merchants. (2) The distance between
départements is a strongly negative predictor of off-line volume and value of trade, but
disaggregation by sector reveals that the distance has no significant effect in sectors where
goods are delivered to consumers, such as appliances. As well (3), the size of the ‘ex-
porting’ département’s economy has a much larger effect with online than with traditional
in-store sales. This result suggests that the increasing movement toward online purchasing
may tend to increase the concentration of economic activity: that is, consumer expendi-
ture moves further toward the already-large regional economies as online sales come to
represent a larger fraction of total expenditure. Finally (4), at the level of cities, proxim-
ity between cities is a much smaller factor in explaining online trading relationships than
among départements or regions: the estimated parameter on the size of the economy from
which the purchase is made is still positive but three times lower than that observed in the
inter-département analysis.

   Our results contribute to the economic literature on three dimensions. First of all,
economists have had very little information about the movements of individual consumers
throughout a country, and the distribution of the degree of mobility across the population.
This paper is one of the very first to measure consumer mobility, and the resulting shifting
of inter-regional economic activity through online commerce, in a large and representative
national data set with broad coverage of consumers, firms, and types of transaction.

   Secondly, recent work by Agarwal et al. (2019a) studies consumer mobility across pur-
chasing locations, to investigate the local structure of consumption industries. Using credit
card transaction data, they find that consumer mobility varies substantially across sectors,
and that where travel frictions are expected to matter relatively more, employment tends to
be more highly concentrated, and establishments more dense. However, this study does
not make a distinction between off-line and online commerce which, as we will show

                                              3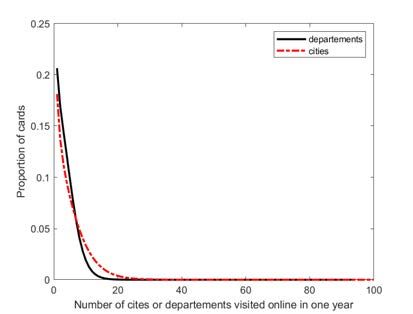
here, have different implications for consumer mobility across purchasing locations and
for the resulting concentration of economic activity. Generalizing the approach developed
by Agarwal et al. (2019a), we therefore investigate not only consumer mobility across lo-
cations, but also how consumer mobility and the online vs. off-line distinction can affect
trade relationships between cities and regions.

   Thirdly, a large literature analyzes the ways in which geographic frictions reduce inter-
regional trade in (durable) goods between establishments or consumers. McCallum (1995),
Wolf (2000), Anderson and van Wincoop (2003), and Hillberry and Hummels (2008) for
example have tested the impact of distance and national boundaries on interstate commerce
in the United States and Canada, using aggregate and regional statistics on shipments be-
tween establishments. While the very large border effects found in McCallum’s early study
have tended to be scaled back in subsequent work, evidence that national borders matter ap-
pears to be robust. Using a sample of within-US eBay online transactions, Hortaçsu et al.
(2009) show also that the coefficient on distance is much smaller on eBay than for total
trade flows. The study is however limited to the analysis of transactions between individu-
als, and to online auctions related to products that are mainly durables. Lendle et al. (2016)
extend the previous work and also use a sample of cross-border eBay transactions but ex-
clude all transactions that were concluded via auctions as well as those sold by consumers,
so that the eBay data resemble off-line trade practices. The present article departs from this
literature by proposing new and original inter-city and inter-regional retail trade measures
from a massive and detailed set of consumer online and off-line transactions that capture
the entire basket of goods, and also services, traded online and on-site between consumers
and retailers. Conversely to the aforementioned studies, we find that the distance has no
significant effect in sectors where goods are purchased online and delivered to consumers.

   The remainder of the paper is structured in four sections. Section 2 describes the data,
and the French payment card market, in detail. Section 3 describes geographical patterns
at the level of the individual, including the nature of consumers’ movements and purchases
outside the home region. Section 4 uses aggregated data to examine trade links between
regions of France, primarily using gravity models of inter-regional retail trade. The pat-
terns observable in online and on-site expenditures are compared and contrasted. Section 5
summarizes our conclusions and discusses further research directions to be pursued using
data of this type.

                                              4
2 Bank card data
2.1 An overview of bank card transactions data
Transactions data from bank cards have been used for a number of purposes in the exist-
ing literature, exploiting several key characteristics not present in official statistical agency
data: in particular, the fact that they are available at a higher frequency or granularity (at
least a daily aggregate, and often at the level of individual transactions), and more rapidly
(possibly the next business day following a transaction, as opposed to weeks or as much
as two months for official data). Such data have for example facilitated the study of finan-
cial innovation and consumer choice of payment method (Agarwal et al., 2019a,b; Lendle
et al., 2016; Bounie and Camara, 2019; Wang and Wolman, 2016), the response of con-
sumption to income shocks or other exogenous events (Agarwal and Qian, 2014; Galbraith
and Tkacz, 2013)), and near-real-time economic monitoring (Galbraith and Tkacz, 2018;
Carlsen and Storgaard, 2010).
Transactions data are typically recorded with a very high degree of accuracy3 as well as
detail. With respect to real-time monitoring of the economy, they suffer from the disadvan-
tage of omitting some elements of national income; there is little coverage of investment,
government expenditure, or exports. However, from the point of view of the study of con-
sumption and consumer behaviour, this difficulty is largely absent, except to the extent that
cash transactions may differ in character from card payments.
The latter is the focus of the present study, and for this purpose the bank card data used
here are very well adapted. This data set is exceptional in the literature in a number of
ways: it offers very wide coverage of consumers throughout France, leading to the sample
of observed transactions of about 20 billion, substantially larger than the sample size in
almost any comparable study (a rare exception being Dolfen et al. (2019)). In the next
subsections we describe the features of these data.
2.2 The Cartes Bancaires CB data and French payment card market
France is a country with a mature bank card (carte bancaire) market. Cartes Bancaires CB
is the leading domestic scheme, created by the French banks in 1984, which by 2019 had
3 Galbraith
and Tkacz (2018) compared interbank payments sent and received by major banks in approxi-
mately 75 million transactions over more than 10 years of data aggregated to the daily frequency, and found
no discrepancies.
5more than 100 members (Payment Service Providers, banks and e-money institutions).
As of 2018 there were 70.4 million CB cards in use in the CB system, and 1.77 million
CB affiliated merchants (CB, 2018). CB cards can be immediate-debit cards, but also
deferred-debit cards (‘charge cards’ that require the balance to be paid in full each month),
or credit cards (cards with a credit line). A peculiarity of the French card market is that
merchants who accept CB cards will make no distinction between debit cards and the other
types.
Our sample comprises 9.2 and 10.7 billion transactions on CB cards in 2018 and 2019
respectively, for a total value of about e 376 and e 427 billion, i.e. 340 transactions, or
e 13,530, per second in 2019. In the rest of this paper, we focus on this representative
set of transactions. We observe each of these transactions very precisely. A transaction is
characterized by its value, the date of the transaction (we have two dates; actual transaction
date and settlement date), the time of day recorded to the second, the type of payment
card (debit / credit / prepaid), the geographical location of the merchant, the statistical
classification of the type of purchase, and the type of purchasing channel used during the
transaction, i.e. off-line or online. Note that the geographical location of online merchants
is self-reported, and may be the location of a head office or major warehouse.
A summary of descriptive statistics is provided in Table 1.
Table 1: Summary of descriptive statistics
Notes: This table reports the summary of descriptive statistics of card transaction values in 2018 and 2019.
Q1, Median and Q3 represent the first, second and third quartiles of transaction values (in euro).
This data set is exceptional in its coverage, allowing us to capture a significant propor-
6tion of consumer expenditure in France. To appreciate the richness of the data set, consider
a few comparisons with national statistics provided by the National Institute of Statistics
and Economic Studies (INSEE). GDP in France in 20184 was estimated as e 2,350 billion,
with e 1,221 billion (52 percent of GDP) representing household consumption expenditure.
Excluding fixed charges (rents, financial services, insurances) from household consumption
expenditure, as these are typically paid by direct debits and credit transfers, the remaining
part of consumer expenditure amounts to e 802 billion (34 percent of GDP). Comparing
these figures with total CB card payments (e 376 billion), the value of CB card payments
represents 16 percent of the French GDP, 31 percent of the total household consumption
expenditure, and finally 47 percent of total household consumption expenditure excluding
fixed charges.
In comparison with previous studies such as that of Agarwal et al. (2019a), our data set
reflects to a greater degree the current use of the internet for consumers’ transactions. As
illustrated in Table 1, the share of online consumer spending in 2019 amounted to 14.2%
by volume (number of transactions) and 21.7% by value, an increase of about 0.8 (volume)
and 1.2 (value) percentage points with respect to 2018. These figures are in line with recent
US studies that estimate the online share of overall retail sales at 10% (Dolfen et al., 2019).
The proportion of cards that make at least one online transaction during the calendar year
is 66% in 2018 data, and 67% in 2019, while 17% of merchants report making online sales
in each of these years. Given the rapid increase in online activities, we compare off-line
and online transactions throughout the present study.
A visual comparison of the aggregate values of these activities is given in Figure 1,
which displays the distribution by city of aggregate online and off-line transaction values,
as proportions of total transaction value. We observe that online transaction values are
much more concentrated in certain départements, especially around Paris, compared with
off-line transaction values which are widely dispersed. We will return to this point below.
4 We use 2018 national statistics because 2019 statistics are not yet available.
7(a) Off-line (b) Online
Figure 1: Spatial distribution of aggregate off-line and online transaction values, as shares
of total transacted value, by city
3 Consumer mobility and external transactions
We now examine consumer mobility, which underlies much inter-regional retail purchas-
ing, and both on-site and online expenditure outside the home city or département. We
begin by measuring the distance in kilometres that each card travels between cities in
the course of on-site transactions. We then study consumer mobility across cities and
départements via the locations of on-site transactions, characterize the relationship between
consumer spending and measures of mobility, and analyze home-département and external
(’away’) expenditure patterns, online and offline.
3.1 Consumer mobility across cities and départements
A simple way to estimate consumer mobility is to calculate, for each card, the total distance
traveled between payments made at locations in different administrative divisions such as
cities and départements. This measure requires more information than that documented by
Agarwal et al. (2019a); in particular, we need precise information on merchants’ locations.
Fortunately, each transaction in our data contains a merchant identification number, a code
which gives the precise postal address of the merchant including the postal code, which we
use at the five-digit level.
For each card, we measure the geographical distance between two on-site payments
8carried out in different cities, using the Haversine distance formula.5 Let i index transac-
tions on card j, and let ci be the location of the centroid of the city where transaction i took
place, so that we can define d(ci , ci+1 ) as the Haversine distance between the city centres
for two consecutive transactions; if these take place in the same city then d(ci , ci+1 ) = 0. To
compute this distance, we use the longitude and latitude coordinates.6 Finally the annual
inter-city distance travelled by card j is measured as:
nj
t j = ∑ d(ci , ci+1 ), (1)
i=1
where there are n j on-site transactions within the observation period on card j. This method
of calculation is conservative, since cards can be used for example in different places within
the 5-digit postal code, but should provide a reasonably fine approximate measure of inter-
regional consumer movement.7 Note that for this purpose we treat off-line (on-site) pur-
chases only: in online transactions, the distances between merchant locations in successive
transactions do not have an interpretation as consumer movements, nor as movements of
goods. Nonetheless, we are able to measure the numbers of cities or départements in which
off-line transactions occur, and measure transactions external to the home département.
Figures 2a and 2b display different views of the distribution of this measure of the
distances traveled by 20.3 million cards, within Metropolitan France in 2019.8 Results on
the 2018 data are very similar, and throughout this section we present only 2019 results for
brevity. The horizontal axes indicate the interval of distances travelled, e.g. cards travelling
between 90 and 100 km, while the vertical axis in each figure indicates the proportion of
the cards in the given interval. In Figure 2a observations are aggregated into intervals
of 10 km, although exact zeroes are shown separately; over 1 million cards show zero
distance travelled. Total annual distances in the 10-30 km range are the most common,
apart from zero. Figure 2b plots intervals of 1000 km, and we see a regular pattern of
decay through the interval up to approximately 100,000 km travelled. Approximately 26%
of cards travelled less than one thousand kilometres, but over 19% traveled a distance
5 Note that this method computes shortest distances between points on a sphere, as opposed to using road
or rail network information.
6 The data can be retrieved at the following address.
7 Payment cards in the French CB system are unique to the individual; multiple cards with the same
number (e.g. for parent and child) are not issued, although this may be possible in some other jurisdictions.
8 We exclude overseas territories, and take a sample of valid cards over the period. In order to make cards
comparable, we randomly select and focus on cards valid throughout the year 2019.
9greater than 10,000 km.9 On average, a card travels about 6,000 kilometres per year across
the country between off-line (on-site) transactions; approximately 4.1 percent of cards are
used (off-line) purely within a single postal code, and therefore show zero kilometres of
distance travelled. Finally, a small number of cards cover extraordinary distances; over
5000 cards show measure distances exceeding 100,000 km (that is, beyond the range of
Figure 2b), with the largest value in the sample exceeding 600,000 km.
(a) Intervals of 10km, up to 500km (b) Intervals of 1000km, up to 100,000km
Figure 2: Distances travelled by cards between on-site transactions, 2019
Figures 3a and 3b describe a different indicator of mobility, the number of cities and
towns or départements in which each card is used. This measure can be computed for
online transactions as well as off-line, and in both are recorded in this pair of figures,
which plot the proportion of cards corresponding with each specific number of cities or
départements ‘visited’ (i.e. locations at which a transaction is recorded), truncated at 100.
Each of the proportionate values for 1 through 7 cities visited corresponds with over 1
million cards that were used in that number of cities, and there is a regular pattern of decay
thereafter. Interestingly, in Figure 3b, we see that online shopping is more concentrated
than off-line shopping: 18% of online payment cards visit a single city compared to 4%
for off-line cards. The maxima are 321 cities visited for off-line transactions, and 343 for
online transactions.
9 Note again that this measure applies to cards, and not cardholders; we do not have information about
consumers such as their postal addresses that would allow us to identify individuals. Since some individuals
use more than one card, the measure is also conservative in that travel by an individual will in some cases be
the sum of distances on two or more cards.
10(a) Off-line (b) Online
Figure 3: Card mobility by number of cities or départements in 2019, up to 100
Next, Figures 4a through 4d relate the volume and value of activity to the number of
cities or départements visited by each card. Each line shows value or volume of transactions
per card scaled by the average for the values corresponding with 1 to 10 cities visited.
Overall, we find that mobility is associated with greater consumer spending. Regardless of
whether we consider value or volume, city or department, we see clear differences between
off-line and online cases: online transactions tend to be distributed among a smaller number
of locations (concentrated toward smaller values on the lower axis) and show a particularly
high degree of dispersion for the cards showing highest total transaction values (the vertical
axes reach much higher values). We will see further evidence below of this tendency toward
concentration in online purchases.
11(a) Inter-city off-line mobility (b) Inter-département off-line mobility
(c) Inter-city online mobility (d) Inter-département online mobility
Figure 4: Transaction value and volume vs inter-city or inter-département mobility
3.2 ‘Home’ and ‘away’ expenditures
In the previous subsection we looked at measures characterizing movements of cardholders
throughout the country, without reference to a home base. In this subsection we consider
expenditures in or outside the cardholder’s home location, a feature which is readily in-
terpretable for both off-line and online transactions. Our method of imputation relies on
observed consumer behaviour rather than on a declared address, and can be applied in any
data set in which geographic locations of individuals’ transactions are observed.
We begin by defining a card’s home city or département h, as the location in which the
largest number of transactions takes place; we then compute the proportions of both trans-
action volume and value of expenditure taking place in the home location, and externally
(’away’), for each card. Again, let i index transactions on card j, let k index the geographi-
12cal unit, and let vi, j be the value of transaction i on card j, or the value 1 if we are counting
number of transactions. We then compute the proportion of home transactions (value or
volume) for card j, q j,home = ∑i:k=home vi, j / ∑i vi, j , and the corresponding proportion of
external transactions (value or volume) for card j, q j,ext = ∑i:k =home vi, j / ∑i vi, j .
Figures 5a and 5b plot these proportions at intervals of 0.1 for off-line and online trans-
action values.10 We observe that at the level of the département, the modal value is zero for
the value of off-line transactions; that is, within this set of intervals, more cards are used ex-
clusively within a département than in any interval. At the level of cities and towns, where
of course the home unit is smaller and so would be expected to account for a smaller pro-
portion of transactions, the most commonly occurring outcomes are in the range of 60-70%
of transactions (and value) occurring outside the home city. Regarding online transactions,
the patterns (similar at the levels of city or département) show a different picture: the pro-
portions of transaction values outside the home city or département are significantly higher,
and a significant proportion of cards (30%) carry out all transactions outside the home city
or département.
(a) Off-line (b) Online
Figure 5: Value of off-line and online expenditures outside home region in 2019
The distinction between home and away expenditure patterns is also visible in the num-
ber of off-line and online retailers visited per card. Figures 6a and 6b present the cumula-
tive distributions of the number of off-line and online retailers from which any purchases
were made, truncated at 300. We observe that the number of online retailers patronized
is substantially lower than for off-line retailers. Online transactions are on average more
concentrated on a smaller number of merchants.
10 The volume of expenditures outside the home region shows a very similar pattern to the value, and is
therefore not recorded.
13(a) Number of off-line retailers (b) Number of online retailers
Figure 6: CDF of number of retailers from which purchases were made in 2019, up to 300
Finally, for each card we can compute the sum of the distances between retailer location
and home location, across all purchases, either online or off-line.11 Figure 7 plots the pro-
portion of cards corresponding with each distance, for both online and off-line commerce,
up to distances of 1000 km. A large proportion of cards show an exact zero distance, and
these observations are excluded here in order to retain a scale which allows comparison of
online and off-line patterns.12 While total distances in off-line purchases show approxi-
mately monotonic decline from an early peak, online purchases show clear multimodality.
A possible explanation for this lies in the concentration of online retail locations near Paris
(and a few other large centres), such that the peaks represent population concentrations
at particular distances from that city. This multimodality may therefore be suggestive of
concentration of online purchases with retailers in particular locations, a phenomenon of
which we will see further evidence in the next section. We also see that purchases from
retailers further from ‘home’ are relatively more important in online commerce.
11 Again, an online or off-line merchant has an identification code linked to its geographical location.
The merchant’s location may simply correspond to the head office where the administrative activities of
the company are hosted. However, the code can also be linked to the geographical location of the delivery
warehouses of a company, for example, that delivers physical goods. In this case, the distance measures not
the mobility of the consumer but the transport of goods.
12 The proportions of cards that ’travel’ 0 km are 4% and 18% for off-line and online, respectively. Overall,
we find that a card ‘travels’ out of the home region on average less online than off-line.
14Figure 7: Proportion of cards showing a given cumulative distance between retailer location
and home, off-line and online; exact 0 excluded.
4 Retail trade links between départements and gravity ef-
fects
In the previous sections we examined the behaviour of individual consumers, and defined
‘home’ and ‘away’ cardholder expenditure. We now turn to the use of these measured char-
acteristics of cardholder purchases to characterize linkages at the aggregate level, between
départements, measured via both off-line and online purchases.
The standard model of inter-regional trade linkages is the gravity model, so called by
analogy to the physical phenomenon of gravitation, which is stronger for more massive
bodies and weaker at greater distances. Theoretical bases for gravity equations have been
provided by a number authors using different assumptions, including Bergstrand (1985),
Bergstrand (1989), Eaton and Kortum (2002), Anderson and van Wincoop (2003) and
Chaney (2008); see Brueckner et al. (2020) for a clear overview of the evolution of this
literature. In the context of trade, the concept analogous to mass is a measure of the size
of the national or regional economy, such as GDP. The gravity equation traditionally used
to predict trade flows across countries has proven to be an exceptionally stable and ro-
bust empirical regularity. While the trend toward increasing global trade and technological
progress have led to considerable reductions in transport costs and other trade barriers, the
essential elements identified in gravity equations remain key predictors of the strength of
trade linkages.
15Here we apply models of this type to the study of inter-city and inter-département eco-
nomic linkages, measured both by standard import-export trade flows, and also by a mea-
sure of common purchases by individual consumers. Although there have been studies of
inter-regional trade using gravity models at a sub-national level, these studies have mainly
focused on shipments at the level of establishments, and also suffered from the relatively
poor quality of regional income estimates. The exceptionally rich and accurately measured
data set used here obviates this concern.
A common practical problem in the estimation of trade models involving countries is
that distance will typically be correlated with unmeasured differences of language, culture,
legal structure and so on which may project onto the distance measure, thereby exaggerat-
ing its true effect. Here, of course, all units are parts of France. While there have been other
studies of sub-national data which share this feature,13 the present study has the advantage
of the relatively large sample of regional units; from the set of 95 départements we have
a sample of 8930 (95 × 94) pairings with which to estimate effects. Relatedly, because
the data are at a sub-national level, only a subset of the units have a border with a foreign
country. This allows us to estimate the effect of a border with another country on trade
within the home country. Note that this contrasts with the type of border effect estimated
in McCallum (1995), who used within-country and across-country state/province links to
estimate the effect of the US-Canada border on regional trade.
Finally, and perhaps of particular importance, we are able to contrast the inter-regional
economic links in online and on-site purchases. While we find that the traditional gravity
relationships are observable in online purchase data as well as for in-store purchases, there
are important differences between online and on-site trade.
4.1 Two measures of inter-département linkage
In order to estimate models of the strength of economic links between départements as a
function of distance, size and other indicators, we define two measures of linkage between
two départements.
The first is a traditional trade-related measure, in which we use the ‘home’ département
defined in the previous section and obtain the expenditures (imports) made in each of the
13 For example, the important study of McCallum (1995) uses data from Canadian provinces and U.S.
states.
16départements other than the home. Imports into the home département h from another
département k are identical to the exports from k to h : there is no discrepancy such as
is observed in international trade data. Formally, let h = {1, 2, . . . 95} index the home
département, and let k 6= h index the départements with which a given home département
is linked. For each card ` with home département equal to h, let V`,h,k represent total pur-
chases (value, volume) made in département k; then the import-based linkage measure is
defined for each pair h, k as:
LI:h,k = ∑ V`,h,k , (2)
`:home=h
where ` indexes all cards: that is, the total of purchases in département k made on cards for
which the home is h.
The second measure, which we call a ‘commonality’ linkage, is a symmetric measure
which indicates the degree to which individual cards tend to show purchases in each of a
pair of départements. For the commonality measure, we do not define a home département.
Let V`,r represent total value or volume of purchases on card ` in département r. Then for
any two départements r, s, the commonality measure is defined as:
1
LC:r,s = ∑[V`,r ·V`,s ] 2 . (3)
`
Note that, for a given value or volume of purchases dispersed across two départements, this
measure will be greater as the expenditures are more evenly divided. If a card does not
show positive expenditure in both départements, the value for that card is zero and there is
no contribution to the commonality measure.
4.2 Predictors of inter-département linkage
We now examine predictors of inter-département linkage using each of the two measures
LI and LC , paying particular attention to the core gravity effects of distance and size, and
to the comparison between online and on-site purchases. Each of the measures can be
computed either for the value or volume of total purchases; as well, we will examine various
specifications of the gravity equation. In order to reduce the proliferation of tables we will
focus on a single base-case specification of the model in the tables presented in the main
text, and present tables of additional results in Appendix A.
The core regression specification takes as the dependent variable one of the measures of
economic linkage – trade (imports) or commonality of purchases – together with a choice
17of value or volume of purchases. We will represent any of the four forms of this dependent
variable generically as Li, j for the linkage between départements i and j. This quantity is
modelled as a function of the distance di, j between départements i and j, measures of the
‘economic size’ of each of the two départements, Si , S j , and a vector of other potential
conditioning variables Z, many of which will be indicators.
We can therefore write the model as:
log(Li, j ) = β0 + β1 · log(di, j ) + β2 · log(Si ) + β3 · log(S j ) + δ Zi, j + ui, j . (4)
Note that the conditioning variables Z may be specific to the pairing (i, j), such as
an indicator that the two départements are neighbours or otherwise lie in the same region
of the country, or may instead be specific to one of the two, such as an indicator that
département i has a border with a foreign country, or borders the sea. Size of the economy
of a département is measured using the total value (or volume) of card transactions. This
may be viewed as a proxy for GDP, since GDP data are not available in France at the
level of each département, but in any event our measures have the virtue of being based
upon billions of observed card transactions, measured on a common basis throughout the
country. Price level measures are also unavailable at the département level. Although we
may expect price levels to be very similar across départements, a method of allowing for
differences is to use fixed effects at the département level, one strategy used by Combes
et al. (2005) in their study of networks, migration and inter-regional trade within France.
We include specifications with fixed effects among the set of alternative specifications in
Appendix A.
Our primary interest is in the parameters β pertaining to distance and economic size
variables, and in contrasting their values between online and off-line cases. Nonetheless we
will consider a variety of alternative specifications, both as robustness checks and because
a number of the parameters δ will be of independent interest.
4.3 Main results
We will first present results of a base-case model specification, along the 2 × 2 × 2 dimen-
sions described above: trade-based (import) and commonality measures of linkage; value
and volume of purchases; off-line and online activity.14 Tables 2 and 3 present the eight
14 The results presented in this section are based on 2019 data. Results on 2018 data are similar, and for
brevity are generally omitted. However, the analogues of Tables 2 and 3 for 2018 data are presented in the
18base-case regressions containing the results. A comparison of these two tables shows that
the results are qualitatively the same whether we use a value or volume measure of transac-
tions. In the discussion of this section we will therefore refer primarily to the value-based
results of Table 2 which correspond most directly with the value of consumption which
enters the national income identity as a component of GDP.
Table 2: Base-case models of LI and LC , off-line and online, based on transaction values
Notes: This table reports estimation results for the base-case models. The
dependent variable is the logarithm of the trade link measure, import-based
(LI , columns 1-2) or commonality (LC , columns 3-4), using off-line and
online transaction values; regressors include the log distance, neighbours
dummy variable, same region dummy variable and log GDP of départements
i and j. Robust standard errors clustered at the distance level are reported in
parentheses. ***, **, * indicate significance at the 1%, 5% and 10% levels,
respectively.
Appendix.
19Table 3: Base-case models of LI and LC , off-line and online, based on transaction volumes
Notes: This table reports estimation results for the base-case models. The depen-
dent variable is the logarithm of the trade link measure, import-based (LI , columns
1-2) or commonality (LC , columns 3-4), using off-line and online transaction vol-
umes; regressors include the log distance, neighbours dummy variable, same re-
gion dummy variable and log GDP of départements i and j. Robust standard errors
clustered at the distance level are reported in parentheses. ***, **, * indicate sig-
nificance at the 1%, 5% and 10% levels, respectively.
Column 1 of the tables provides the case that is comparable with the previous litera-
ture, that is of a trade-based measure for traditional on-site purchases.15 Distance between
départements is a strongly negative predictor of the volume of trade, and even conditional
on distance, being neighbours or from the same region has a substantial positive estimated
effect. The coefficients on sizes of the regional economies are close to the theoretical values
of unity in the model of Anderson and van Wincoop (2003), and indeed are closer to unity
than in many existing empirical results, although nonetheless very precisely estimated and
statistically significantly different from 1. Each of these results is consistent with findings
in the previous literature.
Results based on the commonality measure, column 3, are qualitatively similar. Since
the measure is identical for each member of a pair, the labels (i, j) are interchangeable and
15 Again, our linkage measure uses imports; because the imports of i from j are identical to the exports of j
to i, we can also interpret this as an export-based measure by reversing the labels on the size or GDP variable.
20coefficients on the sizes of economies are identical as well.
The critical comparison for our present purposes is between columns 1 and 2, in which
we are able to contrast online with off-line economic activity. We observe not surprisingly
that distance (as well as being neighbours or from the same region) is a less strong pre-
dictor of trade; to the online purchaser, the region from which a purchase is made may
be nearly irrelevant, or even entirely unknown. Nonetheless, the geographical proximity
variables remain strongly significant and substantial predictors even of online economic
linkages; the sole exception is the indicator that two départements are neighbours, which is
not statistically different from zero for online purchases using the commonality measure.
The striking result however concerns the estimated parameter on the size of the econ-
omy from which the purchase is made, i.e. the exporting département: log(GDP of dep. j)).
This value, the estimated regional income- or regional economic size- elasticity of exports,
is approximately 60% larger for online than for off-line transactions (the coefficients are
respectively 1.03 and 1.63 when we consider the import-based measure with transaction
values). The value is approximately 50 standard errors from unity. Moreover, as we shall
see in the next subsection, this result is very robust to numerous different specifications
of the model. We see a reflection of the same phenomenon in the commonality measures,
where the importance of size of economy is again very much higher in online data (again,
the symmetry of the commonality measure implies that the coefficients on size of the econ-
omy for each of the two départements must be the same, and we see the effect distributed
across the two départements).
The result that the size of the ‘exporting’ département’s economy has a much larger
effect with online than with traditional in-store sales suggests that the increasing move-
ment toward online purchasing may tend to increase the concentration of economic activity
(that is, consumer expenditure moves further in the direction of the already-large regional
economies as online sales come to represent a larger fraction of total expenditure).
In the next section we explore the robustness of this result to different specifications of
the gravity equation, as well as examining the effects of additional indicator variables.
4.4 Sectoral disaggregation
In the results above we noted that the coefficient on distance is reduced for online pur-
chases, relative to off-line, but remains non-zero. In order to investigate this further, it is
21useful to distinguish purchases by type or sector. In particular we will consider the dis-
tinction between purchases which are made online for delivery to the consumer, and those
which may be booked and paid for online (such as hotels) but which must be consumed in
the same way regardless of whether the purchase is made online or on-site.
Tables 4 and 5 present such a disaggregation. The column headings correspond with
classifications from the French Nomenclature d’activités françaises.16 We note first of all
that, in the off-line disaggregation, the coefficient on distance is similar in each case to the
result in the aggregate: that is, negative and slightly less than one (with one exception) in
absolute value.
To compare with the online results, first consider polar cases of purchases which we
expect to be almost entirely, or conversely not at all, purchased online and delivered to the
consumer. In the former case we expect distance to have little effect online; the consumer
need not move. In the converse (purchase online, consumption on-site) case we expect
distance to have similar effect online and off-line, as the consumer must move in either
case. The case of appliances provides one polar example: we expect that almost all such
purchases will be delivered to the consumer. Correspondingly, we see a large contrast in
the off-line/online results; the distance coefficient for online purchases is close to zero. A
contrasting polar case is that of transport: whether paid for on site or online, the consumer
must undertake travel in the same way. We expect little difference in the coefficient on
distance, and indeed we see little.17
Lodging also shows similar off-line and online distance coefficients; whether booked
online or not, consumption must take place on site. Restaurant meals, as well, although
they may be delivered to the consumer’s home, tend to be constrained by the necessity of
immediacy to a similar geographical range regardless of whether the consumer goes to the
restaurant, or the restaurant comes to the consumer. The coefficients on distance are similar
for off-line and online in each of these cases. A third example is leisure, which corresponds
largely with cultural and sporting events. As with lodging, these can be booked and paid
16 This classification of economic activities, maintained by INSEE, is analogous to the North American
NAICS. The first two digits represent the division. The codes corresponding with the headings are: Ap-
pliances: 4754x; Food: 4721x, 4722x, 4723x, 4725x, 4729x; Clothing: 4771x, 4772x, 4782x; Health:
862xx, 4773x; Lodging: 551xx, 552xx; Leisure: 90xxx, 91xxx 93xxx; Personal care: 9602x, 9604x; Restau-
rants:561xx, 563xx; Supermarkets: 471xx; Transport: 49xxx, 51xxx; Automotive: 451xx, 453xx.
17 A small difference may be attributable to selection of consumer type by payment method; for example
older consumers may be less likely to book transportation online than to pay at the departure point.
22for online, but are consumed on site; distance therefore continues to play a role in online
purchases, and we see that the leisure and lodging categories behave similarly with respect
to both their off-line and online coefficients.
Other cases tend to embody a mix of products which may be delivered and others
which must be consumed on site. The health category comprises visits to professionals
such as dentists and physiotherapists, but also products which may be purchased online
and delivered, so that the category is a blend of products for which distance is important
and others for which delivery makes distance relatively unimportant. Correspondingly,
again, we see that the online coefficient lies between zero and the off-line coefficient. The
automotive category blends vehicle purchases, where distance presumably remains a factor,
and automotive equipment and parts, which will often be delivered to the consumer or
repair facility.
Table 4: Sectoral disaggregation of model with import-based measure LI , using off-line
transaction values
Notes: This table reports the estimation results for the sectoral disaggregation of the gravity model. For each sector
(columns 1-11), we regress the logarithm of the import-based trade link measure (LI ), using off-line transaction values,
on the variables used in Table 2. Robust standard errors clustered at the distance level are reported in parentheses. ***,
**, * indicate significance at the 1%, 5% and 10% levels, respectively.
23Table 5: Sectoral disaggregation of models with import-based measure LI , using online
transaction values
Notes: This table reports the estimation results for the sectoral disaggregation of the gravity model. For each sector
(columns 1-11), we regress the logarithm of the import-based trade link measure (LI ), using online transaction values,
on the variables used in Table 2. Robust standard errors clustered at the distance level are reported in parentheses. ***,
**, * indicate significance at the 1%, 5% and 10% levels, respectively.
Globally these results reinforce those noted earlier: online purchase and delivery of
goods shows much less distance sensitivity, and so may facilitate concentration of eco-
nomic activity. Online booking of services to be consumed on site does not show an effect
of similar magnitude. In product categories which blend these two types of activity, the
distance coefficient tends to be reduced in magnitude for online cases, but is not driven
near zero.
4.5 Predictors of inter-city trade links
In previous sections we analyzed inter-département trade relations. In this section we ex-
tend the baseline analyses to study inter-city trade relations. Tables 6 and 7 report the
estimation results and can be compared with Tables 2 and 3. We note however that the
‘Neighbours’ variable is not directly comparable; in the case of cities, we use this variable
to indicate that the cities are located in départements which are neighbours, i.e. share a
border.18
Three main conclusions can be drawn from the estimation results. First, distance be-
tween cities is still a negative predictor of off-line trade. However, the strength of the
18 While there are some cases of cities which literally border each other, in most cases there is no contiguity
with the boundaries of another city.
24Vous pouvez aussi lire