STRATEGIES TO ASSESS AND IMPROVE PROGNOSTICATION OF PLASMA CELL DISORDERS - From DEPARTMENT OF MEDICINE, HUDDINGE Karolinska Institutet ...
←
→
Transcription du contenu de la page
Si votre navigateur ne rend pas la page correctement, lisez s'il vous plaît le contenu de la page ci-dessous
From DEPARTMENT OF MEDICINE, HUDDINGE
        Karolinska Institutet, Stockholm, Sweden

STRATEGIES TO ASSESS AND IMPROVE
 PROGNOSTICATION OF PLASMA CELL
           DISORDERS

                    Charlotte Gran

                   Stockholm 2021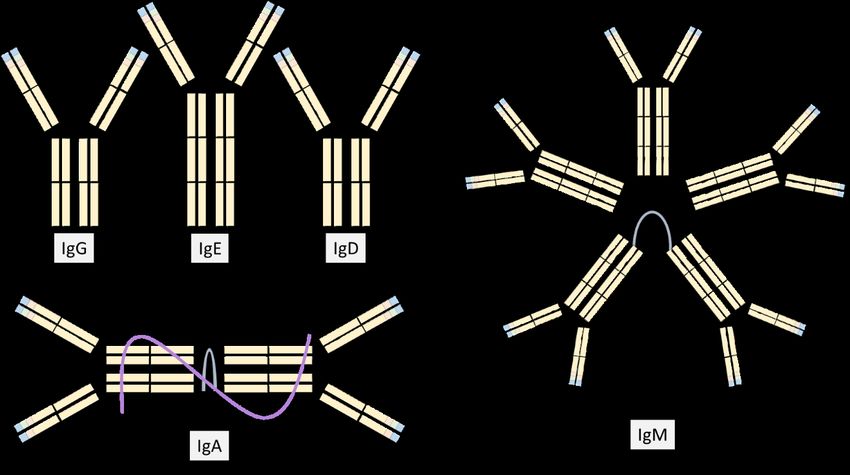
All previously published papers were reproduced with permission from the publisher.
Published by Karolinska Institutet.
Printed by Universitetsservice US-AB, 2021
© Charlotte Gran, 2021
ISBN 978-91-8016-075-9

STRATEGIES TO ASSESS AND IMPROVE
PROGNOSTICATION OF PLASMA CELL DISORDERS
THESIS FOR DOCTORAL DEGREE (Ph.D.)

By

Charlotte Gran

The thesis will be defended in public at ANA Future, Von Behring, Stockholm, 2021-03-26
13:00 CET

Supervisors:                                 Opponent:
Hareth Nahi                                  Professor Kimmo Porkka
Karolinska Institutet                        University of Helsinki
Department of Medicine Huddinge              Department of Medicine
Division of Center for Hematology and
Regenerative Medicine                        Examination Board:
                                             Professor Gösta Eggertsen
Evren Alici                                  Karolinska Institutet
Karolinska Institutet                        Department of Laboratory Medicine
Department of Medicine, Huddinge
Division of Center for Hematology and        Associate Professor Annette Vangsted
Regenerative Medicine                        Copenhagen University Hospital, Rigshospitalet
                                             Department of Hematology

                                             Associate Professor Maria Willrich
                                             Mayo Clinic College of Medicine and Science
                                             Department of Laboratory Medicine and Pathology
Till Johan, Alexandra och Cornelia – bryggan väntar på oss

POPULAR SCIENCE SUMMARY OF THE THESIS
Plasmacellssjukdomar (PCD) är en grupp av olika blodsjukdomar som uppstår i våra
plasmaceller och beror på förändringar i plasmacellernas gennivå. Dessa sjukdomar blir mer
vanligt förekommande med stigande ålder och kan därför komma att bli ett växande problem
med en åldrande befolkning. Karaktäristiskt för PCD är den stora variationen av olika
sjukdomsformer som kräver olika uppföljning och behandling. Detta variera från att
kontinuerliga kontroller men utan behandling till att behandla med exempelvis cellgifter och
byte av stamceller i benmärgen. Det är viktigt att i ett tidigt skede av sjukdomsförloppen
kunna förutse vilka individer som löper en stor risk att utveckla en av de allvarligare och mer
behandlingskrävande sjukdomsformerna. En tidigare upptäckt skulle kunna minska risken för
framtida komplikationer av sjukdomarna.

Gemensamt för majoriteten av PCD är att de sjuka plasmacellerna har förmåga att föröka sig
och börja producera antikroppar, s.k. M-komponent. Antikroppar är ett protein som normalt
hjälper immunförsvaret att skydda kroppen mot skadliga ämnen, exempelvis bakterier och
virus. Antikropparna, som produceras vid PCD, är tyvärr av en och samma typ och kan därför
inte bidra till att stärka immunförsvaret. I stället kan de stora mängderna av likartade
antikroppar skada kroppen, till exempel genom att ansamlas i njurarna och därmed försämra
njurarnas funktion. Den ökande mängden av plasmaceller kan också skada benmärgen, vilket
leder till blodbrist, men även skada på det skelettet som omger benmärgen kan uppstå. Dessa
antikroppar eller M-komponenten går oftast att mäta i både blodet och urinen vilket gör att
dessa sjukdomar lätt kan spåras genom relativt enkel provtagning. Dessutom kan man även
mäta mängden av fria lätta kedjor (FLC), som är en del av M-komponenten, i blodet. Oftast
används en kombination av M-komponent och FLC mätningar för att identifiera och följa upp
de olika sjukdomsformerna.

Det övergripande syftet med detta doktorandprojekt var att utvärdera dels riskfaktorer, dels
nivåskillnader i biomarkörer över tid för att förbättra diagnostik samt uppföljning av patienter
med PCD. Tre sjukdomsformer av PCD är fokus för doktorandprojektet. Två av dessa,
monoklonal gammopati av oklar signifikans (MGUS) och asymtomatisk multipel myeloma
(SMM), behöver inte läkemedelsbehandling men i de flesta fall krävs en livslång uppföljning
på grund av risken att bli behandlingskrävande. Den tredje sjukdomsformen är multipelt
myelom (MM) som är den näst vanligaste blodcancern i världen. Denna blodcancer kräver i
regel omgående läkemedelsbehandling. Forskning har visat att de patienter som utvecklar
MM med stor sannolikhet tidigare har haft MGUS eller SMM. Det finns därför ett stort
intresse av att under uppföljningen av dessa tillstånd tidigt kunna urskilja riskfaktorer för
utveckling av MM. Utöver detta har tidigare studier visat på en ökad dödlighet hos personer
med MGUS, men det saknas alltjämt kunskap om vilka riskfaktorer som är kopplade till
denna ökade dödlighet.

Denna avhandling fokuserar därför på tre huvudsakliga frågeställningar: Den första frågan är
om man kan förutse risken för att utveckla behandlingskrävande sjukdom hos individer med
MGUS och SMM genom att mäta skillnader i biomarkörer över tid (studie I och II). Den
andra frågan är om man antingen genom att mäta M-komponent eller FLC snabbare kan
påvisa att patienter med MM svarar på sin behandling samt får återfall i sin sjukdom (studie
III). Den tredje frågan slutligen är att identifiera vilka riskfaktorer som är förknippade med
en ökad dödlighet hos individer med MGUS (studie IV). Studierna är godkända av svenska
etikprövningsnämnden och baserar sig på historiska data.

I studie I, undersökte vi hur olika metoder för att mäta M-komponenten över tid kunde
indikera vilka personer med MGUS som riskerade att bli behandlingskrävande genom att
studera ökningar av M-komponenten, efter det att en person fått en MGUS diagnos, och fram
till dess att de utvecklade MM. Resultatet jämfördes mot en grupp av personer med MGUS
som inte utvecklade MM. I denna studie kunde vi peka på att personer där FLC ökade med
100mg/L eller mer under uppföljningen löpte större risk att bli behandlingskrävande än de
vars FLC-nivåer låg stilla eller ökade med mindre än 100mg/L. Vi kunde även påvisa att flera
andra riskfaktorer, en ålder överstigande 65 år, en M-komponent >15g/L och/eller FLC
>100mg/L. var betydelsefulla för att lättare kunna identifiera individer som riskerade att bli
behandlingskrävande. Detta visar på att det är viktigt att inte bara bedöma riskfaktorer vid
första diagnostillfället utan även under uppföljningen av en individ med MGUS.

I studie II fokuserade vi på vilka faktorer, hos individer med SMM, som pekade på en ökad
risk att bli behandlingskrävande. Våra resultat visar att ökningar över tid både av M-
komponent och FLC är viktiga riskfaktorer att upptäcka personer med risk för att få MM.
Intressant var att våra forskningsresultat även pekade på att patienter med ökad FLC-kvot vid
diagnostisering inte hade en ökad risk för att utveckla MM. Men om FLC-kvoten ökade över
tid under uppföljning förelåg risk för att utveckla MM. Dessa resultat visar på vikten av att
kontinuerligt förnya bedömningen av risken att utveckla en behandlingskrävande sjukdom
under uppföljningen av individer med SMM.

I studie III, undersökte vi patienter med MM för att granska potentiella tidsskillnader mellan
nivåerna av M-komponent och FLC för att bedömning av svar på behandling, minskning av
nivåerna, och återfall, ökning av nivåerna. Vi fann att svar på behandling, dvs minskning av
nivåer, sågs lika snabbt eller snabbare med FLC som med mätning av M-komponent. Analys
av FLC var även likvärdigt gentemot M-komponent, i de flesta fall, för att kunna bedöma när
patienter fick ett återfall. Undantaget var hos personer med väldigt låga eller omätbara nivåer
av FLC vid start av behandling. Detta visar att mätningar av FLC skulle kunna komplettera
eller i vissa fall ersätta av M-komponent vid bedömning av svar på behandling och återfall för
patienter med MM

I studie IV, vars syfte var att identifiera riskfaktorer för en ökad dödlighet hos individer med
MGUS som inte hade utvecklat en behandlingskrävande blodsjukdom eller MM. Vi fann ett
flertal faktorer som var sammanlänkade med ökad dödlighet, däribland en viss typ av MGUS,
lättkedje MGUS, nedsatt njurfunktion och låga albuminnivåer. I gruppen av lättkejde MGUS,
dog en stor andel av personerna av hjärtsjukdom. Lättkedje MGUS kännetecknas av
produktion av endast en liten del av M-komponenten, den s.k. lätta kedjan: Hos vissa
individer kan denna lätta kedja ansamlas i hjärtat vilket leder till nedsatt funktion. Då vi
kunde visa på ett samband mellan lättkedje MGUS och dödlighet samt att individer med
lättkedje MGUS dog av hjärtsjukdom i relativ utsträckning kan det vara möjligt att personer
hade denna form av inlagringssjukdom, AL amyloidos. Våra rön indikerar att individer med
lättkedje MGUS bör undersökas och följas upp avseende hjärtåkommor.
De fyra studierna i denna avhandling har resulterat i ökade kunskaper om hur utredning med
FLC kompletterar utvärdering av M-komponent vid MGUS, SMM och MM. En förbättrad
uppföljning av individer med MGUS och SMM skulle potentiellt kunna leda till mindre
lidande för patienten och lägre kostnader för sjukvårdande behandlingar genom att tidigare
kunna identifiera individer med behov av behandling. För patienter med MM kan en
förbättrad uppföljning leda till en möjlighet att tidigare kunde ändra pågående eller sätta in
nya behandlingar. Vidare kan denna avhandling öppna upp för ytterligare forskningsinsatser
framför allt inom området med dödlighet hos individer med lättkedje MGUS.
ABSTRACT
Plasma cell dyscrasias (PCD) are a group of disorders, most of which have the
overproduction of monoclonal immunoglobulins (M-protein) in common. Included in the
group of PCDs are both benign and treatment demanding disorders. Multiple myeloma
(MM) is one of the treatment demanding PCDs and also the second most common
hematological malignancy. Monoclonal gammopathy of undetermined significance (MGUS)
and smoldering multiple myeloma (SMM) are both PCD disorders currently not thought to
require treatment. Although, in the case of SMM, recent trials have shown the time to
progress to symptomatic MM was prolonged with treatment.

Biomarkers are an essential key for diagnosing, risk prediction, and monitoring diseases. An
essential biomarker in PCDs is the assessment of M-protein in serum/plasma and urine used
to detect and monitor. In the past decades, new research findings and technical development
of biomarkers have improved the ability to diagnose and monitor PCDs. Particularly, serum
free light chain (FLC) assessment has shown an important role in diagnosing and risk
prediction in MGUS, SMM, and MM and for assigning stringent complete response in MM.
Research has shown that MGUS or SMM consistently precedes MM. This observation has
lead to a growing interest in the dynamic evaluation of biomarkers to predict patients at risk.
However, the kinetics of biomarkers in PCDs is still a developing research field.

In study I, we aimed to identify dynamic changes of M-protein and FLC associated with
increased risk of progression from MGUS to symptomatic MM. We observed that dynamic
increases of involved FLC (iFLC) above 100mg/L were a consistent risk factor during
follow-up, while M-protein elevations above 5g/L were associated with increased risk of
progression at only a few time-points. Furthermore, we identified several independent
predictors of progression at the time of MGUS diagnosis, age >65 years, M-protein >15g/L,
and iFLC >100mg/L. We observed that the 5-year cumulative probability of progression was
higher in patients with two or three risk factors at diagnosis (31%) than patients with no risk
factors (2%).

In study II, we attempt to define cut-offs for temporal biomarkers in individuals with SMM,
associated with progression to symptomatic MM. We found that increases of M-protein and
iFLC ratio (iFLCr) were significant predictors of progression, with the optimal cut-offs at
>5g/L and >4.5, respectively. Moreover, we could confirm that clonal bone marrow plasma
cells >20% and M-protein >20g/L, at diagnosis, were independent risk factors of progression.
Interestingly, while increases in iFLCr during follow-up were associated with increased risk
of progression, iFLCr at diagnosis were not an independent risk factor.

In study III, we investigated whether response and progression in patients with MM were
detected earlier by iFLC or M-protein. We observed that at least partial response, or better,
was overall observed significantly earlier when assessed with iFLC than M-protein, while no
overall significant differences were detected between the two biomarkers when detecting
biochemical progression. Subgroup analysis included heavy chain type, measurable disease
groups, and early and late progression. In these subgroup analyses, iFLC appears to be non-
inferior in response detection compared to M-protein. The subgroup analyses of the time to
progression showed that M-protein detected biochemical progression significantly earlier
than iFLC in patients with iFLC 10g/L.

In study IV, we investigated the causes of death and risk factors for overall survival in
patients with MGUS that had not progressed to hematological malignancy. Light chain
MGUS (versus IgG MGUS) was associated with inferior survival. Additionally, independent
predictors for overall survival were male gender, hypoalbuminemia, and renal insufficiency.

In conclusion, with these studies, we have increased the knowledge of temporal FLC and M-
protein assessments in MGUS, SMM, and MM, potentially improving these patients’ follow-
up. Furthermore, this dissertation may open up further research efforts, especially in excess
mortality in individuals with light chain MGUS.
LIST OF SCIENTIFIC PAPERS

  I. Gran C, Liwing J, Wagner AK, Verhoek A, Gezin A, Alici E, Nahi H.
     Comparative evaluation of involved free light chain and monoclonal spike as
     markers for progression from monoclonal gammopathy of undetermined
     significance to multiple myeloma. Am J Hematol. 2021; 96:23-30. doi:
     10.1002/ajh.25999.
 II. Gran C, Luong V, Borg Bruchfeld J, Liwing J, Afram G, Lund J, Usmani S,
     Alici E, Nahi H. Dynamic follow-up of smoldering multiple myeloma
     identifies a subset of patients at high risk of progression Am J Hematol. 2020
     Dec 2. doi: 10.1002/ajh.26062. Epub ahead of print. PMID: 33264449.
III. Gran C, Afram G, Liwing J, Verhoek A, Nahi H. Involved free light chain,
     an early independent predictor of response and progression in multiple
     myeloma. Manuscript under revision in Leukemia and Lymphoma
IV. Gran C, Wersäll J, Susek K H, Wagner A K, Afram G, Nahi H. Light chain
     subtype and severe inflammation predicts worse overall survival in
     Monoclonal gammopathy of undetermined significance. Manuscript
SCIENTIFIC PAPERS NOT INCLUDED IN THE THESIS
I. Klimkowska M, Nannya Y, Gran CE, Mansson R, Douagi I, Ogawa S,
Nahi H, Tobiasson M. Absence of a common founder mutation in patients
with co-occurring myelodysplastic syndrome and plasma cell disorder. Blood
2020 Oct 29:blood.2020007555. doi: 10.1182/blood.2020007555. Online
ahead of print. PMID: 33120432
II. Afram G, Gran C, Borg Bruchfeld J, Wagner AK, Hussain A, Alici E,
Nahi H. Impact of performance status on overall survival in patients with
relapsed and/or refractory multiple myeloma: Real-life outcomes of
daratumumab treatment. Eur J Haematol. 2020 Dec;105(6):751-754. doi:
10.1111/ejh.13502. Epub 2020 Aug 18. PMID: 32745304
III. Susek KH, Gran C, Ljunggren HG, Alici E, Nahi H. Outcome of COVID-
19 in multiple myeloma patients in relation to treatment. Eur J Haematol.
2020 Dec;105(6):751-754. doi: 10.1111/ejh.13502. Epub 2020 Aug 18.
PMID: 32745304
IV. Gran C, Borg Bruchfeld J, Ellin F, Nahi H. Rapid Complete Response to
Single-Agent Bcl-2 Inhibitor Venetoclax in a Heart-Transplanted Patient with
Triple Refractory Immunoglobulin Light-Chain Amyloidosis. Acta Haematol.
2020;143(5):500-503. doi: 10.1159/000504355. Epub 2020 Jan 2. PMID:
31896106
V. Gran C, Wang J, Nahi H, Koster L, Gahrton G, Einsele H, Niittyvoupio
R, Edinger M, Beelen D, Ciceri F, Bornhäuser M, Finke J, de Wreede LC,
Ljungman P, Mielke S, Tischer J, Garderet L, Schönland S, Yakoub-Agha
I, Kröger N. Treosulfan conditioning for allogeneic transplantation in
multiple myeloma - improved overall survival in first line haematopoietic
stem cell transplantation - a large retrospective study by the Chronic
Malignancies Working Party of the EBMT. Br J Haematol. 2020
Jun;189(5):e213-e217. doi: 10.1111/bjh.16642. Epub 2020 Apr 16. PMID:
32301111
VI. Nahi H, Chrobok M, Gran C, Lund J, Gruber A, Gahrton G, Ljungman P,
Wagner AK, Alici E. Infectious complications and NK cell depletion
following daratumumab treatment of Multiple Myeloma. PLoS One. 2019
Feb 13;14(2):e0211927. doi: 10.1371/journal.pone.0211927. eCollection
2019. PMID: 30759167
VII. Gran C, Uttervall K, Bruchfeld JB, Wallblom A, Alici E, Gahrton G,
Nahi H. Translocation (11;14) in newly diagnosed multiple myeloma, time to
reclassify this standard risk chromosomal aberration?. Eur J Haematol. 2019
Dec;103(6):588-596. doi: 10.1111/ejh.13325. Epub 2019 Oct 6. PMID:
31487754
VIII. Uttervall K, Borg Bruchfeld J, Gran C, Wålinder G, Månsson R, Lund J,
Gahrton G, Alici E, Nahi H. Upfront bortezomib, lenalidomide, and
dexamethasone compared to bortezomib, cyclophosphamide, and
dexamethasone in multiple myeloma. Eur J Haematol. 2019 Sep;103(3):247-
254. doi: 10.1111/ejh.13280. Epub 2019 Jul 7. PMID: 31231833
IX. Gran C, Gahrton G, Alici E, Nahi H. Case Report: Treatment of light-chain
amyloidosis with daratumumab monotherapy in two patients. Eur J Haematol.
2018 Apr;100(4):386-388. doi: 10.1111/ejh.13008. Epub 2018 Jan 1. PMID:
29226427CONTENTS
1 Background...................................................................................................................... 1
1.1 A brief history of diagnostics in Plasma Cell Dyscrasias .................................... 1
1.2 Plasma Cell evolution and Monoclonal Protein ................................................... 3
1.3 Biomarkers ............................................................................................................. 5
1.3.1 General aspects of biomarkers for Plasma Cell Disorders....................... 5
1.3.2 Plasma Cells .............................................................................................. 6
1.3.3 Protein Electrophoresis and Immunofixation ........................................... 6
1.3.4 Free Light Chains ...................................................................................... 8
1.3.5 Immunoglobulin assessment ..................................................................... 9
1.4 Plasma Cell Dyscrasias .......................................................................................10
1.4.1 Epidemiology ..........................................................................................10
1.4.2 Diagnosis and disease evolution .............................................................11
1.4.3 Monoclonal Gammopathy of Undetermined Significance ....................13
1.4.4 Smoldering Multiple Myeloma...............................................................16
1.4.5 Multiple Myeloma...................................................................................17
1.5 Research gap ........................................................................................................18
2 RESEARCH AIMS .......................................................................................................19
3 MATERIALS AND METHODS .................................................................................21
3.1 Setting and Overview ..........................................................................................21
3.2 Study population and Study design.....................................................................22
3.3 Materials ..............................................................................................................23
3.4 Statistical Analysis ..............................................................................................26
3.5 Ethical and legal aspects......................................................................................29
4 RESULTS ......................................................................................................................31
4.1 Study I ..................................................................................................................31
4.2 Study II ................................................................................................................34
4.3 Study III ...............................................................................................................36
4.4 Study IV ...............................................................................................................38
5 DISCUSSION ...............................................................................................................39
5.1 Methodological concerns ....................................................................................39
5.2 General discussion ...............................................................................................42
5.3 Main Findings ......................................................................................................42
5.3.1 Temporal risk prediction in MGUS and SMM ......................................42
5.3.2 Predictors of progression at diagnosis in MGUS and SMM .................44
5.3.3 Dynamics in response and progression assessment ...............................45
5.3.4 The excess mortality in MGUS ..............................................................46
6 CONCLUSIONS AND POINT OF PERSPECTIVE ..................................................49
7 ACKNOWLEDGEMENTS..........................................................................................51
8 REFERENCES ..............................................................................................................53LIST OF ABBREVIATIONS
AGA High-resolution agarose gel electrophoresis
BM Bone marrow
BMPC Clonal bone marrow plasma cells
CA Chromosomal Aberration
CE Capillary electrophoresis
CI Confidence Interval
CRAB Criteria for symptomatic MM, hyperCalcemia, Renal impairment, Anemia,
Bone lesions
CV Coefficient of Variation
eGFR Estimated glomerular filtration rate
FISH Fluorescent in situ hybridization
FLC Free light chain in serum
FLCr Free light chain ratio in serum
GPS Glasgow Prognostic Score
HR Hazard Ratio
IFE Immunofixation
iFLC Involved free light chain in serum
iFLCr Involved free light chain ratio in serum
IMWG International Myeloma Working Group
IQR Interquartile Range
ISS International Staging System
ISUB Immunosubtraction
KM Kaplan-Meier plot
KUL Karolinska University Laboratory
LC-MGUS Light chain monoclonal gammopathy of undetermined significance
LIS Laboratory Information System
MDE Myeloma Defining Event
MGUS Monoclonal gammopathy of undetermined significance
MM Multiple myeloma
M-protein Monoclonal immunoglobulin in serum/plasmaOS Overall Survival PC Plasma cell PCD Plasma cell dyscrasia PEP Protein electrophoresis RCV Reference change value R-ISS Revised - International Staging System ROC Receiver operator characteristic ROC AUC Area under the ROC-curve SHM Somatic hypermutation SMM Smoldering multiple myeloma TTP Time to progression TTR Time to response uIFE Immunofixation of urine uM-protein Monoclonal immunoglobulin in urine uPEP Protein electrophoresis of urine
1 BACKGROUND
Plasma cell dyscrasias (PCD) refers to a group of disorders characterized by the clonal
proliferation of plasma cells (PC). This proliferation of malignant plasma cells can result in
monoclonal protein (M-protein) production and ultimately end-organ damage. However, the
diseases have a heterogeneous spectrum of severity and outcomes. PCD’s can present as
benign forms, monoclonal gammopathy of unknown significance (MGUS), and smoldering
multiple myeloma (SMM), which still require lifelong follow-up in the majority of cases.
Nevertheless, many patients are identified only when the end-organ damage is apparent, such
as multiple myeloma (MM) and plasma cell leukemia (PCL). The PCD’s are disorders of the
elderly. With the increased incidence observed in elderly patients, an increased prevalence of
PCDs could be anticipated with a growling elderly population.

The acts of diagnosing, monitoring progression from benign to symptomatic disease,
response to treatment, and relapse are essentially dependent on accurate laboratory testing.
Assessment of end-organ damage is included in guidelines for diagnosing in PCDs as well as
management of MM. However, the fundament for MGUS, SMM, and MM related laboratory
investigation is the detection, quantitation, and typing of the M-protein produced by the
clonal PCs. Several traditional chemistry laboratory assays, such as electrophoresis (PEP) and
immunofixation (IFE) of serum and urine, are vital for assessing the M-protein. In recent
years, assays detection free light chains (FLC) in serum have further increased the ability to
detect and monitor the PCDs.

1.1   A BRIEF HISTORY OF DIAGNOSTICS IN PLASMA CELL DYSCRASIAS
Since the early days of humanity, attempts to explain and treat diseases have been abundant.
These attempts have included trying to identify a disease or condition. One of the earliest
descriptions of a test for a condition is found in the Berlin papyrus dating back to 1350 BC
(1). “Another test for a woman who will bear or a woman that will not bear. Wheat and spelt;
let the woman water them daily with her urine, like dates and like Sh’at seeds in two bags. If
they both grow she will’bear: if the wheat grows it will be a boy; if the spelt grows, it will be
a girl. If neither grow, she will not bear.” (Verse 2, 1-2. Translated by Dawson W.R (2)).
This diagnostic assessment has since been shown to identify pregnancy with a 70%
sensitivity (3).

The history of biomarkers in PCD is not as long as that of pregnancy. However, already in
1847, dr Bence Jones published the first record of a PCD assessment (4). Although the terms
PCD and MM had not been introduced, dr Bence Jones gave a detailed description of how to
treat urine samples to identify the compound he called hydrated deutoxide albumin, which we
now know as immunoglobulin light chains (5).

Von Rustizky first proposed MM as a term in 1873, when he observed several separate
tumors in the bone marrow (BM) of a patient during an autopsy (6). The tumor cells were
described, a round cell with a nucleus in the periphery, similar in size to leucocytes. PCs were
not yet defined; however, von Rustizky’s description would suggest these were the cells
identified. Once Marschalkó described PCs’ characteristics in 1895 (7), and BM evaluation

                                                                                                1
from sternum aspiration was introduced in 1929, the possibility to identify patients pre- mortem increased (8). The great work by Tiselus in the late 1930s led to the advent of electrophoresis (PEP), which enabled the separation of proteins (9, 10). Using PEP, Longsworth et al. could identify the distinct pattern of a narrow peak that we now know represents the M-protein (11). Immunofixation (IFE), where the heavy and light chains of the M-protein are identified, further refined the PEP diagnostics of PCDs (12). Korngold and Lipari were able to show that the proteins in urine described by Dr. Bence Jones were, in fact, the light chains of a monoclonal IgG (13). Their observations were honored by naming the detected light chains kappa and lambda. Several methods to detect the free light chain (FLC) of the M-protein in serum have been attempted. However, the early assays could not distinguish between FLC and the light chains of intact antibodies. This problem was solved in 2001 with the introduction of Freelite, a nephelometric assay using polyclonal antibodies, that allowed for detection of the FLC (14). Currently, methods using both mono and polyclonal antibodies are available in the diagnostic repertoire. 2
1.2   PLASMA CELL EVOLUTION AND MONOCLONAL PROTEIN
A broad spectrum of terminally differentiated plasma cells are developed from B-cells in the
healthy immune system. These specialized plasma cells each secrete a unique
immunoglobulin (Ig), an antibody. The antibodies are composed of two identical heavy chain
classes (IgM, IgG, IgA, IgD, or IgE), and two identical light chain classes (kappa κ or lambda
λ) (Figure 1).

 Figure 1. The five immunoglobulin classes

The differentiated plasma cells develop from the hematopoietic stem cells that have
undergone a V(D)J recombination, somatic hypermutation (SHM), and isotype switch to
produce a large variety of Igs, each with a different variable region. The V(D)J recombination
starts in the Pro-B-cells in the BM. During the V(D)J recombination, the heavy and light
chain loci DNA are recombined. In the heavy chain loci, a D (diverse) segment and a J
(joining) segment are first combined and then joined to a V( variable) segment. During the
recombination, the V(D)J segments not used are discarded. A similar process occurs for light
chains, except that only V and J segments are recombined. The constant region of the
antibody is later spliced during RNA processing (Figure 2) (15).

The immature B-cells migrate from the BM to the lymphoid tissue, undergoing further
activation and maturation. This maturation includes the SHM and the isotype switching. Once
activated, the B-cells can differentiate into memory B-cells or plasma cells that will secrete a
unique Ig. With this differentiation utilizing V(D)J recombination, SHM, and the isotype
switching recombination, a theoretical range of 3x10¹¹ possible combinations for the variable
region could be produced.

                                                                                              3
Figure 2. A. Overview of V(D)J recombination process on DNA and RNA levels. B. The structure of the antibody with the heavy and light chains The various subclasses of immunoglobulins exhibit different half-times. The intact Igs have a relatively long-half-life due to their size, 146-970 kDa, making them too large to pass through glomerular filtration and degradation. For IgA and IgM, the half-life is approximately 6 and 10 days, respectively, while concentration-dependent recycling in IgG increases the half-life to approximately 21 days (15). On the other hand, the light chains, κ or λ, which are produced in excess, can pass through glomerular filtration on account of their smaller size, 22.5kDA and 45kDa for κ or λ respectively. The light chains are then degraded in the proximal tubuli. This rapid metabolism by the kidneys can be seen in the short half-life of the light chains, 2-4 hours for κ and 3-6 hours for λ. In cases of renal impairment, the light chains are degraded by the same system as intact Igs, pinocytosis, which leads to an increased half-life of approximately 2-3 days. During the PC differentiation, genetic/chromosomal aberrations can be introduced into the PC’s genome. A gene associated with cell growth or survival can potentially recombine with the promoter regions of the heavy or light chain locus causing a malignant transformation of the PC. Together with microenvironmental changes, these genetic changes can lead to the expansion of a single malignant PC clone (16). Once the PC’s malignant transformation has occurred, the single clone can have the potential to invade the BM and expand. This clonal expansion can ultimately cause end-organ damage, such as lytic bone lesions, affecting the normal hematopoiesis, which causes anemia. In the majority of cases, these malignant plasma cells will secrete an M-protein. The M- protein secreted by the PCs is usually detected in the serum or urine of the patients. An M- proteins discovery can often be an early observation, in many cases, preceding the presentation of symptomatic MM (17, 18). While the most common M-protein is an intact 4
M-protein, consisting of both heavy and light chains, they can also be composed of a light
chain only (κ or λ) and, in very rare cases, only of a heavy chain.

1.3 BIOMARKERS
The FDA-NIH biomarkers working group defined biomarkers in 2016 as “a defining
characteristic that is measured as an indicator of normal biological processes, pathogenic
processes, or biological responses to an exposure or intervention, including therapeutic
interventions.” (19)

A clinically useful biomarker should be specific, distinguish between healthy and diseased
states, and be easy to measure in routine clinical samples with well-defined reference ranges.
Furthermore, successful biomarkers must be evaluated with validated additional value to
established biomarkers (19, 20). It is also preferable if the biomarkers are cost-effective.

The validation of biomarkers is dependent on the biomarkers’ intended use, for example,
diagnosing, screening, risk modeling/staging, monitoring, or predicting the disease. Once the
difference in the biomarker’s expression in healthy and diseased individuals has been
established, the biomarkers’ relationship to the disease’s outcome must be validated (19-22).
A biomarker’s performance can be evaluated by sensitivity, specificity, positive and negative
predictive value, where sensitivity and specificity can assess and visualize the discriminatory
ability by receiver operation characteristic (ROC) curves. While 100% sensitivity and
specificity of a biomarker are sought after, a compromise between sensitivity and specificity
must often be made in reality. When diagnosing, it is essential to confirm and rule out healthy
individuals, therefore opting for high specificity, while in screening situations, the
biomarkers’ ability to identify true positive is often preferred, thus requiring high sensitivity
(23). Moreover, the reference change value (RCV), i.e., the difference attributed to a true
change in clinical status and not due to either biological or analytical variation, should be
considered when evaluating a biomarker (24).

A two-fold problem exists when introducing new tumor surrogate biomarkers. First,
heterogeneity of tumor cells can result in a need to combine multiple biomarkers to provide
adequate sensitivity and specificity in staging and monitoring the disease. Thus, new
biomarkers should be evaluated both alone and together with established biomarkers. Second,
biomarkers are often evaluated only at diagnosis or another single point in time, thus
providing only a cross-section evaluation of the disease and not considering its evolution. The
latter is essential when evaluating disorders with heterogenous outcomes and those where
there is a need to distinguish between premalignant and treatment demanding stages.

1.3.1 General aspects of biomarkers for Plasma Cell Disorders
There are many biomarkers for PCD either in use or suggested in studies. Most can be
classified as surrogate tumor markers or end-organ-specific markers. M-protein and FLC
assays detecting the secreted M-protein levels are used as surrogate markers of malignant
PCs’ proliferation and decline. End-organ damage markers include hemoglobin, creatinine,
and calcium. The essential surrogate tumor biomarkers used to diagnose and monitor PCD
are mentioned below. However, in literature, there are many more to be found.

                                                                                                 5
1.3.2 Plasma Cells As both lymphoproliferative disorders and PCDs can give rise to an M-protein, a distinction between these disorders is critically important due to the different treatment regimens used for the diseases. BM assessment can differentiate between a clonal plasma or lymphoid cell proliferation by morphology, immunohistochemistry, or flow cytometry. The BM assessment also evaluates the fraction of clonal PCs. The fraction of clonal bone marrow plasma cells (BMPC) is vital to differentiate between the subtypes of PCDs. In current diagnosis criteria, patients with BMPC%
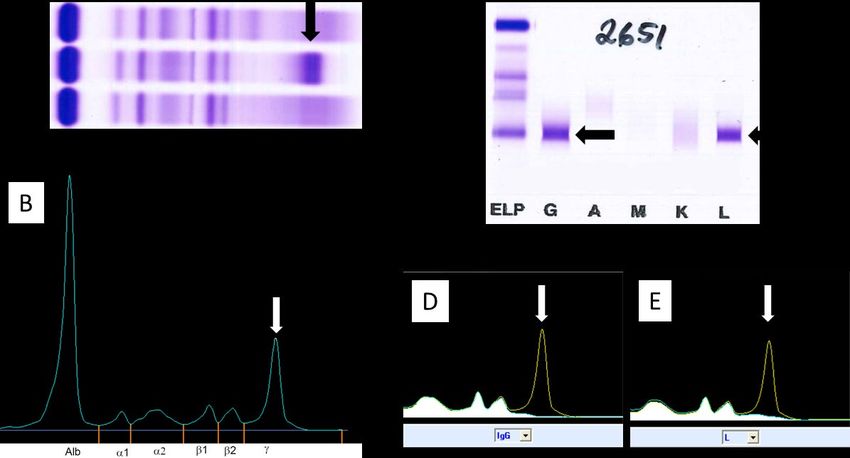
M-proteins (35, 36). Comparisons between these assays have shown a lack of concordance in
detection and quantitation of the M-protein (37-41)

 Figure 3. Detection (A and B) and class identification (C-E) of an IgG-λ M-protein with
 protein electrophoresis. A. High-resolution agarose gel electrophoresis B. Capillary
 electrophoresis. C. Immunofixation on agarose gel. D. IgG immunosubtraction in capillary
 electrophoresis, E. Lambda immunosubtraction in capillary electrophoresis. The arrows
 (black and white) points at the M-protein in each image.

Several challenges exist concerning the evaluation of PEP. The quantitation of M-protein is
influenced by the chosen technique to integrate the M-protein against the polyclonal
background. Both overestimation, with a perpendicular drop gating, or underestimation, with
tangent skimming gating, of the M-protein, have been observed (33, 41). The quantitation
can also be influenced by increased variability in smaller M-protein (
still be present with negative IFE, potentially affecting the accuracy of response classification
that is based on sPEP and IFE levels (30). RCV for M-protein has been determined in stable
MGUS patients. A change ranging from 25% up 39.6% in M-protein levels could be
attributed to biological and analytical CV (45-47). This RCV can be contrasted to the IMWG
relapse criteria, where a 25% increase of M-protein is classified as a biochemical progression.

Urine PEP (uPEP) is recommended in the work-up of suspected PCD to identify a possible
light chain M-protein. For adequate sensitivity, uPEP and urine IFE (uIFE) should preferably
be performed on the 24-h collection. However, a 24-h urine collection can be challenging to
adhere to by patients. Morning samples can detect an M-protein with adequate sensitivity (48,
49), while random samples are unsuitable when assessing uPEP and uIFE (48). UPEP is
affected by similar challenges as sPEP, including the detection limit.

1.3.4 Free Light Chains
The light chain part of an immunoglobulin, κ and λ, is produced in excess compared to the
heavy chain. This excess production can be detected with FLC assays. These assays use
mono or polyclonal antibodies targeting the light chain’s hidden epitope to quantify the
produced surplus. To assess the FLC, one has to account for the difference in production,
where κ is produced in approximately 1.8:1.0 ratio compared to λ (15), and the renal
clearance, where the monomer κ is cleared at approximately twice the rate of the dimer λ.
Evaluation with the κ/λ ratio can indicate the presence of an M-protein when abnormal FLC
ratios are observed. The ratio is reported either as κ/λ ratio (FLCr) or as involved/uninvolved
ratio (iFLCr). However, it is important to note that not all patients with a PCDs will have an
abnormal FLC ratio. Abnormal FLC ratios can be observed in 30-49% of MGUS cases and
74-90% in SMM compared to 95% of MM (18, 28, 50-52).

IMWG guidelines recommend assessing FLC in combination with serum IFE when screening
for PCDs, except when AL-amyloidosis is suspected (25). FLC evaluation is also included in
the risk stratification of MGUS and SMM (29, 53, 54). Assessment of FLC is incorporated in
the stringent complete response (sCR) (30). However, the IMWG guidelines only support
FLC assessment in patients with unmeasurable M-protein in serum and urine for stages other
than sCR when assessing response and progression (55, 56). These recommendations were
based on studies utilizing the Freelite assay. Currently, FLC measurements are not included
in the recommendations for monitoring either MGUS, SMM, or MM (29). The combination
of FLC and M-protein has repetitively demonstrated high sensitivity in MM diagnostics (28,
57). The high sensitivity has led to suggestions that response classification could be carried
out with FLC rather than uM-protein (58). Additionally, as FLC serum dynamics are more
rapid than immunoglobulins, an earlier prediction of response (including progression) could
be anticipated in patients with MM (59). However, FLC’s role compared to M-protein in
assessing time to response or biochemical progression has not been thoroughly investigated.
When evaluating FLC changes over time, similar to M-protein, the RCV of FLC should be
considered (45, 47).

   8
Assays for FLC detection
In 2001, a novel assay was released, Freelite, that detected the FLC (figure 4) (14). The
Freelite assay utilizes polyclonal antibodies together with a turbidimetric platform to detect
FLC (14). The advantages of the polyclonal antibodies are the ability to detect multiple
epitopes and the relative in-expensive. Several assays have been developed after the
introduction of Freelite. These assays have used both mono and polyclonal antibodies
together with either nephelometric or ELISA based methods. Of the second-generation
assays, N-Latex FLC utilizes monoclonal antibodies (60), for more reproducible detection,
together with a nephelometric assay, to increase sensitivity and precision. One potential issue
with a monoclonal-based assay is that the specificity for an antibody could be too specific.
Thus, not detecting the whole spectrum of potential targets. Comparative studies between
Freelite and N-Latex FLC have shown discrepancies in the absolute FLC values and iFLCr,
with N-Latex FLC consistently having lower levels (61-64). However, no study has shown
the superiority of either assay.
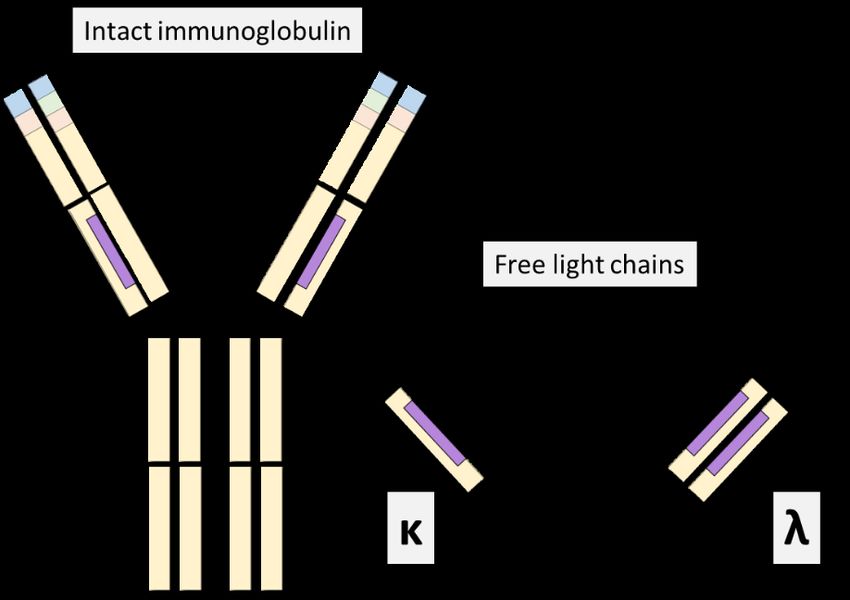
Figure 4. The hidden
epitope. Serum free light
chain assays utilize
antibodies that target an
epitope on the κ and λ
chain. In intact
immunoglobulins, this
epitope is located
between the heavy and
light chain and therefore
not accessible for
detection.
1.3.5 Immunoglobulin assessment
Assays to quantify the Ig levels is a complement to M-protein assessment. A wide range of
nephelometric, turbidimetric, and ELISA methods are available, however as these assays
cannot distinguish between poly- and monoclonal Igs, they lack adequate sensitivity to enable
complete detection of M-proteins as a stand-alone assay. With increased infiltration of
malignant PCs in the bone marrow, a reduction of uninvolved Igs can be observed.
Immunoparesis, the reduction of one or more of the uninvolved Igs below the lower limit of
normal, is a suggested risk factor for progression in both MGUS and SMM (65-71).
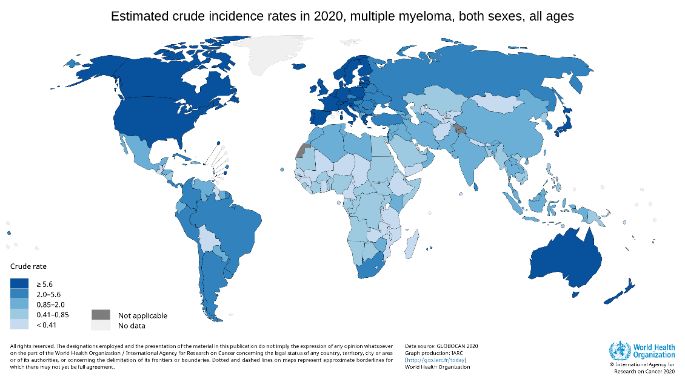
91.4 PLASMA CELL DYSCRASIAS 1.4.1 Epidemiology MM is the second most common hematological malignancy (72), with a median age at diagnosis of 66-70 years. The incidence of multiple myeloma worldwide was 2.1 per 100 000 in 2018 (73). However, the incidence rate varies considerably, with the higher rates seen in North America, northern Europe, and Australia (Figure 5). In Sweden, the incidence is approximately 6.7 cases per 100 000 (crude rate) (74). Within the group of PCDs, MGUS, rather than MM, is the most common presentation. The incidence of MGUS increases with age, affecting 3% of individuals 50 years or older and 10% of individuals over 70 years (75- 78). SMM occupies the space between MGUS and MM, but the incidence is difficult to ascertain due to the lack of an ICD code for SMM. Estimates from studies indicate that 8- 20% of patients diagnosed with MM were SMM, with an estimated incidence of 0,9 per 100 000 (79, 80). Similarly, the Swedish myeloma registry reported approximately 19% of MM cases from 2014 to 2018 as SMM (81). Figure 5 The crude incidence rate of multiple myeloma, source; the International Agency for Research on Cancer. (82) MM and MGUS are more common in men than women (83-87). In addition to differences between genders, there is a difference in prevalence by ethnicity. Both MGUS and MM are more common in African Americans than Whites, while Asians exhibit the lowest prevalence (88-91). 10
PCD, like many hematological disorders, is a disease of the elderly. An increasingly elderly
population together with diagnostics advantages will possibly lead to an increased prevalence
of PCD. As MGUS is often an incidental finding in routine laboratory testing (78), more
sensitive laboratory assays could increase incidence in the future. One indication of this
possible increased prevalence is the extensive studies of the Olmsted county cohort. In this
cohort the prevalence was estimated to 3.2% when assessed with PEP and IFE (78), 4.2%
when the assessment of FLC was added (92), and 5.1% with the introduction of mass-
spectrometry based evaluation (93).

1.4.2 Diagnosis and disease evolution

Diagnosis of MGUS, SMM, and MM is based on BMPC evaluation and M-protein
assessment together with end-organ damage appraisal (Figure 6) (25). The CRAB criteria
(increased serum calcium level, renal dysfunction, anemia, and destructive bone lesions)
define end-organ damage (Table 1). Anemia is the most common, of the CRAB criteria, in
symptomatic MM, observed in 73% of patients at diagnosis(94). As the anemia in MM is due
to decreased production, it is typically normocytic. In contrast, hypercalcemia is the least
common of the CRAB symptoms in MM(94).

 Figure 6 The diagnosis criteria of plasma cell disorders. MGUS= monoclonal
 gammopathy of undetermined significance, SMM=smoldering multiple myeloma, MM=
 multiple myeloma, BMPC=clonal bone marrow plasma cells, M-protein=Monoclonal
 protein in serum/plasma, MDE=Myeloma defining event including CRAB criteria *Non-
 IgM and IgM MGUS.

                                                                                           11
Table 1. Definitions of CRAB and MDE
Hypercalcemia Serum calcium level >2.75mmol/L or >0.25mml/L above
upper limit of normal
Renal creatinine clearance
CRAB
insufficiency 177µmol/L
Anemia hemoglobin value of >20g/L below the lowest limit of
normal or below 100 g/L
Bone Lesion ≥ one osteolytic lesion on skeletal X-ray, CT, or PET-CT
BMPC ≥60%
MDE
iFLCr ≥100 and involved FLC ≥100 mg/L
Focal lesion >one lesion, at least 5mm in size, on MRI
MDE=myeloma defining events, BMPC = clonal bone marrow plasma cells, iFLCr= involved serum
free light chain ratio, CT=computed tomography, PET-CT=positron tomography-CT, MRI=magnetic
resonance imaging
It is currently considered that symptomatic MM evolves from a premalignant stage, MGUS,
and SMM (17, 18, 86). This risk of evolution often leads to a life-long follow-up of patients
with MGUS and SMM. The overall progression rate to symptomatic MM is higher in
patients with SMM than MGUS (65, 68, 95, 96). However, the risk of progression in SMM
is not stable over time. Instead, the highest risk of progression is observed in the first five
years (10% annual risk), and after ten years, the risk or progression is similar to that of
MGUS (1% annually) (95)
Molecular heterogeneity
Characterization of the genetic landscape of MM and its more benign precursor stages have .
shown a vast genetic heterogeneity and complexity where the tumor cell genome can have
multiple structural variants and copy number variations in addition to a multitude of point
mutations. Two major subgroups of primary chromosomal aberrations have been identified in
MM: hyperdiploidy and non-hyperdiploidy (97-99). The former is characterized by trisomy’s
of odd number chromosomes and the latter by translocations affecting mainly the Ig heavy
(IGH) chains locus. Two translocations, t(4;14)(p16;q32) and t(14;16)(q32;q23) are
associated a shorter OS (100), while role of the most common IgH translocation
t(11;14)(q13;32) is unclear (101-104).
The gain of mutations required for the plasma cells to evolve from the premalignant stages of
MGUS and SMM to symptomatic MM have previously been studied, where clonal
heterogeneity is already present at MGUS and SMM (105). Two different patterns, static and
evolutionary, have been observed in SMM progression to MM (106). Similar is seen in
multiple myeloma where branching, linear and stable evolution patterns of chromosomal
aberrations can be seen during the treatment of MM (107-110). Therefore, biomarker
expression could be anticipated to show different patterns before, during, and after treatment.
121.4.3 Monoclonal Gammopathy of Undetermined Significance Three different types of MGUS, non-IgM MGUS, IgM MGUS, and light-chain MGUS (LC- MGUS), have been described (Table 2). MM progression patterns differ between these subtypes, ranging from 0.5 to 2% of annual risk of progression (50, 65, 92, 96, 111). Additionally, progression to other PCDs such as AL-amyloidosis can be observed (65, 68, 96, 112). Due to the risk of progression, a life-long follow-up is recommended, albeit with longer intervals between assessment for patients with a low risk of progression (29). However, as not all MGUS patients will progress to a treatment demanding MM, this lifelong monitoring of patients could be questioned. Particularly in those with unmeasurable M-proteins (
observed between MGUS and excess mortality might be without causation. However,
identifying risk factors associated with decreased overall survival in MGUS patients would
be interesting to expand the knowledge within to possible causes for the excess mortality.

Risk prediction in MGUS

The risk of MGUS progression has been evaluated in numerous prediction models (Table 3).
The current IMWG guidelines have incorporated the Mayo Clinic model (29). This model,
investigating risk factors in a cohort of 1384 MGUS, identified three risk factors, M-protein
>15g/L, abnormal FLCr, and non-IgG isotype (50, 112). The latter, non-IgG isotype, has not
been confirmed as an independent risk factor in other studies (68, 69, 115-117), but rather
IgA isotype. Thus, the non-IgG isotype could be regarded as an unreliable risk factor. In
addition to established risk factors, several other risk factors have been investigated. The
majority of these reflect the tumor burden or the end-organ damage caused by PC infiltration
in BM (65, 66, 68, 117-119). Immunoparesis has been suggested in multiple studies as a
potential risk factor (65, 66, 68, 117). The consistency of increased risk in multiple studies
would suggest its potential use in predictive models.

With the current IMWG risk prediction score, patients classified as low risk still have a 5%
risk of progression at 20 years (29). With this relatively low risk of progression, one might
advocate that low-risk patients could be omitted from follow up. On the other hand, as both
M-protein and FLC are comparatively non-invasive tests, monitoring these biomarkers would
be feasible in most MGUS patients. An evolving MGUS, any annual increase over a period
of three years, has been recognized as a risk factor for malignant transformation (116).
Similarly, changes from low-risk to high-risk MGUS prior to MM progression have been
observed in MGUS patients when assessed with the IMWG risk prediction model (117). This
observation indicates that FLC, in addition to M-protein, is an essential biomarker for
monitoring. However, cut-off in temporal changes in biomarkers associated with MGUS
progression and how to interpret the risk of progression when monitoring MGUS patients
with FLC has not been investigated to date.

   14
Table 3 Risk factors, assessed in peripheral blood, for progression in monoclonal gammopathy of undetermined significance
                             Blade et al    Cesana et al       Kyle et al (112) /    Rosinol et al   Tureson et al      Sandecka et al     Landgren et al
                             (115)          (65)               Rajkumar et al (50)/  (116)           (68)               (69)               (117)
                                                               Katzmann et al(120)
MGUS patients                120            1104               1384                  359             728                4887               685
Progress to MM               13 (10%)       43 (4%)            115 (6%)              32 (9%)         53 (7%)            162 (9%)           187 (27%)
Median age                   61             63*                72                    66              74                 63                 69
Median follow-up,            56             65                 185/185/NR            93              120                48                 **
months
IMWG risk factors
M-protein >15g/L             No             NR                 Yes                   Yes             Yes                Yes                Yes
Abnormal FLCr                NR             NR                 Yes                   NR              Yes                Yes                Yes
Non-IgG subtype              Only IgA       Yes                Yes                   Only IgA        No                 No                 Only IgA
Additional risk factors
Age                           No             NR              No                      No               NR                Yes                NR
Immunoparesis                 NR             Yes             No                      NR               Yes               Yes                Yes
Hemoglobin
1.4.4 Smoldering Multiple Myeloma Like MGUS, SMM is a premalignant stage to symptomatic MM, albeit with a higher risk of progression, 10% annual risk of progression in the first five years after diagnosis (95). As in MGUS, there is no end-organ damage in SMM; however, M-protein levels (≥30g/L) and/or the BMPCs (10-60%) are consistent with MM findings. The diagnosis criteria for SMM have changed during the years (25, 121) due to the identification of ultra-high-risk factors. These ultra-high-risk factors, ≥BMPC >60%, iFLCr ≥100 and 1 or more focal lesion on MRI, were initially considered risk factors for progression to MM but have since been redefined as MDE (25, 122-125). Evidence shows that treatment of high-risk SMM prolongs the time to progression (TTP) and even overall survival (OS) (126-128). However, as the cancer treatment investigated can have serious side-effects, including an increased risk of secondary malignancies (129), and not all SMM will develop MM, it is essential to identify those patients where the benefit will overweigh the risk of side-effects. Risk prediction in SMM Risk factors for SMM progression to MM have been extensively studied. Similar to MGUS, the M-protein size is a significant risk factor for progression also in SMM (52, 70, 71, 95, 130-134). The first Mayo clinic prediction score defined a group of SMM with M- protein>30g/L and BMPC>10%, where the 5-year progression was 68% in patients with both risk factors present at diagnosis (95). The risk prediction model was further refined with the incorporation of the iFLCr (52). A predictive value has also been associated with immunoparesis (70, 71), albumin (131), and FLCr/iFLCr (52, 71, 131, 132). Several of these studies included SMM patients according to the earlier diagnosis criteria (121) before MDE was defined. Thus, these studies could have included symptomatic MM in their cohorts. More recently, including SMM patients based on the 2014 criteria, defined BMPC (>20%), M- protein (>20g/L), or iFLCr (>20) as predictors of progression to MM(132). This observation has since been validated in a large multicenter study and incorporated into the SMM IMWG risk stratification (54). Although the assays used for FLC determination in the multicenter study are not specified, one can assume that it would have included patients assessed with Freelite and N-Latex as centers in Europe were included in the study. As the iFLC and iFLCr are highly dependent on the assay utilized (61-64), it would be important to validate the risk prediction model in an N-Latex FLC cohort. The evolving SMM, a successive increase of M-protein during follow-up, was initially described as a risk factor for progression to MM (130). Suggested dynamic risk factors for progression of SMM to MM have been an absolute and relative increase in M-protein (133- 136), the relative increase of iFLCr (136), and iFLC (135), as well as an absolute decrease in Hb (133, 135). The definition of both absolute and relative increase in M-protein and the timeframe over which changes had to occur differed between these studies, making comparisons difficult. The relative increase could potentially overestimate the risk of progression in patients with a minor M-protein. The studies either tried to adjust for this with either a more remarkable relative change in low-level M-protein or an absolute minimum 16
change. Even though there are differences between these studies, they all show dynamic
changes of the tumor surrogate markers such as M-protein and FLC could further
differentiate patients at risk of progression.

1.4.5 Multiple Myeloma
The 5-year survival rate in MM is rapidly increasing with the advance of novel therapies,
from approximately 40% in 2002 to 54% in 2010-2016 (137). However, MM is still
considered essentially incurable. Thus, a majority of patients will relapse and develop
resistance to existing therapies.

At baseline, the iFLC ratio has emerged as a prognostic marker for MM in several reports,
where high baseline iFLC is associated with worse overall and event-free survival (138-140).
However, other studies have not successfully demonstrated a correlation with survival (141,
142). In one of the later studies, early FLC response (at two months) was superior to early M-
protein response in predicting overall response (142). Earlier response by iFLC as a superior
factor in predicting overall response has been supported in several studies (139, 142, 143).
Both relative and absolute changes are well defined for M-protein and uM-protein, while
assessment by iFLC is currently only recommended in patients without measurable M-
protein/ uM-protein. Also, there is a lack of cut-offs for iFLC for response evaluation in MM
when the M-protein is evaluable in sPEP or uPEP. With a sensitivity close to 100%, when
iFLC, sPEP, and IFE is combined, it has been suggested that monitoring should be
performed with FLC instead of uM-protein (58).

In MM, biomarkers can be expected to fluctuate with the response to treatment and the
disease’s progression. Thus, evaluation of dynamic changes in the follow-up of MM is
crucial to determine response to treatment as well as to identify when biochemical
progression occurs (30).

Risk prediction in MM

The prediction models in MM focus on defining the risk at diagnosis rather than evaluating
changes over time. Several prognostic variables in newly diagnosed MM have been
identified, such as the subtype of M-protein, C-reactive protein, albumin, β2-microglobulin
(β2M), FLC, and CAs. The international staging system (ISS) is relatively easy to evaluate
due to the incorporation of only serum markers, β2M, and albumin, reflecting both tumor
burden and bone marrow microenvironment (144). CAs have been extensively investigated
as risk factors in MM, and several CAs have been assessed together with ISS (145-148). The
Revised International Staging System (R-ISS) builds on the ISS while also including CAs
associated with high-risk MM and lactate dehydrogenase (Table 4) (149).

                                                                                            17
Vous pouvez aussi lire