Paleotemperature investigation of the Variscan southern external domain: the case of the Montagne Noire (France) - Earth ...
←
→
Transcription du contenu de la page
Si votre navigateur ne rend pas la page correctement, lisez s'il vous plaît le contenu de la page ci-dessous
BSGF - Earth Sciences Bulletin 2021, 192, 3
© C. Montmartin et al., Published by EDP Sciences 2021
https://doi.org/10.1051/bsgf/2020043

                                                                                                                                        Available online at:
                                                                                                                                           www.bsgf.fr

Paleotemperature investigation of the Variscan southern external
domain: the case of the Montagne Noire (France)
Clément Montmartin*, Michel Faure and Hugues Raimbourg
Institut des Sciences de la Terre d’Orléans (ISTO), UMR 7327, Université d’Orléans-CNRS-BRGM, Campus Géosciences, 1A Rue de la
Férollerie, 45071 Orléans Cedex 2, France

             Received: 26 June 2020 / Accepted: 8 October 2020

             Abstract – The Montagne Noire located in the southern part of the French Massif Central represents the
             northern part of the South-Variscan Foreland. It is subdivided into three parts. The granite-migmatite Axial
             Zone dome is surrounded by non- or weakly metamorphosed Paleozoic sedimentary series. Both northern
             and southern flanks of the Montagne Noire dome are deformed by km-scale, south to southeast facing
             recumbent folds and thrusts sheets. The Raman Spectroscopy of Carbonaceous Material (RSCM) method,
             carried out in the low-grade metamorphic rocks of the southern flank of the Montagne Noire, yielded
             temperatures comprised between 400 °C near the dome, and 230 °C in the southern domain. Three Raman
             geothermometers were used to cover this temperature range. RSCM temperatures comply qualitatively with
             previous estimates based on illite crystallinity, conodont color alteration, and fluid inclusions carried out in
             the same area, which document a metamorphic temperature increase towards the dome. The isotherms cut
             across the different nappe contacts and are oriented parallel to the southern margin of the Axial Zone. This
             temperature distribution supports the idea that the thermal structure was acquired during the Axial Zone
             dome emplacement. The thermal structure acquired during the recumbent folds emplacement and burial of
             the sedimentary series is totally overprinted by the doming event. In addition, in a domain relatively remote
             from the Axial Zone dome, the RSCM measurements yielded significantly higher temperatures than illite
             crystallinity. This discrepancy points to a higher sensitivity of RSCM to short-lived thermal events than illite
             crystallinity, possibly because of more efficient kinetics of the carbonization reaction. On the other hand,
             high RSCM temperatures analysed far from the Axial Zone, between 300 °C and 360 °C could be explained
             by the presence of granitic plutons under the foreland basin.

             Keywords: Raman Spectroscopy of Carbonaceous Material (RSCM) / Granite-migmatite dome / Montagne Noire /
             Variscan orogen / French Massif Central / Recumbent folds

             Résumé – Étude de paléotempérature dans le domaine méridional externe varisque: le cas de la
             Montagne Noire (France). La Montagne Noire, située dans la partie sud du Massif Central français,
             représente la partie nord de l’avant-pays varisque. La zone est divisée en trois parties. Le dôme granite-
             migmatite de la zone axiale est entouré de séries sédimentaires paléozoïques pas ou faiblement
             métamorphisées. Les flancs nord et sud du dôme de la Montagne Noire sont déformés par des plis d’échelle
             kilométrique, déversés vers le sud sud-est. La méthode de spectrométrie Raman de la matière carbonée
             (RSCM), réalisée dans les roches de bas grade métamorphique du flanc sud de la Montagne Noire, a donné
             des températures comprises entre 400 °C près du dôme et 230 °C dans le domaine sud. Trois
             géothermomètres Raman ont été utilisés pour couvrir cette gamme de température. Ces températures
             RSCM sont qualitativement conformes aux estimations précédentes basées sur la cristallinité de l’illite, la
             couleur d’altération des conodontes et les inclusions fluides effectuées dans la même zone, qui démontrent
             une augmentation de la température vers le dôme. Les isothermes traversent les différents contacts de nappe
             et sont orientées parallèlement à la marge sud de la zone axiale. Cette distribution de température suggère
             que la structure thermique a été acquise lors de la mise en place du dôme de la zone axiale. La structure
             thermique acquise lors de la mise en place des plis couchés et de l’enfouissement des séries sédimentaires est
             ainsi totalement effacé par le dôme. De plus, dans un domaine relativement éloigné du dôme de la zone
             axiale, les mesures RSCM ont donné des températures significativement plus élevées que la cristallinité de

*Corresponding author: clement.montmartin@univ-orleans.fr

This is an Open Access article distributed under the terms of the Creative Commons Attribution License (https://creativecommons.org/licenses/by/4.0), which permits
                           unrestricted use, distribution, and reproduction in any medium, provided the original work is properly cited.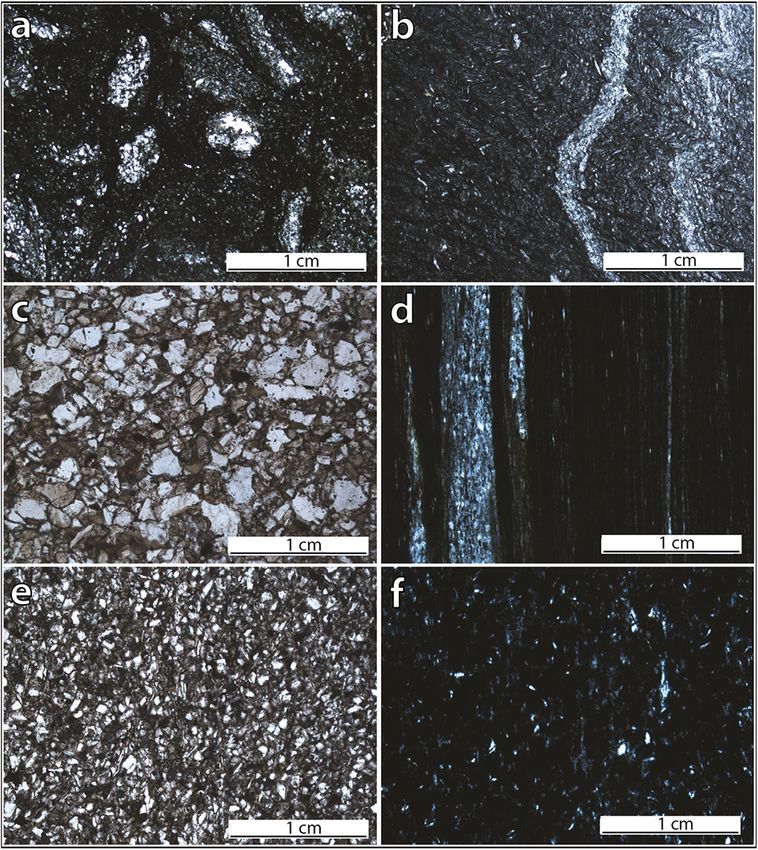
C. Montmartin et al.: BSGF 2021, 192, 3

           l’illite. Cette divergence indique une sensibilité plus élevée du RSCM face à la cristallinité de l’illite aux
           événements thermiques de courte durée, probablement en raison d’une cinétique plus efficace de la réaction
           de carbonisation/graphitisation. D’autre part, de fortes températures RSCM analysées loin de la Zone
           Axiale, entre 300 °C et 360 °C, pourraient être expliquées par la présence de plutons granitiques sous le
           bassin d’avant-pays.

           Mots clés : Spectrométrie Raman de la Matière Carbonée (RSCM) / Dôme granite-migmatite / Montagne Noire /
           Orogenèse Varisque / Massif Central Français / Plis couchés

1 Introduction                                                            When compared to other geothermometers, the biases
                                                                      linked to the kinetics of the thermal recording by the
    The knowledge of quantitative constraints, such as pressure,      carbonaceous material with respect to other mineral reactions
temperature, duration of heating, strain, strain rate, exhumation     should be considered (Velde and Lanson, 1993; Mullis et al.,
rate, and uplift rate, is essential to understand the formation and   2017). It appears that duration of heating heavily impacts
evolution of a mountain belt. In recent years, many studies (e.g.     maturity processes and is a key parameter that controls the
Beyssac et al., 2002; Gerya and Stöckhert, 2002) dealt with these     measured temperature (Wada et al., 1994; Mählmann, 2001;
issues thanks to significant advances in petrology and                 Le Bayon et al., 2011; Mori et al., 2017). Moreover, the
geochronology. In the inner domain of an orogen, temperature          geothermometers based on carbonaceous material differ from
and pressure conditions experienced by metamorphic rocks can          fluid inclusion or metamorphic mineral ones mostly because
be approached by petrological investigations based on mineral         no water is needed for the maturation of carbonaceous material
parageneses. On the contrary, in the outer domain, where the          (Velde and Lanson, 1993; Le Bayon et al., 2011). Thus, even if
deformation and associated metamorphism are usually less              the whole rock experienced the same thermal history,
developed than in the inner domain, the evaluation of the thermo-     disparities might be observed between the different methods.
barometric conditions is difficult, since the size of syn-tectonic         Further complexity arises when dealing with multi-
metamorphic minerals is generally small and conditions of             metamorphic events, as in the case of post-orogenic, large-
thermodynamic equilibria are often not achieved (Frey, 1987;          scale heating and pluton emplacement postdating collisional
Merriman and Frey, 1999; Merriman and Peacor, 1999). The              metamorphism, for instance in the Jebilet Massif in Moroccan
measurement of low temperature or low pressure values is              Variscan Belt (Delchini et al., 2016). A contact metamorphism
therefore delicate, and often bears a large error. However, several   linked to a magmatic intrusion may overprint the crystallinity
methods have been developed to overcome this problem and to           of carbonaceous material inherited from earlier stages, as it has
reach a quantitative knowledge of the conditions of low-grade         already been documented in several studies. For instance, Mori
metamorphism, including illite crystallinity, conodont alteration     et al. (2017), measured temperatures imposed by thin (50 m)
colour, calcite-dolomite thermo-barometer (e.g. Kübler, 1968;         magmatic bodies such as the Great Whin Sill in the UK,
Dunoyer de Segonzac et al., 1968; Epstein et al., 1977; Frey,         overprinting the regional low-grade metamorphism
1987). More recently, the Raman Spectroscopy of Carbona-              (< 300 °C). On a larger scale, Aoya et al. (2010) focussed
ceous Material (RSCM) method based on carbonaceous                    on contact metamorphic aureoles around granitic plutons in
material crystallinity has been developed for the temperature         Japan within two poorly metamorphosed accretionary com-
range 330–650 °C (Beyssac et al., 2002). Its applicability has        plexes (< 400 °C). Hilchie and Jamieson (2014) have studied
been further extended towards low temperatures (Rahl et al.,          the South Mountain Batholith intrusion thermicity of Nova
2005; Lahfid et al., 2010; Kouketsu et al., 2014), using               Scotia emplaced under a regional greenschist facies metamor-
different calibrations of the Raman spectra based on other            phism. In each case, RSCM temperatures decrease with the
geothermometers, such as vitrinite reflectance, fluid inclusions        distance to the intrusive bodies. Finally, shear heating between
microthermometry or illite crystallinity (Rahn et al., 1995,          structural units could also influence the organic matter
Hara et al., 2013) or indirect data on temperature provided by        organization (e.g. Mori et al., 2015). The interpretation of
fission-tracks and U-Th/He method (Rahl et al., 2005).                 RSCM data in domains with a poly-stage metamorphic
    The applicability of the RSCM method is a priori restricted       evolution is therefore often ambiguous, as the RSCM
to the conditions of its calibration. In all the different studies    measurements combine the contribution of regional syn-
that focused on RSCM at low temperature, the case studies             tectonic metamorphism coeval with crustal thickening due to
were chosen in subduction or collision settings such as               nappe stacking and the later thermal overprint related to a
Sanbagawa Belt in Japan (Kouketsu et al., 2014) and the               magmatic event.
Glarus Alps in Switzerland (Lahfid et al., 2010), providing                The present study aims to decipher the thermal evolution
examples of metamorphic gradients. Therefore, in these cases,         recorded in a cold foreland domain of a collisional orogen
the thermal imprint on the rocks is related to burial then            overprinted by a hot metamorphic dome (e.g. Gèze, 1949;
exhumation within a subduction zone or a collision belt, i.e. the     Schuiling, 1960; Demange, 1982; Echtler and Malavieille,
thermal event lasts for at least one or several million years.        1990; Soula et al., 2001; Alabouvette et al., 2003; Franke et al.,
Heating by a magmatic intrusion is potentially much shorter-          2011). The study area is located in the southern outer zone of
lived and the inter-compatibility of the different geother-           the Variscan belt, in the Montagne Noire of the French Massif
mometers in such a case is not guaranteed (Velde and Lanson,          Central (Fig. 1). The bulk paleotemperature field is derived
1993).                                                                from 72 RSCM measurements of graphite crystallinity on

                                                              Page 2 of 24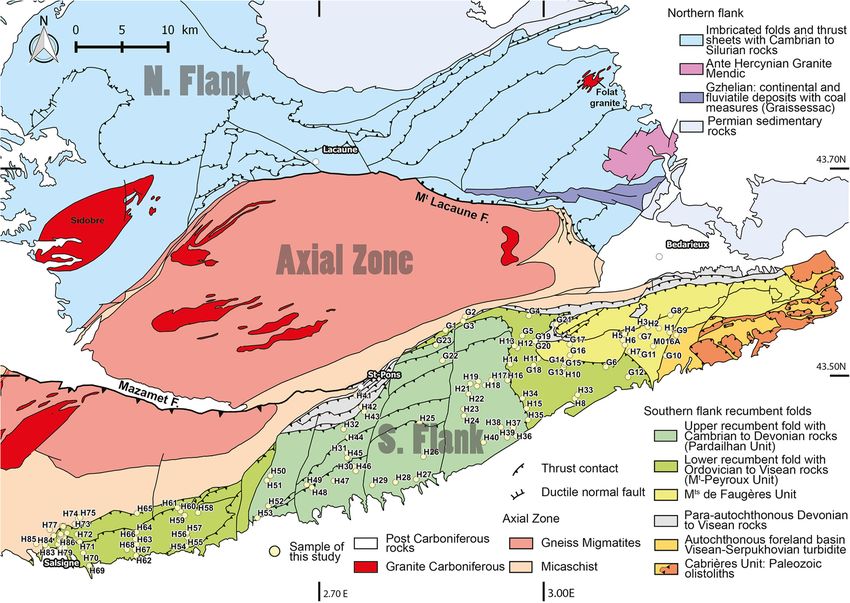
C. Montmartin et al.: BSGF 2021, 192, 3
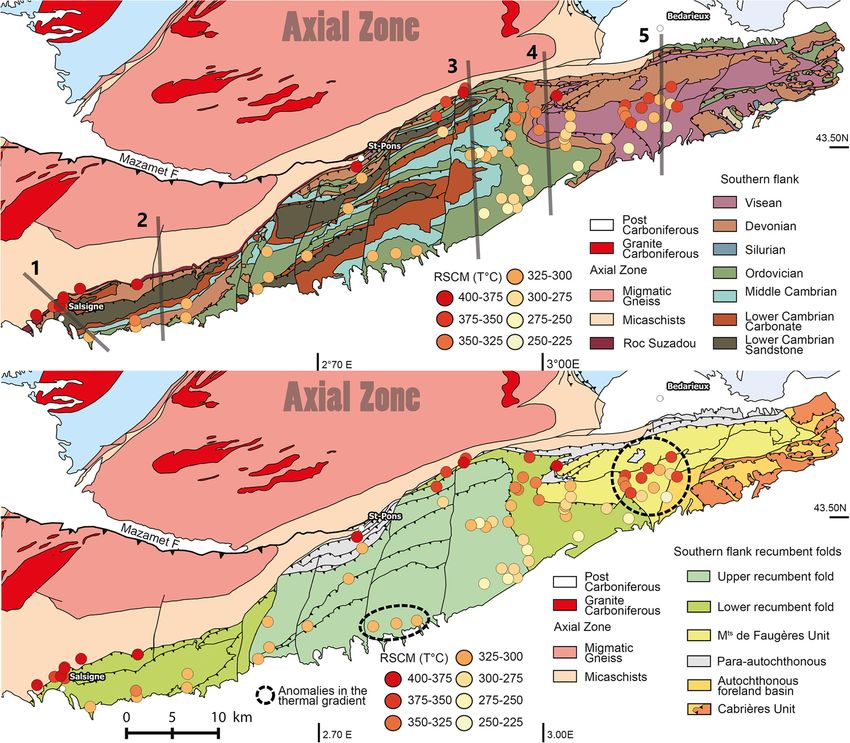
Fig. 1. Variscan massifs map with location of the Visean-Serpukhovian migmatites. The red rectangle represents the study area (modified from
Faure et al., 2010).
Page 3 of 24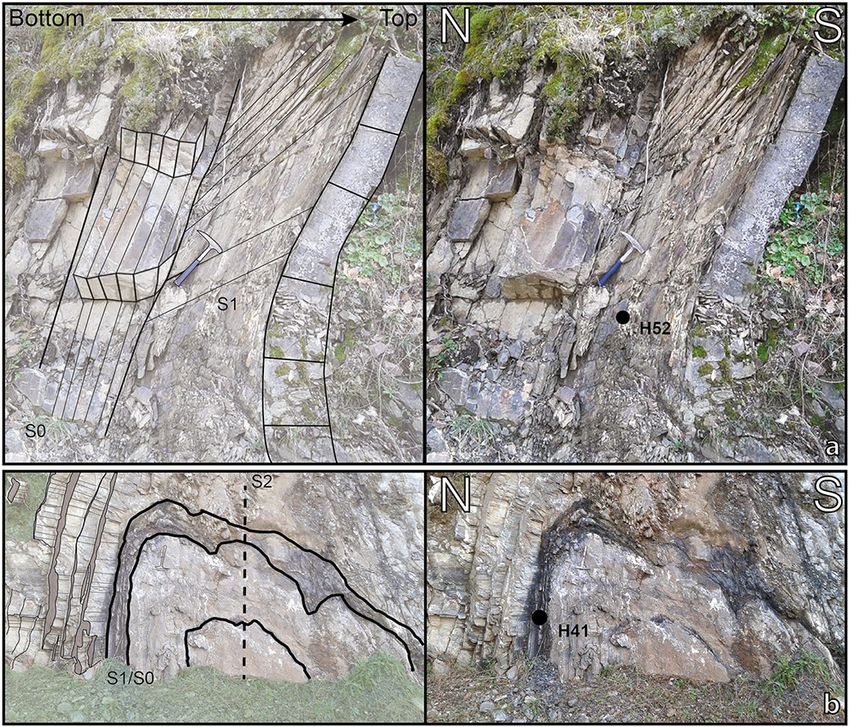
C. Montmartin et al.: BSGF 2021, 192, 3

Fig. 2. Simplified structural map of the Montagne Noire showing the granite-migmatite dome of the Axial Zone, and the sedimentary northern
and southern flanks (modified from Gèze, 1949; Arthaud, 1970; Faure et al., 2010). The recumbent folding in the south area is coeval with the
sedimentation in the Visean-Serpukhovian basin. The stratigraphy presents a reverse order in most part of these series. The figure was made from
the vectorised map 250 000 of Montpellier by the BRGM (Berger et al., 2001).

weakly deformed silts and pelites from Paleozoic formations              Middle to Late Carboniferous migmatites and granites are
that constitute the southern Variscan fold-and-thrust belt of the        widespread in the Massif Central (Fig. 1).
Massif Central. These new results are discussed in the tectonic
framework of this segment of the Variscan orogen.
                                                                         3 The outer Variscan domain in the
2 Geological background                                                  Montagne Noire
                                                                         3.1 General structure
    The Variscan belt develops from South Spain to Poland.
The French Massif Central is a stack of nappes formed through                The Montagne Noire is subdivided into southern and
a long and complex polyorogenic evolution (for details see               northern flanks separated by the Axial Zone (e.g. Gèze, 1949;
Faure et al., 2005, 2009, 2017). The SE part of the Massif               Arthaud, 1970; Fig. 2). The former two zones consist of
exposes a succession of thrusts and nappes formed from Visean            Cambrian, Ordovician, Devonian and Carboniferous sedimen-
to Bashkirian during the late collisional intracontinental               tary rocks folded and thrust to the south from the Visean to the
evolution (the D3 event of Faure et al., 2009). In the Montagne          Serpukhovian. The Axial Zone is a granite-migmatite dome
Noire area, the southernmost part of Massif Central, weakly              emplaced within the folded series. Paleozoic formations are
metamorphosed sedimentary series develop in a southeast-                 well exposed in the Montagne Noire southern flank (Fig. 3).
verging fold-and-thrust belt (Fig. 1). There, kilometre-scale            Detailed lithological descriptions are available in Gèze (1949);
recumbent folds affect the entire sedimentary series, including          Feist and Galtier (1985); Álvaro et al. (1998); Vizcaïno and
the Visean-Serpukhovian flysch. Over the whole belt, the                  Álvaro (2001) and Alabouvette et al. (2003). The Visean-
crustal thickening resulting from the successive emplacement             Serpukhovian series, well exposed on the southern flank,
from North to South of large-scale nappes (UGU, LGU, PAU),               consists of syn-tectonic gravity flow deposits such as
was followed by pervasive melting affecting the tectonic pile.           greywacke turbidites and olistostromes, which recycle

                                                                Page 4 of 24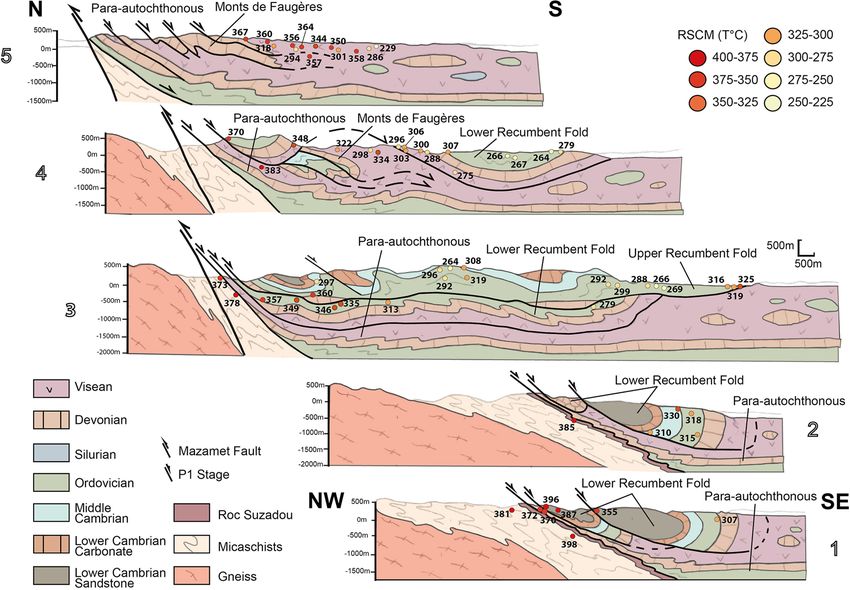
C. Montmartin et al.: BSGF 2021, 192, 3

Fig. 3. Paleozoic stratigraphic log, with the abundance in organic matter shown on the left column (modified from Arthaud, 1970; Engel et al.,
1980-1981; Álvaro and Vizcaïno, 1998; and Vizcaïno and Álvaro, 2001).

                                                               Page 5 of 24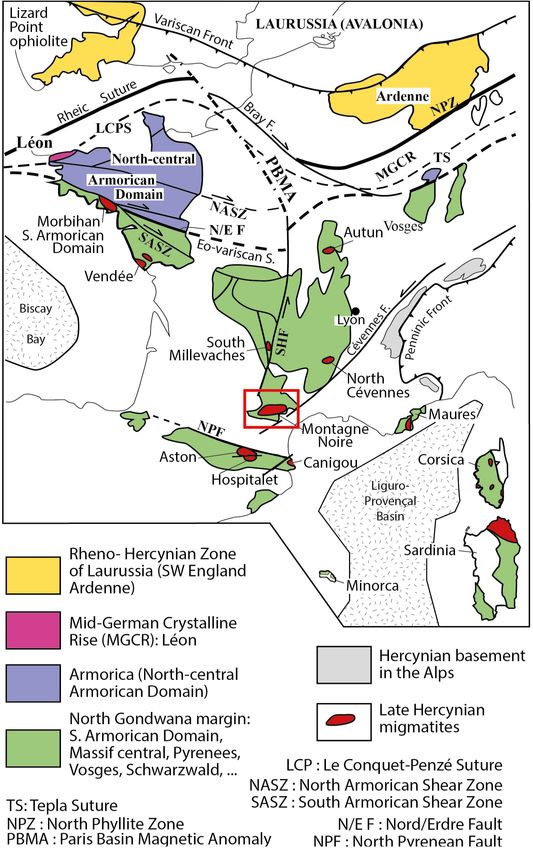
C. Montmartin et al.: BSGF 2021, 192, 3

pre-Visean sedimentary rocks of the advancing nappe pile           recumbent fold and the Axial Zone metamorphic rocks. Close
(Engel et al., 1978, 1980-1981; Feist and Galtier, 1985; Poty      to the Axial Zone, for instance near Saint-Pons (Fig. 2), the
et al., 2002; Vachard and Aretz, 2004; Cózar et al., 2017;         Para-autochthonous unit consists of Devonian marbles and
Vachard et al., 2017). During the Carboniferous, the               micaschists (Engel et al., 1980-1981; Feist and Galtier, 1985;
progressive deepening of the sedimentary basin argues for a        Poty et al., 2002; Vachard and Aretz, 2004; Cózar et al., 2017;
foreland trough, filled by syntectonic deposits, and coeval with    Vachard et al., 2017).
the formation of recumbent folds. The entire Paleozoic series          The autochthonous turbiditic basin represents the foreland
has been deformed into several km-scale, southeast-verging,        basin into which the Mt-Peyroux and Mts-de-Faugères
thrust sheets and recumbent folds (Arthaud 1970; Echtler and       recumbent folds were emplaced. The basin substratum is
Malavieille, 1990).                                                unknown but might probably be similar to that observed in the
                                                                   northern para-autochthonous unit. To the west, the basin
                                                                   underlies the stack of recumbent folds, and to the south, it is
3.2 Tectonic subdivisions                                          hidden below the Cenozoic formations.
3.2.1 The Southern Flank
                                                                   3.2.2 The Axial Zone
    The upper recumbent fold, or Pardailhan unit, is the highest
tectonic unit of the southern flank of the Montagne Noire. It is        The Axial Zone is composed of orthogneiss, paragneiss,
composed of Cambrian to Devonian sedimentary rocks with an         amphibolite, micaschist, and rare marble that experienced a
inverted stratigraphic order, i.e. the geometrically upper part    partial melting giving rise to migmatites and granites. The
consists of Early Cambrian sandstone, and the lower part is        Axial Zone presents a dome architecture of about 90 km long,
formed by Devonian limestone boudins that delimit the basal        and 20 km wide, with a N70E long axis (Gèze, 1949; Faure and
shear zone separating the upper recumbent fold from the lower      Cottereau, 1988; Echtler and Malavieille, 1990; Matte et al.,
one. From north to south, perpendicularly to the fold axes, the    1998; Van Den Driessche and Brun, 1992; Demange, 1993;
inverted limb of the Pardailhan recumbent fold develops along      Alabouvette et al., 2003). The Eocene Pyrenean Mazamet fault
12 km. These inverted sedimentary series are subdivided into       divides the western part of the dome in two parts, the Agout
three km-scale recumbent anticlines overturned to the south        and Nore massifs in the North and South, respectively. The
(Gèze, 1949; Arthaud, 1970; Alabouvette et al., 1982, 2003).       orthogneiss yields zircon U-Pb Ordovician to Devonian ages at
    Structurally below the upper recumbent fold, the lower         472 ± 2.8 Ma, 456 ± 3 Ma, 450 ± 6 Ma, 455 ± 2 Ma, and
one, also named Mt-Peyroux unit, can be observed both in the       416 ± 5 Ma interpreted as those of the granite protolith (Roger
eastern and western sides of the upper recumbent fold (Fig. 2).    et al., 2004; Cocherie et al., 2005; Franke et al., 2011; Pitra
The western part of the lower recumbent fold is called the         et al., 2012; Trap et al., 2017). The country rocks protoliths of
Minervois unit. The highest part of this recumbent fold is         these orthogneiss are interpreted as Neoproterozoic to
occupied by Ordovician flysch while Visean turbidites crop out      Cambrian or Ordovician (Alabouvette et al., 2003). Several
in the lower part, indicating a stratigraphic inversion. NE-SW     geochronological ages on the migmatite and anatectic granites
upright antiforms and synforms deform the inverted series of       range between 333 Ma and 294 Ma (Hamet and Allègre, 1976;
the entire nappe stack. The poorly exposed contact between the     Faure et al., 2010; Franke et al., 2011; Poilvet et al., 2011;
lower recumbent fold and the foreland basin led to                 Roger et al., 2015; Trap et al., 2017) with pegmatite until
controversial interpretations. According to Arthaud (1970),        282 Ma (Doublier et al., 2015). The abundance of granitoids
and Alabouvette et al. (1982, 2003) the inverted limb is in        and migmatite argue for a widespread thermal event. The Axial
contact with Visean-Serpukhovian turbidites. However,              Zone experienced two metamorphic and tectonic events. The
according to (Engel et al., 1978, 1980-1981), the flysch            early one is recorded only in rare mafic eclogitic restites
sequence is part of the lower recumbent (Mt. Peyroux) fold.        enclosed in the migmatite. Though zircon in eclogite yields a
The normal and inverted limbs of that fold nappe are connected     ca. 315 Ma age (Faure et al., 2014; Whitney et al., 2015), this
by a D1 fold hinge. Whatever the structural interpretation, this   can hardly be interpreted as the age of the high pressure event
does not change the RSCM results presented below, and their        since the enclosing migmatite yields ages older than the
interpretations. The presence of Paleozoic olistoliths in the      eclogite blocks. A hydrothermal event might be responsible for
Visean-Serpukhovian turbidites basin in which the recumbent        zircon recrystallization. The second, and main one is coeval
folds are emplaced documents the syn-sedimentary character         with the dome formation (Schuiling, 1960; Bard and
of this event. It provides an important time constraint for the    Rambeloson, 1973; Thompson and Bard, 1982; Soula et al.,
tectonic evolution of the southern flank: the nappe thrusting is    2001; Faure et al., 2014; Fréville et al., 2016; Trap et al.,
contemporary or older than 318 Ma (Engel et al., 1978,             2017).
1980-1981; Alabouvette et al., 1982, 2003; Vachard et al.,             The metasedimentary rocks that form the outer envelope of
2017).                                                             the granite-migmatite dome underwent a pervasive high
    Below the eastern part of the lower (Mt Peyroux)               temperature/medium pressure (HT/MP) metamorphism coeval
recumbent fold, characterized by overturned Ordovician to          with the dome formation (Soula et al., 2001; Faure et al., 2014;
Early Carboniferous series, the Mts de Faugères unit consists      Fréville et al., 2016). From South to North, chlorite, biotite,
of Devonian and Early Carboniferous sedimentary rocks              garnet, andalousite, staurolite, and sillimanite isograds appear
deformed by southeast-verging recumbent folds. The Para-           successively. As already pointed out, chlorite, biotite, and
autochthon unit is composed of Devonian to Middle                  muscovite belonging to the low temperature part of the HT/MP
Carboniferous sedimentary rocks exposed in the normal              metamorphism develops in the various lithotectonic units close
stratigraphic order. This domain is observed between the lower     to the Axial Zone, such as the para-autochthonous, Mts-de-

                                                           Page 6 of 24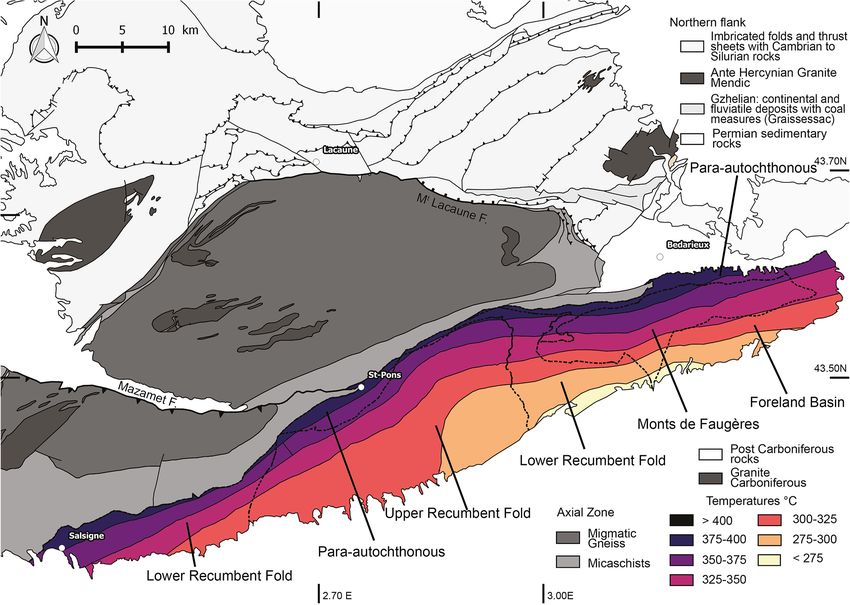
C. Montmartin et al.: BSGF 2021, 192, 3

Faugères, Mt-Peyroux and Pardailhan units (Arthaud, 1970;
Franke et al., 2011; Fréville et al., 2016). The Axial Zone HT/
MP metamorphism started after the emplacement of the thrusts
and recumbent folds but continued still afterwards into the
Permian (Alabouvette et al., 2003; Franke et al., 2011; Pitra
et al., 2012).

3.2.3 The Northern Flank
    The Montagne Noire northern flank is composed of Late
Neoproterozoic (Ediacaran) to Silurian sedimentary forma-
tions subdivided into several south-directed folds and thrusts
considered as equivalent to those of the southern flank. The
deformation age is estimated of Visean age (342–333 Ma;
Gèze, 1949; Alabouvette et al., 2003; Doublier et al., 2006).
The southern part of the northern flank, east and SW of the
Lacaune fault (Fig. 2), exposes biotite, garnet, andalousite
micaschists comparable to the metapelites of the southern
envelope of the Axial Zone (Demange, 1982). This metamor-
phism that superimposes to the fold-and thrust structure was
coeval with the HT/MP event related to the Axial Zone doming
(Doublier et al., 2006). The contact between the northern flank     Fig. 4. Pictures showing the two main deformation phases in the
and Axial Zone is the Mts-de-Lacaune NE-dipping ductile            Montagne Noire southern flank. (a). Steep inverted limb of a S-
normal fault that accommodated the dome emplacement (Van           verging fold coeval with the formation of the km-scale recumbent
Den Driessche and Brun, 1989). Furthermore, a brittle normal       folds (F1), near Ferrals-les-Montagnes. Sample H52 was picked up
fault controlled the opening of the Late Carboniferous             for RSCM study. (b). Upright fold with axial planar cleavage (S2)
(Gzhelian) Graissessac coal basin. In the following, the           coeval with the Axial Zone doming (F2) and location of the sample
northern flank will not be considered.                              H41, close to St-Pons. The folded layers are S0-S1 surface where (S1)
                                                                   is coeval with recumbent folding (F1).

3.3 The tectonic outline of the southern flank                      recognized north of this point (close to sample H11 – Fig. 2).
                                                                   However, Franke et al. (2011) interpreted this lineation as an
    The structural analysis of the Montagne Noire southern         extension direction linked to the pull apart emplacement of the
flank revealed two main tectonic events (Arthaud, 1970). The        Axial Zone. Anyhow, these metamorphic and structural
first deformation stage corresponds to the emplacement of the       features argue for a syntectonic metamorphism linked to the
south verging recumbent folds (F1) and thrusts. The bedding        doming (Soula et al., 2001; Franke et al., 2011).
and cleavage relationships demonstrate the south to southeast-
ward vergence of the F1 folds (Arthaud, 1970; Fig. 4a). A
recent study proposes a nappe thrusting towards the northeast
                                                                   4 The RSCM method
(Chardon et al., 2020). Whatever the tectonic interpretation, in
spite of 15 km of subhorizontal displacement, and the ca               The Raman Spectroscopy of Carbonaceous Material
1.5 km overload due to the stratigraphic inversion, the            (RSCM) method was carried out to estimate the paleotempera-
Paleozoic series poorly exhibit a ductile syn-metamorphic          ture field of the low grade, weakly deformed, sedimentary
deformation. A slaty cleavage is only visible in the hinges of     rocks of the southern flank of the Montagne Noire. The method
F1 folds (Arthaud, 1970). The metamorphic grade reached by         is based on the irreversible transformation of carbonaceous
the upside down Paleozoic series in the Upper (Pardailhan) and     matter towards graphite structure, using empirical correlations
Lower (Mt-Peyroux) recumbent folds is below the biotite            to correlate Raman spectra of carbonaceous matter into
grade, which firstly appear near the dome, in the para-             maximum temperature of heating, in the range 200–650 °C
autochthonous unit.                                                (Beyssac et al., 2002, Lahfid et al., 2010).
    The second deformation event is an upright folding phase
(F2). Field observations document the refolding of the F1          4.1 Analytical settings
recumbent folds by the F2 upright ones with NE-SW striking
axes (Arthaud, 1970; Alabouvette et al., 2003). Close to the           The Raman measurements were carried out on a Renishaw
Axial Zone, a subvertical axial planar cleavage develops in the    inVia reflex system belonging to the ISTO-BRGM analytic
F2 folds, whereas away from the Axial Zone dome, the F2            platform. The Wire 3.4 software was used for the data
folds are rather open and devoid of cleavage (Fig. 4b). The F2     acquisition. The argon-ion laser source excitation of 514.5 nm
upright folding corresponds to a NW-SE shortening that             was set at a power of about 5% of its capacity (2.5 mW). The
formed large- scale antiforms and synforms including the           monochromatic ray was coupled to a reflection microscope
Axial Zone dome. A N70 mineral and crenulation lineation           with an x100 objective. Before each series of measurement, the
appears in the Carboniferous formation at about 5 km south of      spectrometer was calibrated using an internal silica standard
the dome and northward (Harris et al., 1983). Sericite is also     for the wavenumber (520.4 cm1) and the signal intensity

                                                           Page 7 of 24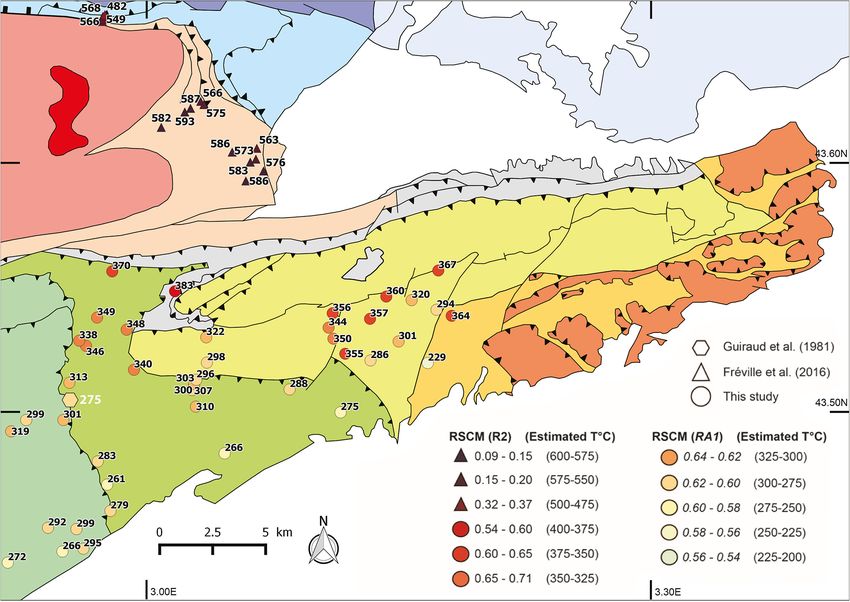
C. Montmartin et al.: BSGF 2021, 192, 3

                                                                   valid between 200 °C and 320 °C, with an accuracy of ± 30 °C
                                                                   (Fig. 5a):
                                                                       T°C ¼ RA10:3758
                                                                               0:0008   with RA1 ¼ D1þD2þD3þD4þG
                                                                                                       D1þD4
                                                                                                                 :

                                                                      Samples with higher crystallinity have fewer Raman peaks
                                                                   and were processed accordingly using the method proposed by
                                                                   Beyssac et al. (2002) that allows an estimation of temperature
                                                                   in the range between 330 up to 650 °C, with a ± 50 °C
                                                                   uncertainties (Fig. 5b):
                                                                       T ° C = ( 445 * R2 þ 641) with R2 ¼ D1þD2þG
                                                                                                               D1
                                                                                                                    :
                                                                       Considering the low metamorphic grade of the analysed
                                                                   samples, only the low range of this method was used (< 400 °C).
                                                                   Since the Beyssac et al. (2002) and Lahfid et al. (2010) methods
                                                                   do not exactly overlap with each another; we also used a third
                                                                   thermometer (Kouketsu et al., 2014). This method does not
                                                                   correspond to peaks area ratios but focuses on the peak full width
                                                                   at half maximal (FWHM) of the D1 and D2 band. Because of the
                                                                   difficulty to distinguish the D2 band from the G band, only the
                                                                   formula about the former band was retained. According to this
                                                                   method, the temperature is derived from Raman peaks as:
                                                                              T°C ¼ 2:15  ðFW HM  D1Þ þ 478:
Fig. 5. Peakfitting of samples H52 (a), and H75 (b) by low
temperature (Lahfid et al., 2010) and high temperature method          The Kouketsu et al. (2014) method leads to temperatures
(Beyssac et al., 2002), respectively.                              comprised between 150 and 400 °C with a ± 30 °C uncertainty.

(at least 30 000 counts per second). Fifteen carbonaceous          4.3 Uncertainty in RSCM temperatures
matter spectra were systematically acquired for each sample
within the thin section in order to obtain a representative and        The different RSCM methods are calibrated against several
reliable temperature. Only organic particles located below         geothermometers. The higher range temperatures method
transparent quartz, a few mm under the thin section surface,       proposed by Beyssac et al. (2002) is mostly based on mineral
were analysed, to avoid any mechanical damaging of their           assemblages. However, vitrinite reflectance, illite crystallinity,
crystalline structure due to thin section preparation and          chlorite geothermometers were compared with RSCM spectra
polishing. The acquisition duration was set to at least 60 s and   both in Kouketsu et al. (2014) and Lahfid et al. (2010) studies.
adapted depending on the quality of the spectrum.                  Furthermore, thermal modelling, garnet-chlorite geothermom-
                                                                   eters were also used for calibration in Kouketsu et al. (2014)
                                                                   while Lahfid et al. (2010) used calcite-dolomite thermometry,
4.2 RSCM data processing                                           quartz-chlorite isotopic thermometry and fluid inclusion.
                                                                   These calibrations were carried out on domains that were
    Several empirical calibrations were proposed to correlate      affected by a single metamorphic event.
the carbonaceous matter Raman spectra to temperature                   The maximum error (1s) on R2 ratio obtained by Beyssac
(Beyssac et al., 2002; Rahl et al., 2005; Aoya et al., 2010;       et al. (2002) is ± 0.08 corresponding to a ± 36 °C intra-sample
Lahfid et al., 2010; Kouketsu et al., 2014). Carbonaceous           variability. Adding the uncertainty linked to the calibration of
matter presents characteristic Raman bands in the wavenumber       RSCM with reference temperatures, the authors considered
range between 1100–1800 cm1 and 2500–3100 cm1. The               that the uncertainty on the estimation of temperature was
first order region of the carbonaceous matter spectrum for          about ± 50 °C.
1100–1800 cm1 provided the data of this study.                        In the low temperature range, Lahfid et al. (2010) method
    Depending on its crystallinity (hence on the temperature       uses the ratio of Raman peak spectra area, while Kouketsu
experienced), carbonaceous matter presents a variable number       et al. (2014) method uses the width of the peaks, to derive the
of Raman peaks, which can be used to discriminate between          paleotemperature. Kouketsu et al. (2014) estimated that the
the different calibration methods. Since the sedimentary rocks     difference in estimated temperature due to the use of the two
of the Montagne Noire southern flank are weakly to un-              different methods is of the order of 50 °C.
metamorphosed, most of the Raman spectra were processed
with the Lahfid et al. (2010) method. Accordingly, each             4.4 RSCM acquisition
spectrum was decomposed into five bands (Lorentzian
functions), with a well-constrained position: G (1590 cm1)            The temperatures derived from the RSCM method were
D1 (1350 cm1), D2 (1620 cm1), D3 (1515 cm1) and D4              obtained with a minimum of 10 to 15 spectra for each sample in
(1250 cm1) (Lahfid et al., 2010; Sadezky et al., 2005). From       order to ensure their validity. Some of the grains of
this decomposition, the RSCM temperature was computed              carbonaceous matter present within a sediment might originate
using the formula proposed by Lahfid et al. (2010) which is         from the erosion of a sediment that has already been affected

                                                           Page 8 of 24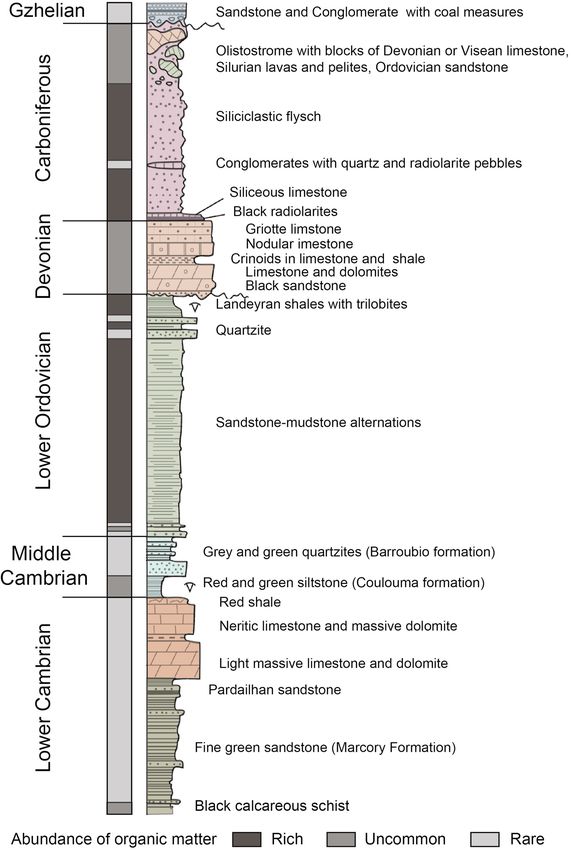
C. Montmartin et al.: BSGF 2021, 192, 3

                                                                           On the contrary, the Early Cambrian Marcory green sandstone,
                                                                           and the Early Cambrian and Devonian carbonates did not yield
                                                                           sufficient organic matter (Figs. 6c and 6e), and thus, were
                                                                           avoided for sampling.

                                                                           4.5 Sampling strategy

                                                                                The main goal of the present study was to establish the
                                                                           paleotemperature field associated with the regional tectonic-
                                                                           metamorphic events. Several hypotheses may be formulated.
                                                                                The temperature development was coeval with the
                                                                           recumbent folding and thrusting event for this purpose,
                                                                           samples were collected in each structural unit except for the
                                                                           South Minervois and Mts-de-Faugères units. Higher temper-
                                                                           atures can be expected at deeper tectonic levels. Furthermore,
                                                                           areas distant from the Axial Zone dome where the metamor-
                                                                           phic and structural imprint of the Axial Zone dome upon the
                                                                           recumbent folds seems absent (Doublier et al., 2006) represent
                                                                           attractive sites. For instance, in the Ordovician sandstone-
                                                                           siltstone formation of the Upper (Pardailhan) recumbent fold,
                                                                           only the S1 slaty cleavage is observed (Fig. 4a).
                                                                                The thermal effect was related to the late-stage emplace-
                                                                           ment of the migmatites and plutons in the Axial Zone dome.
                                                                           The strategy to assess the dome effect, as suggested by
                                                                           Wiederer et al. (2002) and Franke et al. (2011) studies, was
                                                                           totally different. In the southern flank, upright folds coeval
Fig. 6. Thin sections observed with optical microscope in polarized        with a steep S2 cleavage (Fig. 4b) structurally represents this
non-analysed light showing the lithology diversity, (a). Mudstone in       event. The occurrence of a N70E striking mineral lineation
the Visean Turbidite (sample G8), (b). Siltstone in the Early Ordovician   marked by white mica (sericite) becomes more and more
rocks (sample G1), (c). Early Cambrian green sandstone (Marcory            difficult to recognize south of the dome. Consequently, high
formation, sample H32), (d). Mudstone in the Early Ordovician rocks        temperatures should be recorded near the dome while they
(sample G2), (e). Middle Cambrian fine-grained sandstone (sample            must decrease away from it, southwards. Nord-south sections
H22), (f). Early Ordovician mudstone (sample G3).                          were sampled in order to test this hypothesis.
                                                                                Finally, a last possibility can be considered. The axial dome
                                                                           exhumation itself results of a regional horizontal flow that
by a prior metamorphic event. Since the organic matter only                affected the entire crust. Thus, a hot crust could be located
records the highest temperature, these inherited grains might              below the nappes piles. Beside the dome thermal impact, a
yield higher conditions of temperature than their host                     high temperature event overprinting the nappe stacking can be
sediments, if they come from higher-grade material. This                   expected far from the Axial Zone.
case is often suspected when a few CM grains give much
higher temperatures than most grains in a sample. In such a                5 Results
case, we disregarded the few anomalous grains and estimated
the temperature from the statistical distribution concentrating                Despite the low-grade metamorphism of the area, both high
most of the grains (Beyssac et al., 2002).                                 and low temperature methods were used during this study. The
    The 122 samples analysed cover the major part of the                   results are well distributed in the 230 to 400 °C range covered
Montagne Noire southern flank in order to get a general picture             by both methods (Figs. 5 and 7). Seventy-two temperature
of the paleotemperature field reached by the Paleozoic series.              values were calculated in the Montagne Noire southern flank.
Almost all lithologies were tested for the RSCM analysis.                  Forty-eight RSCM spectra were processed using Lahfid et al.
Several samples were polished at 35 mm for optical micro-                  (2010) method, while twenty-five spectra were computed
scope observation (Fig. 6) but most of the measurements were               through the Beyssac et al. (2002) method (Tab. 1). Thirty-six
carried out on 200–300mm-thick thin sections. The thin                     temperatures values were also reassessed by the FWHM-D1-
sections were prepared regardless of the mineral preferred                 linked thermometer (Kouketsu et al., 2014; Tab. 2). The
orientation of the carbonaceous matter because of the poorly               results, plotted in Figure 8, reveal a decreasing of maximum
developed graphitization in these low metamorphic grade                    temperatures towards the south. It appears that the metamor-
series (Aoya et al., 2010).The RSCM method reliability                     phic zonation cuts across the boundaries between the tectonic
depends on the richness of the carbonaceous matter enclosed in             units and the limbs of recumbent folds close to the dome and a
the sample. In the field, the dark lithologies, i.e. the Early              more homogenous in further distance. In contrast to one of our
Ordovician and Visean-Serpukhovian turbidites, turned out to               working hypotheses, the RSCM temperatures do not indicate
be the most appropriate lithologies (Figs. 6a, 6b, 6d and 6f).             any thermal gap on both sides of the tectonic contacts.

                                                                   Page 9 of 24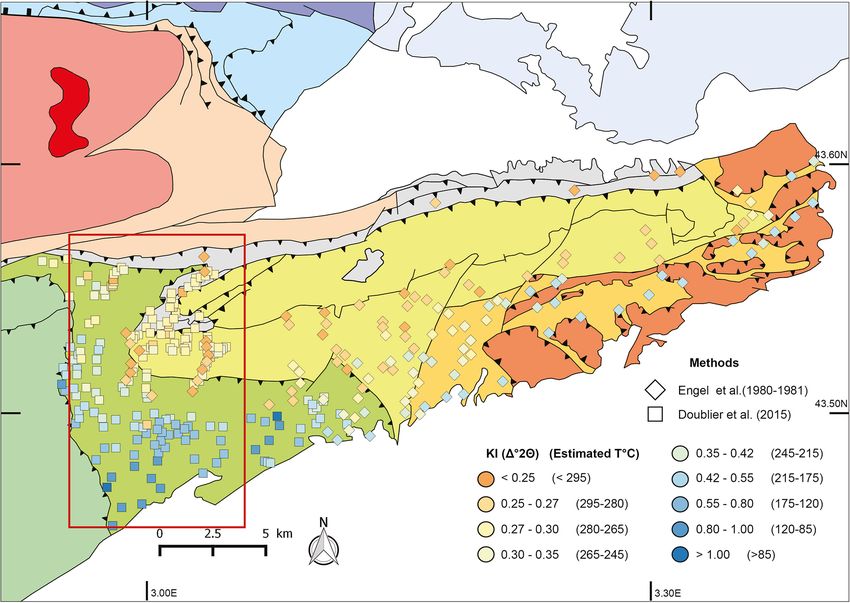
C. Montmartin et al.: BSGF 2021, 192, 3

Fig. 7. Graph showing the repartition of our data with respect to the two methods used. The right column shows the evolution of the spectra
aspect and the deconvolution chosen with D1 band (blue), D2 band (red), D3 band (yellow), D4 band (orange) and G band (green).

6 Discussion                                                           than 300 °C (Fig. 11). Since the dome foliation is plunging
                                                                       under the sedimentary series, samples horizontally away from
6.1 Temperature field acquired by RSCM method                           the dome are also vertically distant from the dome.
    In this study, the entire Montagne Noire southern flank has             In case of a thermal field predating the emplacement of the
been investigated by the RSCM method. Most of the data set             recumbent folds, a temperature discontinuity should coincide
obtained from the sedimentary rocks records a gradient                 with the contacts between different units. In case of a thermal
consistent over the whole investigated area, visible in both           event coeval with nappe thrusting and tectonic thickening, the
normal and inverted sedimentary series (Fig. 8 and 9 cross             gradient should be consistent with the structural position in the
sections 1, 2, 3, 4, 5). Globally, the temperature decreases from      tectonic pile. Indeed, it has been shown that temperatures
the southern edge of the Axial Zone dome towards the southeast         recorded in terrigenous sedimentary series deposited in
in the Paleozoic sedimentary rocks (Fig. 10). The maximum              foreland basins involved in fold-and-thrust belts of orogens
temperature is located in the micaschists series that form the         are related to tectonic thickening. For instance, in the northern
dome envelope with a value close to 400 °C. The lowest                 Variscan foreland basin of the Ardennes massif, the tempera-
temperature, about 220 °C, was obtained in the Visean turbidites.      ture of 200 to 300 °C, measured by illite crystallinity, vitrinite
In the western part of the southern flank, the gradient is less         reflectance, conodont alteration index, and fluid inclusion
apparent that in the eastern part. It decreases from 400 °C to         methods, has been linked to the burial of sedimentary series
315 °C towards the Cenozoic sedimentary rocks.                         below the Variscan thrust front (Fielitz and Mansy, 1999).
    The RSCM method was also used within the dome                          The RSCM temperature map of the Montagne Noire
micaschist envelope (Fréville et al., 2016). The measured              southern flank (Fig. 10) is clearly incompatible with these
temperatures, ranging between 450 °C and 600 °C are higher             assumptions. Since the isotherms cut across the different fold
than those obtained in the sedimentary rocks of the southern           units irrespective of their contacts, the bulk thermal structure
flank (Fig. 11). The temperature gradient is steeper in the dome        of the Montagne Noire southern flank cannot be linked to the
northern edge than in the micaschist series of the eastern area.       pre-doming thickening stage. Moreover, the RSCM tempera-
Indeed, the deformation is more intense in the dome northern           ture is not correlated with the structural position of the
edge, as also shown by the tight arrangement of the                    analyzed samples since the highest nappes of the tectonic pile
metamorphic isograds (Alabouvette et al., 1993; Fréville               record temperatures similar to those measured in the para-
et al., 2016). This is probably a consequence of a brittle             autochthonous units (Fig. 10). Thus, the link of the temperature
shearing that poste-dates the dome exhumation (Thompson                field with nappe emplacement, and tectonic burial is unlikely.
and Bard, 1982). The data set obtained via the RSCM method             The measured temperature is also not in agreement with shear
documents a continuous evolution from the dome core                    heating along major contacts, as that observed in Japan (Mori
southward with a temperature decrease from 580 °C to less              et al., 2015).

                                                              Page 10 of 24
C. Montmartin et al.: BSGF 2021, 192, 3
Table 1. Tmax results obtained by RSCM according to Beyssac et al. (2002) and Lahfid et al. (2010) methods.
Sample Longitude E Latitude N Age Unit Method RA1 or R2 T°C SD r2 N N’
G1 2.8705744 43.5442683 Ordovician LRF HT 0.648 352 11 0.991 15 15
G2 2.8965896 43.5575776 Ordovician LRF HT 0.603 373 7 0.988 13 10
G3 2.8940602 43.5535283 Ordovician LRF HT 0.592 378 8 0.998 15 15
G4 2.9825362 43.5586861 Ordovician LRF HT 0.605 371 14 0.996 16 16
G5 2.9736861 43.5390556 Ordovician LRF HT 0.655 350 8 0.992 15 15
G6 3.0860833 43.5084722 Visean LRF LT 0.610 293 24 0.993 15 15
G7 3.1330833 43.5384167 Visean FU HT 0.626 362 14 0.994 15 15
G8 3.1730278 43.5589167 Visean FU HT 0.618 366 12 0.984 12 12
G9 3.1807778 43.5396389 Visean VB HT 0.631 364 16 0.99 12 12
G10 3.1667501 43.5195833 Visean VB LT 0.558 229 17 0.994 11 11
G11 3.1333333 43.52075 Visean FU LT 0.605 287 14 0.992 15 15
G12 3.1158333 43.4986944 Visean FU LT 0.597 276 12 0.994 15 15
G13 3.0292778 43.50825 Devonian LRF LT 0.616 300 16 0.992 13 12
G14 3.0304444 43.5108889 Visean LRF LT 0.620 305 16 0.995 10 10
G15 3.0316111 43.5126111 Visean LRF LT 0.617 302 24 0.991 12 12
G16 3.0378333 43.5198889 Visean FU LT 0.621 307 22 0.994 12 12
G17 3.0374166 43.5306389 Visean FU LT 0.634 323 20 0.996 11 10
G20 2.9909722 43.5338888 Visean LRF LT 0.649 341 29 0.995 16 16
G21 3.0191944 43.5502222 Visean PA HT 0.567 388 22 0.983 15 14
G22 2.8663334 43.51475 Ordovician URF LT 0.607 299 27 0.991 15 14
G23 2.8574722 43.5298055 Ordovician URF HT 0.612 369 23 0.993 15 15
H1 3.1719473 43.5422333 Visean FU LT 0.619 304 15 0.994 15 15
H2 3.1574222 43.5463472 Visean FU LT 0.631 319 16 0.996 15 15
H3 3.1426028 43.5478777 Visean FU HT 0.629 361 8 0.989 15 15
H4 3.111275 43.540825 Visean FU HT 0.640 356 5 0.993 15 15
H5 3.1088889 43.5347195 Visean FU HT 0.665 345 9 0.992 15 15
H6 3.1116833 43.5300195 Visean FU HT 0.657 349 9 0.989 15 15
H7 3.1185889 43.5235944 Visean FU HT 0.634 359 13 0.994 15 15
H9 3.0303112 43.5103778 Visean LRF LT 0.623 309 19 0.993 15 15
H10 3.0314056 43.5011778 Ordovician LRF LT 0.622 308 13 0.995 15 15
H11 2.9952277 43.5168361 Visean LRF LT 0.649 341 24 0.992 15 14
H12 2.9672362 43.5270528 Ordovician LRF LT 0.645 337 13 0.995 15 15
H13 2.9632639 43.5292139 Ordovician LRF LT 0.648 341 25 0.988 15 15
H14 2.9575749 43.511325 Ordovician LRF LT 0.620 305 27 0.991 15 15
H15 2.9796389 43.4680027 Ordovician LRF LT 0.587 264 16 0.992 15 15
H16 2.9540445 43.4954806 Ordovician URF LT 0.616 300 24 0.992 15 13
H17 2.9323777 43.4954694 Ordovician URF LT 0.618 303 26 0.988 15 14
H18 2.9235973 43.49065 Ordovician URF LT 0.628 315 27 0.992 15 15
H19 2.9149528 43.4943194 Ordovician URF LT 0.586 262 13 0.993 15 15
H21 2.9037889 43.4920527 Mid-Cambrian URF LT 0.627 314 24 0.992 15 15
H27 2.8315083 43.3985361 Ordovician URF LT 0.629 317 25 0.992 15 14
H28 2.8038 43.3956139 Ordovician URF LT 0.636 325 25 0.992 15 14
H29 2.7726888 43.3927805 Ordovician URF LT 0.641 331 14 0.992 15 15
H33 3.04814 43.48132 Ordovician LRF LT 0.589 267 23 0.994 15 15
H34 2.97411 43.47787 Ordovician LRF LT 0.603 284 21 0.992 15 15
H35 2.98153 43.45686 Ordovician LRF LT 0.599 280 9 0.993 15 15
H36 2.96578 43.44078 Ordovician URF LT 0.607 289 20 0.993 15 15
H37 2.96172 43.44911 Ordovician URF LT 0.646 300 9 0.994 15 15
H38 2.94512 43.44965 Ordovician URF LT 0.611 294 11 0.992 15 15
H39 2.95357 43.4395899 Ordovician URF LT 0.589 266 15 0.992 10 10
H40 2.9217201 43.4348399 Ordovician URF LT 0.592 270 19 0.993 15 15
H41 2.75068 43.4804 Devonian PA HT 0.562 391 15 0.995 15 15
Page 11 of 24C. Montmartin et al.: BSGF 2021, 192, 3
Table 1. (continued).
Sample Longitude E Latitude N Age Unit Method RA1 or R2 T°C SD r2 N N’
H42 2.75775 43.46934 Ordovician PA LT 0.631 319 14 0.993 15 15
H44 2.73973 43.43944 Ordovician URF LT 0.617 302 14 0.993 15 15
H49 2.68464 43.39284 Low-Cambrian URF LT 0.635 323 9 0.995 15 15
H51 2.63116 43.39683 Mid-Cambrian URF LT 0.631 319 15 0.992 15 15
H52 2.63325 43.37185 Ordovician URF LT 0.616 301 22 0.993 15 15
H53 2.6186917 43.3603834 Ordovician URF LT 0.626 312 10 0.992 15 15
H54 2.52333 43.33182 Devonian LRF LT 0.632 320 13 0.995 15 15
H57 2.5240901 43.34533 Mid-Cambrian LRF LT 0.626 312 10 0.992 15 15
H62 2.4564 43.32259 Ordovician LRF LT 0.629 317 17 0.994 15 15
H65 2.45733 43.364 – M HT 0.571 387 13 0.996 15 15
H67 2.45521 43.32847 Mid-Cambrian LRF LT 0.642 332 18 0.994 15 15
H69 2.39389 43.31236 Ordovician LRF LT 0.623 308 9 0.994 15 15
H75 2.38119 43.35939 – M HT 0.544 399 10 0.992 15 15
H76 2.35966 43.34023 Low-Cambrian LRF HT 0.642 355 6 0.992 15 15
H81 2.34584 43.34154 – M HT 0.601 372 13 0.989 15 15
H85 2.3226 43.33332 – M HT 0.583 381 10 0.997 15 15
H91 2.3542701 43.3423599 Devonian LRF HT 0.569 388 21 0.985 15 15
H92 2.35912 43.35098 – M HT 0.601 374 27 0.976 15 13
H94 2.35903 43.34991 Devonian PA HT 0.549 397 18 0.995 15 15
M016A 3.14975 43.5287778 Visean VB LT 0.606 301 18 0.977 11 10
LT: low temperature method (Lahfid et al., 2010), HT: High temperature method (Beyssac et al., 2002). FU: Faugères Units; LRF: Lower
Recumbent Fold; URF: Upper Recumbent Fold; PA: Para-Autochthonous; M: Micaschists; VB: Visean Basin. With SD: standard deviation;
r2: fitting parameters; N: number of total spectra; N’ number of retained spectra.
In contrast, there is a clear temperature gradient decreasing not exposed. The other temperature anomaly is located in the
with the distance to the dome. Whatever the thrusting direction southern part of the Pardailhan upper recumbent fold (Fig. 9
of the nappe, southeastward (Arthaud, 1970) or northeastward cross section 3). The gradient is decreasing southward from ca
(Chardon et al., 2020), the interpretation of a thermal effect 380 °C to 270 °C, but at the very end of the exposed Paleozoic
related to the Axial Zone dome is therefore preferred to explain series, the temperature increases to reach ca 320 °C. Since this
the temperature field as suggested by previous authors area is located about 15 km away from the Axial Zone dome
(Wiederer et al., 2002; Doublier et al., 2006; Franke et al., south margin, it is unlikely that these high temperatures result
2011). At first order, the RSCM method records the HT from the direct dome thermal influence.
metamorphic event already recognized close to the Axial Zone Three hypotheses might explain these singularities.
over a very broad area including its entire southern flank. It has First, the effect of a late fault might be taken in account as it
been shown that RSCM investigations around an intrusion could reorganize the distribution of paleotemperatures. It is
provide high temperatures away from the metamorphic aureole especially noticeable for the anomaly within the upper
(e.g. Hilchie and Jamieson, 2014; Beyssac et al., 2019). recumbent fold (Pardailhan unit). The N-S striking sinistral
However, it is quite unlikely that the heat propagation away fault at the east of the points H25 an H26 Fig. 2) separates high
from the dome may develop temperatures above 300 °C as temperature in the west > 315 °C (H27-H28-H29) from lower
those observed south of St-Pons at ca 10 km in the temperatures in the east < 290 °C (H36-H39-H40; Figs. 8 and 9).
southernmost part of the upper recumbent fold. We suggest This effect is also shown by the bending of the 300 °C
that the temperature field is linked with an hypothetic hot crust isotherm (Fig. 10).
below the recumbent folds. Second, the circulation of fluids, related to the nappes
thickening or the doming may be considered. Several quartz
6.2 Anomalies in the temperature field veins, developed during these circulations, appear within the
basin and close to the tectonic contacts (Guiraud et al., 1981)
Two temperature anomalies are visible within the N-S or are linked with the micaschist/sedimentary rocks contact as
temperature gradient (Fig. 8). To the east of the study area, observed in Salsigne (Lescuyer et al., 1973).
within the Visean-Serpukhovian turbiditic basin, several Finally, at the regional scale, the district is riddled by Late
samples present relatively high temperatures around 360 °C, Carboniferous granitic intrusions, such as the Sidobre or Folat
similar to those found near the dome micaschists (Figs. 6 and 9 plutons (Fig. 2), thus the presence of a hidden pluton below the
cross section 5). However, in this area, the Axial Zone dome is sedimentary rocks cannot be discarded. Granitic plutons
Page 12 of 24C. Montmartin et al.: BSGF 2021, 192, 3
Fig. 8. Geological map of the Montagne Noire with the Tmax measured in the southern flank. Totally, 72 samples from the recumbent folds and
turbiditic basin have been analysed by the RSCM method in the present study.
emplaced in an orogen external zone and in gneissic domes 6.3 Comparison of the RSCM results with other
have been already documented in the Nappe and External thermometers
zones of Sardinia (Carmignani et al., 1994; Carosi et al., 6.3.1 General pattern of the temperature field
1998) and more recently by RSCM investigation in Morocco
(Delchini et al., 2016). Thus, the existence of several hidden The illite crystallinity has been widely studied in the
gneiss-granite-migmatite massifs underlying the southern eastern part of the Montagne Noire southern flank to unravel
flank stack of recumbent folds and the turbiditic basin must be low-grade metamorphic gradients. In our study area, two
considered. Moreover, a pegmatite dyke, 2 km north of the previous works (Engel et al., 1980-1981; Doublier et al., 2015)
anomaly in the basin, dated at 282 Ma (Doublier et al., 2015), documented a north to south decreasing thermal gradient
could be the witness of one of these intrusions. This (Fig. 12). The latter study used the Árkai index (Árkai, 1991;
hypothesis is closely related with the presence of a hot crust Guggenheim et al., 2002) and the Kübler index (Kübler, 1964)
which can explain the isotherm pattern in the easternmost part to estimate a relative indicator of temperature. Furthermore,
of the southern flank, more than 15 km away from the dome Wiederer et al. (2002) compared the results obtained via the
(Fig. 10). Weber index (Weber 1972) in Engel et al. (1980-1981) to the
Page 13 of 24C. Montmartin et al.: BSGF 2021, 192, 3
Table 2. Tmax results obtained by RSCM according to Kouketsu et al. (2014) method.
Sample P D1 FWHM D1 T °C SD r2 N’
H1 1344 94 275 19 0.998 15
H2 1352 55 360 8 0.998 15
H3 1352 51 367 5 0.995 15
H4 1354 49 373 7 0.994 15
H5 1351 53 365 11 0.995 15
H6 1351 52 367 9 0.996 15
H7 1352 55 360 15 0.998 15
H9 1345 85 296 12 0.997 15
H10 1342 96 272 7 0.999 15
H11 1350 68 332 18 0.994 15
H12 1350 75 318 10 0.998 15
H13 1347 74 319 8 0.998 15
H14 1345 99 265 22 0.998 14
H15 1344 104 255 14 0.995 15
H33 1345 107 248 14 0.998 15
H34 1342 99 265 13 0.997 15
H35 1346 107 248 8 0.998 15
G2 1354 47 377 8 0.987 13
G3 1354 42 389 3 0.998 15
G4 1355 45 380 2 0.997 16
G5 1352 61 347 7 0.996 15
G6 1344 83 300 20 0.998 15
G7 1351 53 364 7 0.997 15
G8 1353 46 379 8 0.996 12
G9 1353 52 367 12 0.997 12
G10 1348 106 249 8 0.998 11
G11 1345 89 286 19 0.998 15
G12 1348 95 291 11 0.994 10
G13 1347 77 312 17 0.996 15
G14 1348 71 325 16 0.999 10
G15 1349 70 327 12 0.998 12
G16 1350 67 333 13 0.998 12
G17 1352 59 352 14 0.998 11
G20 1352 59 351 13 0.997 16
G21 1353 50 371 12 0.994 15
MO16 1343 80 305 11 0.999 11
P_D1: stands for the band position (cm1); FWHM: Full Width at Half Maximum (cm1); SD: standard deviation; r2: fitting parameters; N’:
number of retained spectra.
diagenetic domains defined in Frey and Robinson, (1999). In A fluid inclusion study of quartz veins (see location on
agreement with our own results, these works show the same Fig. 11) has been carried out (Guiraud et al., 1981). The
N-S variations as those documented by the RSCM method. analyzed rocks lie along the basal tectonic contact of the
In the same area, the conodont color alteration has been Pardailhan upper recumbent fold, called “queue de cochon”
used to estimate the paleotemperature repartition (Wiederer (pig tail) contact (Gèze, 1949) composed of Devonian
et al., 2002). The method is based on the color of apatite limestone boudins surrounded by Ordovician sandstone and
crystals that form the conodonts (Epstein et al., 1977). During pelite. These 1- to 10-cm sized quartz lenses were inferred to
a metamorphic event, the crystallinity of organic matter be related to fluid circulation coeval with the emplacement of
trapped within the apatite grains increases, allowing a possible the upper recumbent fold (Guiraud et al., 1981). Analyses
correlation with the metamorphic grade experienced by the show a temperature around 275 ± 25 °C, which is in agreement
fossil. As shown in Figure 13, the dome thermal effect is also with our results at ca 300 °C, but higher than those provided by
visible by this method. The intensity of the metamorphism is illite crystallinity at 200 °C (Doublier et al., 2015). This 300 °C
globally higher to the northwest and decreases away to the temperature has been related to the thickening event (Guiraud
southeast (Fig. 13). et al., 1981), however, fluid circulation might have occurred
Page 14 of 24C. Montmartin et al.: BSGF 2021, 192, 3
Fig. 9. Projections of the analyzed samples on five cross sections (located in Fig. 8) of the southern flank of the Montagne Noire. Temperatures
are globally increasing toward the Axial Zone dome.
also during the doming. The tectonic contact between the Montagne Noire, and despite qualitatively convergent trends
upper and lower recumbent folds has been reworked during indicating a north-south gradient from the Axial Zone dome to
doming, as indicated by E-W striking slickenlines on flat lying the sedimentary southern flank, the measured temperatures
surfaces, and N70E striking fibers infilling tension gashes vary significantly, depending on the method considered.
(Arthaud, 1970; Sauniac, 1980; Harris et al., 1983). Therefore, As example of these differences, the temperature range
the deformation observed along the contact suggests that the ca estimated using the conodont approach is the widest, with
300 °C temperature might be related to the Axial Zone dome temperatures comprised between 75 °C and 475 °C against
thermal effect or even to a late event as documented by Aerden 85 °C to 300 °C for IC and 230 °C to 400 °C for RSCM.
(1998) and Franke et al. (2011). Furthermore, for a given location, the results are sometimes
different between the two illite crystallinity studies by Engel
et al. (1980-1981) and Doublier et al. (2015). This is
6.3.2 Discrepancy in the low T range between RSCM
remarkable at the contact between the lower recumbent fold
temperature and other thermometers
and the Visean basin where the data from Engel et al.
For the sake of comparison between the different (1980-1981) are 50 °C higher than those from Doublier et al.
geothermometers, both conodont color alteration index and (2015). It can be explained by the use of a standardized and
illite crystallinity data were converted in temperatures using to more precise procedure in the study of Doublier et al. (2015)
the tables provided by Merriman and Frey (1999) and while Engel et al. (1980-1981) employed an early version of
Wiederer et al. (2002) for low grade metamorphism and the the method known to have interlaboratory standardization
equation (1) from Zhu et al. (2016) work. Several studies have issues (Merriman and Peacor, 1999). Comparing with RSCM
shown a good correlation between illite crystallinity (IC, result, other geothermometers provide temperature lower by at
estimated from Kübler Index, KI) and organic geothermo- least 70 °C. Baludikay et al. (2018) reported a general
meters such as vitrinite reflectance (VR) (Underwood et al., overestimation of RSCM temperatures (using Kouketsu et al.,
1993; Mukoyoshi et al., 2009; Fukuchi et al., 2014). This is 2014 calibration) with respect to other geothermometer in low-
true in basinal settings (Baludikay et al., 2018) but also in grade sediments (T < 200 °C) from intra-cratonic basins. The
collision/subduction settings (Rahn et al., 1995). In the discrepancy is here much higher, as illite crystallinity data
Page 15 of 24C. Montmartin et al.: BSGF 2021, 192, 3
Fig. 10. Temperature map determined by the RSCM Tmax results of this study. The isotherms crosscut the tectonic units of the southern flank.
Roughly, the temperature decreases from the NW to the SE away from the Axial Zone dome. The isotherms cut the micaschists between Salsigne
and St-Pons because of a lack of data.
from Doublier et al. (2015) and RSCM data from this study dome. In this distance range, the gap between RSCM
show a difference up to 175 °C (Fig. 14). A first possible source temperatures and illite crystallinity temperatures increases
of these differences lies in the large uncertainty in the with the distance to the dome (Fig. 14). This divergence is
conversion of any of the metamorphic/organic indicators into apparently irrespective of the RSCM calibration used
temperatures. A second source of error is related to the (Figs. 15a and 15b) or the calibration to convert KI in
complex geological history of the domain treated here, temperature (T):
involving several tectonic and heating stages, which might
have affected to a variable extent the organic and mineral
– (i) With Merriman and Frey (1999) table: the difference
signals (García-López et al., 2001).
between KI-derived and RSCM-derived temperatures
Nonetheless, irrespective of the comparison between
varies from ∼75 °C to ∼150 °C (Lahfid et al., 2010) and
temperatures themselves, there are also large differences in
from ∼80 °C to ∼120 °C (Kouketsu et al., 2014) at 5 km
the temperature gradients derived from the different geo- and 14 km from the dome, respectively.
thermometers. Between 1 to 6 km away from the dome, the
– (ii) With Zhu et al. (2016) equation: the T difference varies
illite crystallinity seems to reach a plateau around 275 °C
from ∼75 °C to ∼175 °C (Lahfid et al., 2010) and from
(dashed line in Fig. 14). This plateau could correspond to the
∼80 °C to ∼150 °C (Kouketsu et al., 2014) in the same
temperature above which small muscovite or sericite have
section.
completely replaced the original clays and would be the upper
limit of the method, while carbonaceous matter crystallinity
(hence its Raman spectra) continue its evolution at higher Therefore, these disparities suggest that organic matter
temperature. Hence, for comparing the RSCM temperature record the dome exhumation thermal impact on a much
with illite crystallinity temperature, we shall exclude the broader area than illite crystallinity.
highest temperature domain in the vicinity of the dome and To interpret these discrepancies, one has to consider the
consider the section at a distance from 5 km to 15 km from the nature of the physical and chemical processes involved in
Page 16 of 24Vous pouvez aussi lire