MARSEILLE OBSERVATOIRE LOCAL DU - TOURISME Tourism 2017
←
→
Transcription du contenu de la page
Si votre navigateur ne rend pas la page correctement, lisez s'il vous plaît le contenu de la page ci-dessous
chiffres-clés
              Key figures
               2017

  MARSEILLE
OBSERVATOIRE
  LOCAL DU
TOURISMETourism
        Observatory
Sommaire
    SUMMARY

    4    Place du tourisme dans l’activité marseillaise     56   Musées, sites et expositions
         Role of tourism in Marseille’s economic activity        Museums, sites and exhibitions

     8   Hébergement touristique                            60   Grands événements
         Tourist accommodation                                   Major events

    24   Transports                                         62   Activités touristiques
         Transport                                               Tourist activities

    32   Croisières et Grande Plaisance                     66   Grands équipements
         Cruise ships and Large yachts                           Large equipment

    38   Industrie des Rencontres Professionnelles          68   Espaces naturels
         Professional Meetings Industry                          Natural areas

    48   Office de Tourisme et des Congrès de Marseille     70   Ports de plaisance

                                                                                                  © FOTOLIA
         Marseille Tourist Office and Convention Bureau          Yacht harbours

2                                                                                                   3
Rôle majeur
    Place du tourisme                                                                                              du tourisme
                                                                                                                   confirmé
    dans l’activité marseillaise                                                                                   Major role
    ROLE OF TOURISM IN MARSEILLE’S ECONOMIC ACTIVITY                                                               of tourism
                                                                                                                   confirmed

    TAXE DE SÉJOUR EN 2017
    En 2017, le produit de la taxe de séjour collectée s’élève à 4 980 569 € (*), dont 318 578 € de
    taxe départementale additionnelle sur la taxe de séjour, soit une augmentation de +31,7% par
    rapport à 2016.
    Cette nouvelle hausse s’explique notamment par une gestion optimisée de la collecte de la taxe
    de séjour grâce au nouvel outil de déclaration en ligne mis en place depuis juillet 2016, doublée
    d’une communication accrue vers les hébergeurs.
    A noter également, le versement début 2018 de la taxe de séjour par la plateforme collaborative
    Airbnb soit 792 622 € dus au titre de la taxe 2017.

    TOURIST TAX IN 2017
    In 2017, tourist tax revenues increased to €4,980,569, this included an additional departmental
    tax of €318,578, representing an increase of 31.7% compared to 2016.
    This new rise is largely due to the optimisation of the tourist tax’s collection, thanks to an online
    declaration tool that has been in place since July 2016, along with improved communication
    with hosts.
    It should also be noted that €792,622 of the tourist tax paid via the collaborative platform
    Airbnb during the tax installment at the beginning of 2018 was due to tax owed in 2017.

    EVOLUTION DE LA TAXE DE SÉJOUR À MARSEILLE DE 2010 À 2017 (HORS VERSEMENT AIRBNB POUR 2017)
    DEVELOPMENT OF TOURIST TAX IN MARSEILLE FROM 2010 TO 2017 (WITHOUT AIRBNB TOURIST TAX IN 2017)
              PRODUIT DE LA TAXE DE SÉJOUR (*)
              PART DÉPARTEMENTALE 318 578 €                             PART COMMUNALE 4 661 991 €
      2017                                                                                                                 4 980 569,00 €
      2016        EURO 2016                                                       3 782 034 €
      2015                                                  2 731 481 €
      2014                                                2 660 032 €
      2013
                  CAPITALE EUROPÉENNE DE LA CULTURE
                  EUROPEAN CAPITAL OF CULTURE         2 562 037 €
      2012                                  2 086 820 €
       2011                                2 029 537 €
      2010                            1 782 598 €

              0                  1 000 000             2 000 000             3 000 000               4 000 000         5 000 000
              (*) Données comptables dernier trimestre n-1 jusqu’au 3ème trimestre de l’année n
               (*) Accounting Data for last quarter n-1 to 3rd quarter of year n

              SOURCE VILLE DE MARSEILLE – RÉGIE DE LA TAXE DE SÉJOUR / CITY OF MARSEILLE – TOURISM TAX AUTHORITY

4                                                                                                                                           5
EMPLOI ET ÉTABLISSEMENTS ÉVOLUTION DE L’EMPLOI TOURISTIQUE DE 2011 À 2016
RÉPARTITION PAR TYPE D’HÉBERGEMENT DE LA TAXE DE SÉJOUR À MARSEILLE EN 2015, 2016, 2017 DE TOURISME À MARSEILLE EN 2016 CHANGES IN TOURISM EMPLOYMENT FROM 2011 TO 2016
DISTRIBUTION OF TOURIST TAX BY ACCOMMODATION TYPE IN MARSEILLE IN 2015, 2016, 2017
En 2016 (*), Marseille compte : 14 500
14 594
TYPE ET CLASSEMENT MONTANT TAXE MONTANT TAXE MONTANT TAXE
PAR HÉBERGEMENT DE SÉJOUR 2015 DE SÉJOUR 2016 DE SÉJOUR 2017 14 594 emplois dans le tourisme contre
2015 TOURIST TAX 2016 TOURIST TAX 2017 TOURIST TAX
TYPE AND CLASSIFICATION BY ACCOMMODATION AMOUNT AMOUNT AMOUNT 14 323 en 2015 soit une hausse de 1,9%.
14 323
HÔTEL 1* 64 116 € 60 381 € 82 340 € 90,5% des emplois salariés touristiques 14 000
se concentrent dans les secteurs de
14 158
HÔTEL 2* 448 823 € 473 999 € 592 920 € l’hôtellerie et de la restauration.
13 787
HÔTEL 3* 648 645 € 845 004 € 1 116 121 €
La part de l’emploi touristique dans
HÔTEL 4* 825 819 € 1 212 379 € 1 442 862 € l’emploi salarié privé total de la ville en 13 500
HÔTEL 5* 202 377 € 355 609 € 465 126 € 2016 (243 111 emplois) est de 6% contre
5,8% en 2015.
HÔTEL NON CLASSÉ
UNCLASSIFIED HOTEL 76 189 € 87 845 € 113 220 €
13 292
13 239
MEUBLÉ DE TOURISME 1*
2 584 établissements de tourisme, contre 13 000
2 537 € 3 203 € 2 247 € 2 526 en 2015 (+2,3%).
SOURCE : URSSAF-ACOSS
VACATION RENTAL 1*
MEUBLÉ DE TOURISME 2* (*) données URSSAF-ARCOSS communiquées arrêtées au 31
VACATION RENTAL 2* 10 962 € 15 917 € 8 860 € décembre pour l’année n-2.
MEUBLÉ DE TOURISME 3*
VACATION RENTAL 3* 10 287 € 10 491 € 10 325 € 12500
2011 2012 2013 2014 2015 2016
MEUBLÉ DE TOURISME 4*
VACATION RENTAL 4* 5 570 € 7 123 € 5 688 €
MEUBLÉ DE TOURISME 5*
567 € 1 229 € 655 € TOURISM EMPLOYMENT AND ÉVOLUTION DU NOMBRE D’ÉTABLISSEMENTS TOURISTIQUES
VACATION RENTAL 5*
DE 2011 À 2016
MEUBLÉ DE TOURISME NON CLASSÉ
23 115 € 41 698 € 235 092 €
ESTABLISHMENTS IN MARSEILLE IN 2016 INCREASE IN THE NUMBER OF TOURISM ESTABLISHMENTS FROM 2011
UNCLASSIFIED VACATION RENTAL TO 2016
MEUBLÉ PRÉFECTURE
In 2016 (*), Marseille had:
PREFECTURE RENTAL 114 313 € 147 894 € 173 378 € 2 600
14,594 jobs in tourism compared to 14,323
RÉSIDENCE HÔTELIÈRE 2* in 2015, representing an increase of 1.9%.
- - 1 593 €
2584
HOTEL RESIDENCE 2*
90. 5% of tourism wage jobs are
RÉSIDENCE HÔTELIÈRE 3* concentrated in the hotel and hospitality
223 313 € 398 567 € 589 791 € 2 500
2526
HOTEL RESIDENCE 3*
sectors.
RÉSIDENCE HÔTELIÈRE 4*
2 480
HOTEL RESIDENCE 4* 23 668 € 41 342 € 53 043 €
The proportion of tourism employment 2 400
RÉSIDENCE HÔTELIÈRE NON CLASSÉE
37 777 € 58 707 € 59 641 € in the city’s total figures for private paid
2 405
UNCLASSIFIED HOTEL RESIDENCE
employment in 2016 (243,111) is 6%
CHAMBRE D'HÔTES 1*
2 597 € 3 639 € 2 694 € compared to 5.8% in 2015.
SOURCE : URSSAF-ACOSS
BED AND BREAKFAST 1* 2 300
2 334
CHAMBRE D'HÔTES 2*
2 330
BED AND BREAKFAST 2* 1 627 € 3 023 € 2 575 € 2,584 tourism establishments compared
CHAMBRE D'HÔTES 3* to 2,526 in 2015 (+2.3%).
BED AND BREAKFAST 3* 497 € 586 € 409 € 2 200
2011 2012 2013 2014 2015 2016
(*) URSSAF-ARCOSS data sent are as of December 31 for the
CHAMBRE D'HÔTES 4* year n-2.
BED AND BREAKFAST 4* 195 € 368 € 116 €
CHAMBRE D'HÔTES NON CLASSÉE
UNCLASSIFIED BED AND BREAKFAST 8 488 € 13 034 € 15 964 €
PORT DE PLAISANCE
- 5 768 €
RÉPARTITION DES ACTIVITÉS TOURISTIQUES EN 2016 HÉBERGEMENT
SOURCE : URSSAF-ACOSS
ACCOMMODATION
YACHT HARBOR
DISTRIBUTION OF TOURIST ACTIVITIES IN 2016 8,80 %
HÉBERGEMENT DE PLEIN AIR - 140 € RESTAURATION
OUTDOOR ACCOMMODATION Sur une base totale de 2 584 établissements RESTAURANTS
touristiques / On a total basis of 2,584 tourism
TOTAL 2 731 481 € 3 782 035 € 4 980 569 establishments. SERVICES
80,70 %
10,50 %
(*) Données comptables dernier trimestre n-1 jusqu’au 3ème trimestre de l’année n
(*) Accounting Data for last quarter n-1 to 3rd quarter of year n
SOURCE VILLE DE MARSEILLE – RÉGIE DE LA TAXE DE SÉJOUR / CITY OF MARSEILLE – TOURISM TAX AUTHORITY
6 7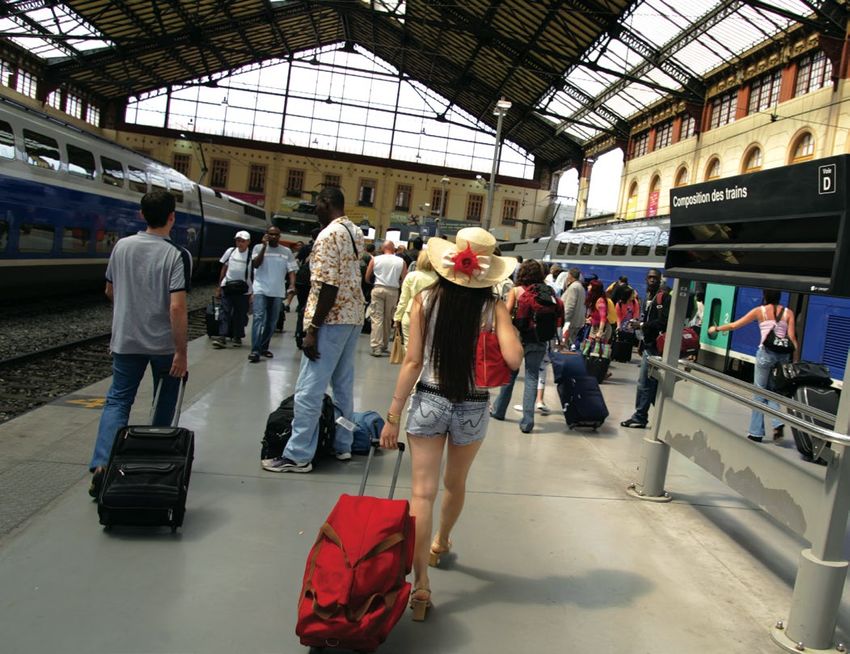
Montée
                                                                                                                    en gamme
    hébergement touristique                                                                                         4 et 5 étoiles
    TOURIST ACCOMODATION                                                                                            Rise in the
                                                                                                                    4 and 5
                                                                                                                    star ranges

                                                        ®MATTHIEU PARENT
                                                                           CHIFFRES CLÉS
                                                                           DE L’HÔTELLERIE AU 1/01/18
                                                                           KEY HOTEL FIGURES AS OF 1/01/18
                                                                           5 949 chambres en hôtellerie classée
                                                                            (-0,5 % par rapport à 2016)
                                                                           1 160 chambres en hôtellerie non classée
                                                                           (+11,1% par rapport à 2016)
                                                                           2 416 chambres dans les catégories 4* et 5*
                                                                           (+7,3 % par rapport à 2016)

                                                                           5,949 classified bed and breakfasts (-0,5 % compared to 2016)

                                                                                                                                                                                                                                             ©MAISON MONTGRAND
                                                                           1,160 unclassified bed and breakfasts (+11,1 % compared to 2016)
                                                                           2,416 rooms in 4* and 5* categories (+7,3 % compared to 2016)

    VILLAGE CLUB DU SOLEIL, MARSEILLE LA BELLE DE MAI

                                                                                                                                              LA MAISON MONTGRAND
    OFFRE D’HÉBERGEMENT                                                              ACCOMMODATION LISTING
                                                                                                                                              LA MAISON MONTGRAND                             LA MAISON MONTGRAND
    DE NOUVEAUX ÉTABLISSEMENTS                                                      NEW ESTABLISHMENTS                                        Ouverte en mars 2017, située en plein coeur     Opened in March 2017, located in the heart
                                                                                                                                              du centre-ville historique de Marseille à       of Marseille’s historic city center, a few
    VILLAGE CLUB DU SOLEIL, MARSEILLE                                               VILLAGE CLUB DU SOLEIL, MARSEILLE                         quelques encablures du Vieux-Port, la           steps away from the Vieux Port, the Maison
    LA BELLE DE MAI                                                                 LA BELLE DE MAI                                           Maison Montgrand est un boutique hôtel          Montgrand is a charming 3-star boutique
    Ouvert en février 2017, le Village Club du Soleil                               Having opened in February 2017, the Village               de charme (3*) au concept atypique.             hotel.
    Marseille La Belle de Mai réinvente les séjours                                 Club du Soleil Marseille La Belle de Mai is               La maison principale, implantée dans un         In the main building, set in an elegantly
    en ville. Après avoir vu naître de nombreux                                     reinventing city escapes. After having served             hôtel particulier, regroupe concept store,      renovated 19th century mansion, you will
    marseillais, l’ancienne maternité entièrement                                   as the location where many Marseille citizens             restaurant, bar, salon de thé, salle de bien-   find a concept store, a restaurant, a bar, a
    réhabilitée accueille le premier Village Club                                   were born, the completely refurbished former              être et de beauté, salle de séminaire, et un    tea room, a wellness and beauty room, a
    urbain. Les services et le confort d’un village                                 maternity wards houses the first urban Village            jardin de 400m².                                meeting space as well as a 400-sqm garden.
    club pour un séjour tout compris à Marseille :                                  Club. It provides the services and comfort of             Elle met en scène les talents de la création    This atypical jewel exhibits the talents of
    un magnifique parc arboré de 2 hectares,                                        a village club, for an all-inclusive holiday in           française d’un côté, et propose un espace       French designers on one side, and offers a
    124 chambres, un restaurant avec bar et                                         Marseille: a magnificent 2-hectare treelined              consacré à la restauration et aux séminaires    catering and meeting space on the other
    terrasse, des clubs enfants à partir de 3 mois,                                 park, 124 bedrooms, a restaurant with a bar               de l’autre. Les 37 chambres sont situées        one. The 37 rooms are located in two
    une piscine extérieure chauffée, un espace                                      and terrace, kids’ clubs starting from 3 months,          dans deux annexes distinctes alliant design     annexes combine design and comfort.
    forme et bien-être avec sauna, hammam,                                          a heated outdoor swimming pool, a fitness                 et confort.                                     More information:
    bains à remous et le Marseille City Pass inclus.                                and well-being space with a sauna, hammam,                Plus d’informations :                           jardin-montgrand.com
    Situé à proximité immédiate de la Friche la                                     hot tub and the Marseille City Pass included.             jardin-montgrand.com
    Belle de Mai et doté de 4 salles de séminaires                                  Located right next to the Friche la Belle de
    dont une plénière pouvant accueillir jusqu’à                                    Mai and endowed with 4 seminar rooms, one
    150 personnes, le Village Club est un pied-à-                                   of which is plenary and can accommodate
    terre idéal pour des séjours business ou loisirs.                               up to 150 people, the Village Club is an ideal
    Plus d’informations :                                                           base for business or pleasure trips.
    lesvillagesclubsdusoleil.com                                                    More information:
                                                                                    lesvillagesclubsdusoleil.com
8                                                                                                                                                                                                                                            9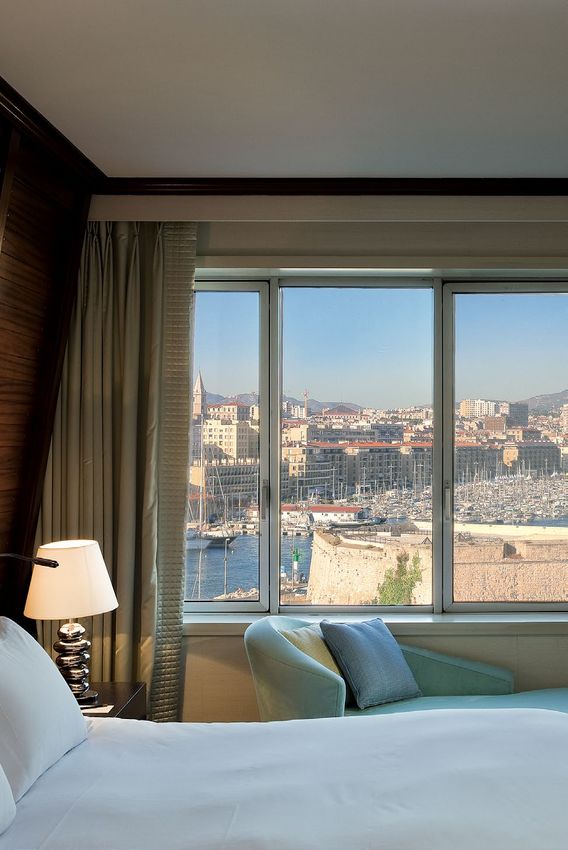
OFFRE MARSEILLAISE PAR TYPE D’HÉBERGEMENT
MARSEILLE LISTINGS BY TYPE OF ACCOMMODATION
HÔTELLERIE – PARA-HÔTELLERIE
HOTEL – PARA-HOTEL
NOMBRE NOMBRE
HÔTELS D’ÉTABLISSEMENTS DE CHAMBRES CAPACITÉ
HOTELS NUMBER OF NUMBER CAPACITY
ESTABLISHMENTS OF ROOMS
HÔTELS CLASSÉS 73 5 949 11 898
CLASSIFIED HOTELS
HÔTELS NON CLASSÉS 38 1 160 2 320
NON-CLASSIFIED HOTELS
TOTAL 111 7 109 14 218
SOURCE PROVENCE TOURISME - DONNÉES AU 1 JANVIER 2018 - PROVENCE TOURISM - DATA AS OF JANUARY 1 , 2018
ER ST
CAPACITÉ D’ACCUEIL
RÉSIDENCES DE TOURISME NOMBRE D’ÉTABLISSEMENTS EN PERSONNES
TOURISM AND SIMILAR TYPE RESIDENCES NUMBER OF ESTABLISHMENTS ACCOMMODATION CAPACITY
IN TERMS OF PEOPLE
2 ÉTOILES 2 STARS 1 252
3 ÉTOILES 3 STARS 11 2 923
4 ÉTOILES 4 STARS 1 350
RÉSIDENCES DE TOURISME 13 3 525
TOURISM RESIDENCES
RÉSIDENCES NON CLASSÉES 8 1 174
©STAYCITY
NON-CLASSIFIED RESIDENCES
TOTAL 21 4 699
STAY CITY APPARTHOTELS MARSEILLE
SOURCE PROVENCE TOURISME - DONNÉES AU 1 JANVIER 2018 - PROVENCE TOURISM - DATA AS OF JANUARY 1 , 2018
ER ST
STAY CITY APPARTHOTELS MARSEILLE STAY CITY APPARTHOTELS MARSEILLE AUTRES HÉBERGEMENTS NOMBRE D’ÉTABLISSEMENTS CAPACITÉ
OTHER ACCOMMODATION NUMBER OF ESTABLISHMENTS CAPACITY
Ouvert en février 2017, Staycity Aparthotels Opened in February 2017, Staycity
Marseille est idéalement situé rue Sainte- Apparthotels Marseille is ideally located AUBERGES DE JEUNESSE
3 266
YOUTH HOSTELS
Barbe, à proximité du Vieux-Port. Cette on rue Saint-Barbe, near the Old Port.
résidence de tourisme comprend 108 This tourist residence comprises 108 VILLAGE DE VACANCES 1 366
HOLIDAY VILLAGES
appartements adaptés au tourisme de apartments suitable for leisure or business
loisirs ou d’affaires. tourism. SOURCE PROVENCE TOURISME - DONNÉES AU 1ER JANVIER 2018 - PROVENCE TOURISM - DATA AS OF JANUARY 1ST, 2018
Staycity Aparthotels Marseille offre une Staycity Aparthotels Marseille offers a range
gamme de studios (2/3 personnes) et of studios (2/3 people) and apartments
d’appartements (4 personnes) comprenant (4 people) comprising fully equipped
des kitchenettes totalement équipées et kitchenettes and range of various services
une gamme de services divers (réception (24-hour reception, free Wi-Fi, fitness room,
24h/24, Wi-Fi gratuit, salle de fitness, laverie laundry and parking spaces, a snack bar
et places de parking, un espace de snacking with its own Coffee Dock).
avec son Coffee Dock). More information:
Plus d’informations : staycity.com/marseille
© GOLDEN TULIP
staycity.com/marseille
GOLDEN TULIP MARSEILLE EUROMED
10 11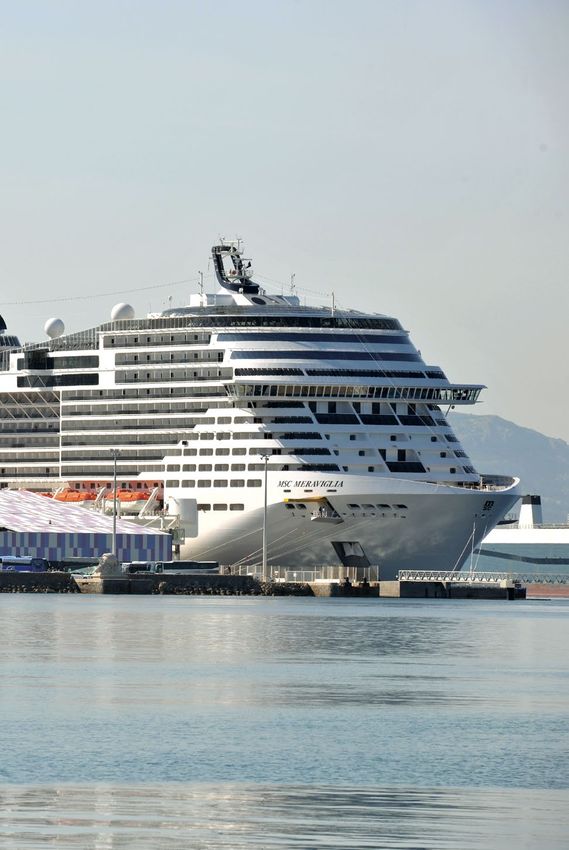
MEUBLÉS DE TOURISME – CHAMBRES D’HÔTES
     VACATION RENTALS - BED AND BREAKFASTS
                            MEUBLÉS DE TOURISME                                        NOMBRE D’ÉTABLISSEMENTS
                                 VACATION RENTALS                                         NUMBER OF ESTABLISHMENTS

                      MEUBLÉS DE TOURISME CLASSÉS                                                       195
                           CLASSIFIED VACATION RENTALS

                   MEUBLÉS DE TOURISME NON CLASSÉS                                                      647
                         UNCLASSIFIED VACATION RENTALS

                                       TOTAL                                                            842
     RECENSEMENT ÉTABLI PAR LA RÉGIE DE LA TAXE DE SÉJOUR - CENSUS SET BY THE TOURIST TAX GOVERNANCE
     SOURCE VILLE DE MARSEILLE – RÉGIE DE LA TAXE DE SÉJOUR - DONNÉES AU 1ER JANVIER 2018 - VILLE DE MARSEILLE – TOURIST TAX
     GOVERNANCE - DATA ON JANUARY 1ST 2018

                              CHAMBRES D’HÔTES                                         NOMBRE D’ÉTABLISSEMENTS
                                BED AND BREAKFAST                                         NUMBER OF ESTABLISHMENTS

                       CHAMBRES D’HÔTES CLASSÉES                                                         37
                         CLASSIFIED BED AND BREAKFASTS

                    CHAMBRES D’HÔTES NON CLASSÉES                                                        84
                        UNCLASSIFIED BED AND BREAKFASTS

                                       TOTAL                                                            121
     SOURCE VILLE DE MARSEILLE – RÉGIE DE LA TAXE DE SÉJOUR - DONNÉES AU 1ER JANVIER 2018 - VILLE DE MARSEILLE – TOURIST TAX
     GOVERNANCE - DATA ON JANUARY 1ST 2018

     OFFRE MARSEILLAISE PAR CATÉGORIE D’HÔTEL
     MARSEILLE LISTING BY HOTEL CATEGORY

                                                         PART           ÉVOLUTION              CAPACITÉ               PART
                                                        SUR LE          DU NOMBRE            D’ACCUEIL EN            SUR LE     ÉVOLUTION DE
            CATÉGORIES               NOMBRE           TOTAL DES          D’HÔTELS                                   TOTAL DE      LA CAPACITÉ
                                     D'HÔTELS                              16/17             NOMBRE DE                          D’ACCUEIL 16/17
             D’HÔTELS                                  HÔTELS                                 CHAMBRES             CHAMBRES
                                     NUMBER OF          SHARE OF         CHANGE IN                                   SHARE OF     CHANGE IN
         HOTEL CATEGORIES                                               THE NUMBER            CAPACITY IN                         CAPACITY
                                      HOTELS           THE TOTAL                                                    THE TOTAL
                                                                         OF HOTELS            NUMBER OF                             16/17
                                                       NUMBER OF                                                    NUMBER OF
                                                                           16/17                ROOMS
                                                         HOTELS                                                       ROOMS

          1 ÉTOILE 1 STAR                 1               1,3%            -66,6%                   82                  1,4%        -39,7%
         2 ÉTOILES 2 STARS               20              27,4%             -25,9%                1533                 25,8%        -11,5%
             HÔTEL RADISSON
         3 ÉTOILES 3 STARS BLU           31              42,5%             +3,3%                 1918                 32,2%        +3,2%
         4 ÉTOILES 4 STARS               17              23,3%             +6,2%                 2052                 34,5%        +8,7%
         5 ÉTOILES 5 STARS                4              5,5%                0%                   364                  6,1%          0%
               TOTAL                     73              100%              -8,8%                 5949                 100%         -0,5%
     SOURCE PROVENCE TOURISME - DONNÉES AU 1 JANVIER 2018 - PROVENCE TOURISM - DATA ON JANUARY 1 2018
                                                ER                                                      ST
                                                                                                                                                  ©HÔTEL CARRÉ VIEUX PORT

                                                                                                                                                                                      ©SOFITEL
     HÔTEL CARRÉ VIEUX-PORT                                                                                                                                                 SOFITEL

12                                                                                                                                                                                               13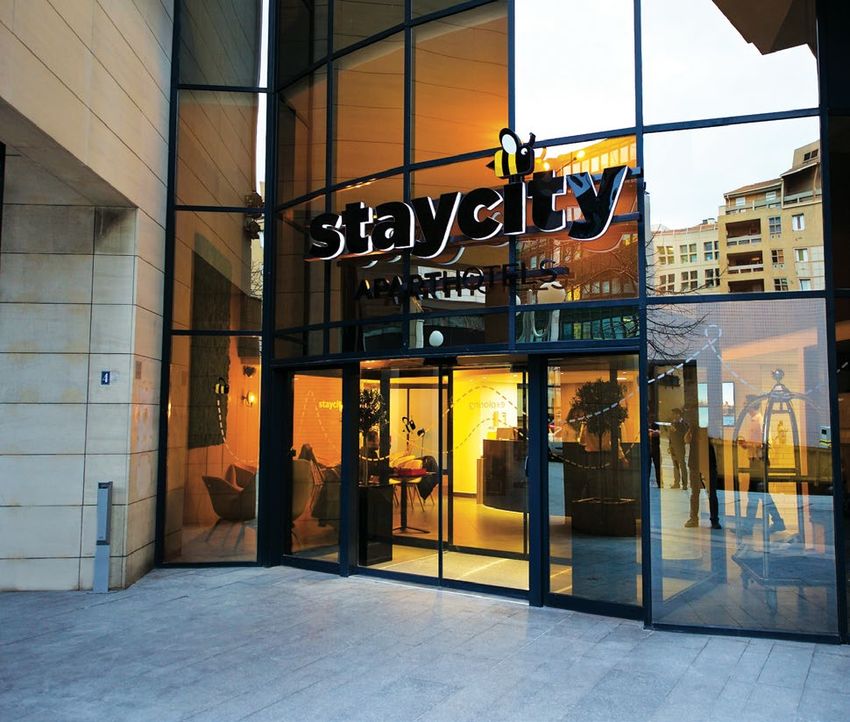
ÉVOLUTION DU PARC HÔTELIER CLASSÉ DE 2007 À 2017 OFFRE DE LOCATION AIRBNB
QUANTITY OF CLASSIFIED HOTELS BETWEEN 2007 AND 2017 AIRBNB RENTAL LISTINGS
ÉVOLUTION DU PARC HÔTELIER CLASSÉ MARSEILLAIS DE 2007 À 2017 OFFRE AIRBNB PAR TYPE D’HÉBERGEMENT 2017 OFFRE AIRBNB PAR CAPACITÉ D’ACCUEIL 2017
QUANTITY OF CLASSIFIED HOTELS IN MARSEILLE BETWEEN 2007 AND 2017 AIRBNB LISTINGS BY ACCOMMODATION TYPE 2017 AIRBNB LISTINGS BY ACCOMMODATION TYPE 2017 CAPACITY
6000 5979 5949
5650 5607 5619
5305
5500 CHAMBRES PRIVÉES 1-2 PERSONNES
5182 PRIVATE ROOMS 1-2 PEOPLE
5004 NOMBRE DE
5000
4836 4907
CHAMBRES 19 % 31 %
NUMBER OF
4482 ROOMS
4500
CHAMBRES PARTAGÉES 3-4 PERSONNES
4000 SHARED ROOMS 3-4 PEOPLE
90 1% 31 %
90
87 NOMBRE LOGEMENTS ENTIERS
85 85 D’HÔTELS ENTIRE HOMES
CLASSÉS
85 83
82 82
NUMBER OF 80 %
81 81 CLASSIFIED
80 HOTELS
80 PLUS DE 4 PERSONNES
MORE THAN 4 PEOPLE
SOURCE GROUPE MKG / OLAKALA_SUITE SOURCE GROUPE MKG / OLAKALA_SUITE
38 %
73
75 EXTRAIT DE L’ÉTUDE 2017 MENÉE PAR LE GROUPE MKG / OLAKALA_SUITE EXTRACT FROM THE 2017 STUDY CARRIED OUT BY THE MKG/OLAKALA_SUITE GROUP
2007 2008 2009 2010 2011 2012 2013 2014 2015 2016 2017
SOURCE : PROVENCE TOURISME
UNE OFFRE MAJORITAIREMENT LISTINGS ARE MAINLY ENTIRE HOMES
COMPOSÉE DE LOGEMENTS ENTIERS 80% of the Airbnb listings in Marseille
80% des annonces Airbnb sur Marseille are for renting an entire home, where the
proposent de louer un logement entier, landlord is not present. Thus, 80% of the
sans présence du propriétaire. Ainsi, 80% listings are akin to the rental of vacation
ÉVOLUTION DU NOMBRE DE CHAMBRES HÔTELIÈRES PAR CATÉGORIE DE 2007 À 2017 de l’offre est apparentée à de la location de homes, perhaps even to tourism residences,
DEVELOPMENT IN THE NUMBER OF HOTEL ROOMS PER CATEGORY BETWEEN 2007 AND 2017
1944 1956
2052 meublés, voire aux résidences de tourisme and 20% of the listings are private rooms,
et 20% des annonces sont des chambres which are more akin to hotel rooms.
4*
2000
1888
1857
1835
privées, s’apparentant à des chambres
1706 1859
1918
3* d’hôtel. LODGINGS PROVIDING VARIOUS
1648
1584 1585 1584 1584
1732
2* CAPACITIES, SUITED TO GROUPS AND
1457
1500 DES LOGEMENTS OFFRANT DES INDIVIDUALS
1500
1533
CAPACITÉS VARIÉES, ADAPTÉES Varying in size, the lodgings listed on
1333
1432
1240
1441 1441 AUX GROUPES ET INDIVIDUELS the Airbnb site attract all kinds of clients:
1146
1215 1378
Avec des tailles variées, les logements individuals, couples, or groups (friends/
1072
1121
1067
1094 proposés sur le site Airbnb peuvent attirer family).
1000 1089
tous types de clientèles, individuelles, en It should be noted that with 69% of the
1018 1021
1063 899 couple, ou des groupes constitués (amis/ entire homes being able to accommodate
896
763 famille). more than 3 people, Airbnb listings
702
A noter qu’avec 69% des logements entiers particularly well-suited to families and
pouvant accueillir plus de 3 personnes, groups of friends.
521
500
486 l’offre Airbnb est particulièrement adaptée 39.1% of listings can be booked instantly,
aux familles et aux groupes d’amis. without having to wait for the landlord’s
5*
344 364 364 364 364
39,1% de l’offre peut être réservée approval.
134 134 150 150
273 273
instantanément, sans attendre l’accord du
propriétaire.
0
136
82
1*
2007 2008 2009 2010 2011 2012 2013 2014 2015 2016 2017
SOURCE : PROVENCE TOURISME
14 15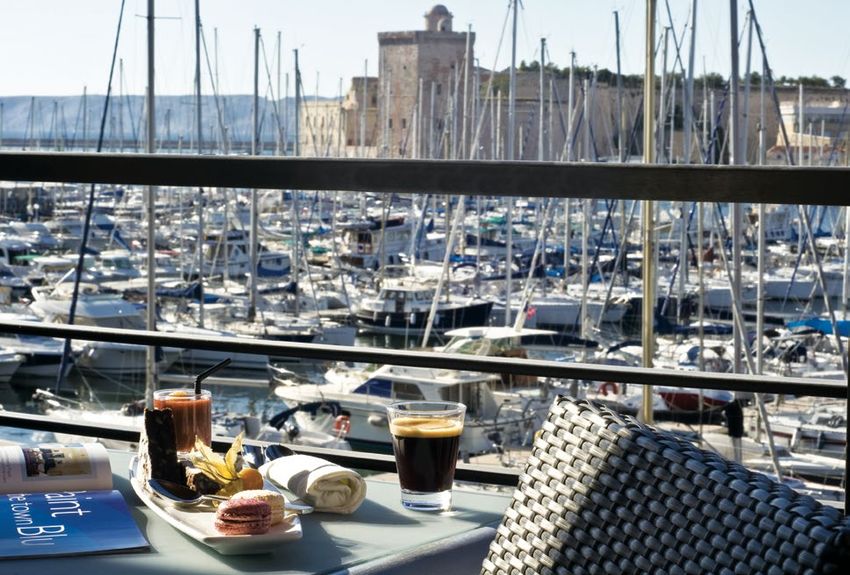
BILAN DE L’ACTIVITÉ HÔTELIÈRE 2017 À MARSEILLE TAUX D’OCCUPATION ANNUEL PRIX MOYEN ANNUEL HT PAR CATÉGORIE
PAR CATÉGORIE EN 2016 ET 2017 EN 2016 ET 2017
BALANCE OF 2017 HOTEL ACTIVITY IN MARSEILLE ANNUAL OCCUPANCY RATE PER CATEGORY ANNUAL AVERAGE PRICE BEFORE TAX PER CATEGORY
IN 2016 AND 2017 IN 2016 AND 2017
PERFORMANCES HÔTELIÈRES ET PARA-HÔTELIÈRES PAR CATÉGORIE À MARSEILLE EN 2016 ET 2017 TAUX PRIX MOYEN ANNUEL
HOTEL AND PARA-HOTEL PERFORMANCE PER CATEGORY IN MARSEILLE IN 2016 AND 2017 D’OCCUPATION (%) HT (EUROS)
OCCUPANCY ANNUALAVERAGE PRICE
RATE (%) BEFORE TAX (IN EUROS)
PRIX MOYEN HT (EN EUROS) REVPAR HT (EN EUROS) CATÉGORIE 2017 2016 CATÉGORIE 2017 2016
TAUX D’OCCUPATION (%) AVERAGE PRICE BEFORE TAX REVPAR BEFORE TAX CATEGORY CATEGORY
OCCUPANCY RATE (%) (IN EUROS) (IN EUROS)
SUPER SUPER
ECONOMIQUE 69,5 64,8 ECONOMIQUE 46,6 48,8
Variation Variation Variation SUPER BUDGET SUPER BUDGET
CATÉGORIE 2017 2016 Change 2017 2016 Change 2017 2016 Change
CATEGORY ECONOMIQUE ECONOMIQUE
N-1 (%) N-1 (%) N-1 (%) BUDGET 68,9 64,6 BUDGET 69,5 72,9
SUPER MOYEN DE GAMME MOYEN DE GAMME
ECONOMIQUE 69,5 64,8 4,7 46,6 48,8 -4,4% 32,4 31,6 2,5% MID-RANGE 67,5 65,3 MID-RANGE 88,0 91,7
SUPER BUDGET
HAUT DE GAMME 66,6 60,3 HAUT DE GAMME 143,4 152,0
ECONOMIQUE TOP OF THE RANGE TOP OF THE RANGE
BUDGET 68,9 64,6 4,4 69,5 72,9 -4,6% 47,9 47,1 1,9%
RÉSIDENCES RÉSIDENCES
TOURISME 71,4 67,8 TOURISME 57,2 61,8
MOYEN DE GAMME TOURISM REDIDENCES TOURISM REDIDENCES
MID-RANGE 67,5 65,3 2,2 88,0 91,7 -4,0% 59,4 59,9 -0,8%
GLOBAL 68,7 64,5 GLOBAL 79,2 83,0
OVERALL OVERALL
HAUT DE GAMME 66,6 60,3 6,3 143,4 152,0 -5,7% 95,5 91,6 4,2%
TOP OF THE RANGE SOURCE GROUPE MKG / OLAKALA_SUITE SOURCE: MKG / OLAKALA_SUITE GROUP
RÉSIDENCES GLOSSAIRE / GLOSSARY
TOURISME 71,4 67,8 3,6 57,2 61,8 -7,6% 40,8 41,9 -2,6% TAUX D’OCCUPATION = NOMBRE DE CHAMBRES VENDUES / NOMBRE DE CHAMBRES DISPONIBLES / OCCUPANCY RATE = NUMBER OF ROOMS SOLD / NUMBER OF
ROOMS AVAILABLE
TOURISM REDIDENCES
PRIX MOYEN TTC = CHIFFRE D’AFFAIRES HÉBERGEMENT / NOMBRE DE CHAMBRES VENDUES / AVERAGE ALL-TAX-INCLUSIVE PRICE = ACCOMMODATION REVENUE /
NUMBER OF ROOMS SOLD
GLOBAL REVPAR TTC = TAUX D’OCCUPATION X PRIX MOYEN OU CHIFFRES D’AFFAIRES HÉBERGEMENT / NOMBRE DE CHAMBRES DISPONIBLES. / ALL-TAX-INCLUSIVE REVPAR=
OVERALL 68,7 64,5 4,2 79,2 83,0 -4,5% 54,4 53,5 1,7% OCCUPANCY RATE X AVERAGE PRICE OR ACCOMMODATION REVENUE / NUMBER OF ROOMS AVAILABLE.
SOURCE GROUPE MKG / OLAKALA_SUITE
EXTRAIT DE L’ÉTUDE 2017 MENÉE PAR LE GROUPE MKG / OLAKALA_SUITE / DATA EXTRACTED FROM THE MKG / OLAKALA_SUITE 2017 STUDY
CROISSANCE DU REVPAR GRÂCE REVPAR INCREASE DUE TO THE
AU TAUX D’OCCUPATION OCCUPANCY RATE
Entre janvier et décembre 2017, le taux Between December 2017, the occupancy rate
d’occupation a progressé de 4,2 points, une rose by 4.2 points, which is greater than the
évolution supérieure à la moyenne nationale national average (+3.3 points). The global
(+3,3 pts). Le prix moyen global sur 12 mois average price on 12 months is set at €79.2 in
s’établit à 79,2€ en 2017, en baisse de 4,5%, 2017, down by 4.5% compared to the 2016
eu égard à l’organisation en juin et juillet Euro organisation in June and July. Outside
de l’Euro 2016. En dehors de ces deux mois, these two months, the average price has not
le prix moyen évolue peu et gagne 1€ par changed much and has increased by €1 from
rapport à 2016, se rapprochant ainsi des 2016, thus drawing near the prices displayed
prix affichés en 2015. Entre 2016 et 2017, le in 2015. Between 2016 and 2017, the overall
RevPAR progresse au global de 1,7%. Ce RevPAR grew by 1.7%. This positive result
résultat positif est exclusivement lié à la is exclusively linked to the growth in the
croissance du taux d’occupation. La hausse occupancy rate. The rise in the occupancy
du taux d’occupation dans les établissements rate in establishments and the drop in average
et la baisse des prix moyens se constatent sur prices is present across all categories and
toutes les catégories et secteurs de la ville. sectors of the city.
@F VAUBAN
HÔTEL RADISSONBLU
16 17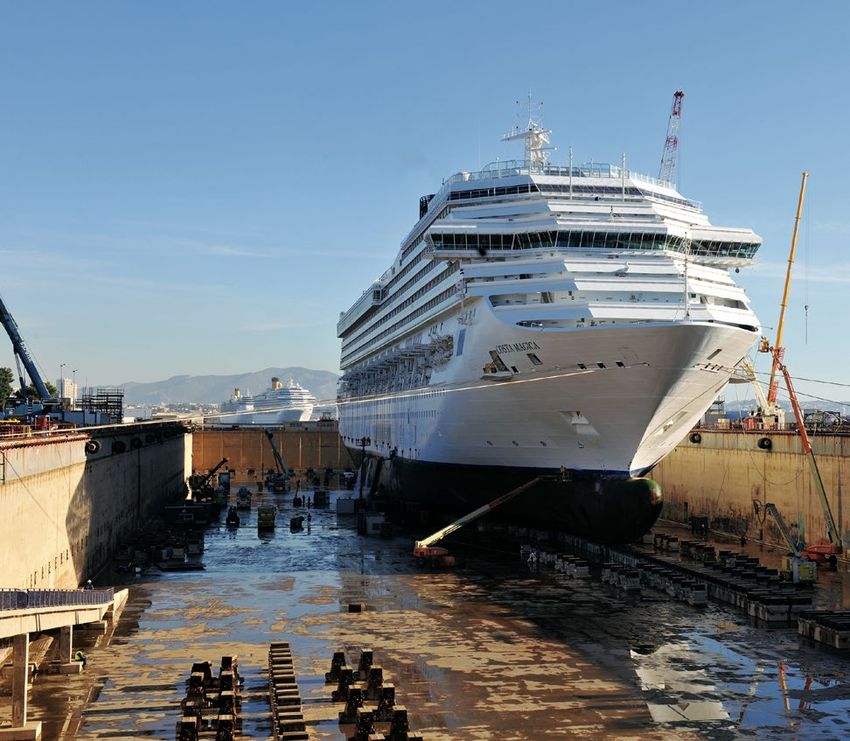
REVPAR HT ANNNUEL PAR CATÉGORIE EN 2016 ET 2017 VARIATIONS MENSUELLES DES TAUX D’OCCUPATION PAR CATÉGORIE EN 2017
ANNUAL REVPAR BEFORE TAX PER CATEGORY IN 2016 AND 2017 MONTHLY VARIATIONS ON THE OCCUPANCY RATES PER CATEGORY IN 2017
TO GLOBAL
90% 84,6%
REVPAR ANNUEL (EUROS)
ANNUAL REVPAR BEFORE TO GLOBAL
85% TO GLOBAL 76,6%
TAX (IN EUROS) 80,4%
TO GLOBAL
CATÉGORIE 2017 2016 80% TO GLOBAL
75,2%
CATEGORY 74,9%
TO GLOBAL TO GLOBAL
70,6% 71,8%
SUPER 75%
ECONOMIQUE 32,4 31,6 TO GLOBAL
63,9%
SUPER BUDGET 70%
TO GLOBAL
66,3%
ECONOMIQUE 47,9 47,1
BUDGET 65%
TO GLOBAL
SOURCE GROUPE MKG / OLAKALA_SUITE
TO GLOBAL
MOYEN DE GAMME 59,4 59,9 60%
54,3%
50,4%
MID-RANGE TO GLOBAL
53,8%
HAUT DE GAMME 95,5 91,6 55%
TOP OF THE RANGE
RÉSIDENCES 50%
© ADRIEN BARGIN
TOURISME 40,8 41,9
TOURISM REDIDENCES 45%
TOTAL 54,4 53,5
40%
HÔTEL C2 JAN FEV MAR AVR MAI JUI JUI AOU SEP OCT NOV DEC
SOURCE GROUPE MKG / OLAKALA_SUITE
Super-économique Super budget Milieu de gamme Mid-range Résidences Residences
Economique Budget Haut de gamme Top of the range Global Overall
HAUSSE DE FRÉQUENTATION ET BAISSE RISE IN VISITATION AND DROP IN THE LES LOGEMENTS AIRBNB SONT AIRBNB LODGINGS ARE PREFERRED BY
DU PRIX MOYEN POUR TOUTES LES AVERAGE PRICE FOR ALL CATEGORIES PLÉBISCITÉS PAR LA CLIENTÈLE LEISURE CLIENTELE.
CATÉGORIES All segments recorded a rising trend in D’AGRÉMENT Between March through December 2017,
Tous les segments enregistrent une tendance occupancy rates, particularly the budget, De mars à décembre 2017, le taux the occupancy rate for all Airbnb lodgings
à la hausse des taux d’occupation, en super-budget and top of the range d’occupation des logements entiers Airbnb stood at 63.4%; a figure that is lower than
particulier les catégories économique, categories with an increase of more than 4 est de 63,4%, un niveau de remplissage in the hotel market for the same period
super-économique et haut de gamme points (4.4, 4.7 and 6.3 points respectively). inférieur au marché hôtelier sur la même (71.5%). The average Airbnb price is also
avec une croissance supérieure à 4 points Contrastingly, the average prices recorded période (71,5%). Le prix moyen Airbnb est below the prices applied on the hotel
(respectivement 4,4, 4,7 et 6,3 points). have decreased for all categories on également en deçà des prix pratiqués par market (€72.5 versus €79.9), but it fluctuates
A l’inverse, les prix moyens relevés sont en the market. Tourism residences and le marché hôtelier (72,5€ contre 79,9€), mais from month to month. The variations in the
baisse pour toutes les catégories du marché. establishments in the top of the range fluctue moins suivant les mois. Les variations occupancy rates and the average prices
Les résidences de tourisme et les segment recorded a drastic drop in the du taux d’occupation et des prix moyens for all Airbnb lodgings are mainly linked to
établissements du segment haut de average price and attained a lower level relevés sur les logements entiers Airbnb tourist seasons.
gamme enregistrent une baisse drastique than that of 2015. For the residence and sont principalement liés à la saisonnalité
de prix moyen et atteignent un niveau super budget markets, the competition touristique.
inférieur à celui de 2015. Pour le marché des of furnished rentals restricts them from
résidences et les segments économiques, raising their rates. The RevPAR is therefore
la concurrence des locations meublées contrasting depending on the category; an
limite les progressions tarifaires. Le RevPAR increase of between 1.9 and 4.2% for the
est donc contrasté suivant les catégories, super budget, budget and top of the range
à la hausse entre 1,9 et 4,2% pour les categories, and a decrease for the mid-
segments super-économique, économique range and especially, residences (-2.6%).
et haut de gamme, et à la baisse pour le
milieu de gamme et surtout pour les
résidences (-2,6%).
©ODALYS CITY
© B&B HOTEL
HÔTEL B&B LES PORTS HÔTEL ODALYS CITY LE DÔME
18 19PRIX MOYENS HT ET REVPAR HT TAUX D’OCCUPATION HEBDOMADAIRE 2017
PAR MOIS EN 2016 ET 2017 120,5
2017 WEEKLY OCCUPANCY RATE
AVERAGE PRICES BEFORE TAX AND REVPAR
PER MONTH IN 2016 AND 2017 93,4 92,9
90% 87,4
90%
81,9 81,9 84,1
84,3 SEMAINE
86,7 84,5
84 80,2 WEEK
81,1 80% 80,3
80,7 75,8 82 76
80% 83,8 83,6 75,2 74,9
77,8 77,9 71,4
76,7 76,4 74,7 73,7
73,2 78,4 TOTAL
78,6 70,5 71,4
72,4 70% 71,1
75 75,8 77,1 66,3 66,5 67,6
70% 74 65,9 70,7
72,8
71,8 64,5
71,9 65
67,2 65,9 64 61,9 63,2 WE
60% 59,5
60,4 65,2 60,7
60% 55,9
54,1 54,7
60,3 51,8
53,5 59,1 50,8
50% 49,3
51,5 56,9 52,1
50%
47,7 43,8 43,6
51,6 41,2
47,7 40%
40% 41,3 39,5
JAN FEV MAR AVR MAI JUI JUI AOU SEP OCT NOV DEC
37,1
40,6
39,3 SOURCE GROUPE MKG / OLAKALA_SUITE
36,8 35,3
30%
JAN FEV MAR AVR MAI JUI JUI AOU SEP OCT NOV DEC
PRIX MOYEN HT HEBDOMADAIRE 2017
SOURCE GROUPE MKG / OLAKALA_SUITE PM HT 2017 REVPAR HT 2017 PM HT 2016 REVPAR HT 2016 2017 WEEKLY AVERAGE PRICE BEFORE TAX
94,1
95%
VARIATIONS DES PERFORMANCES SEMAINES ET WEEK-ENDS ENTRE 2016 ET 2017 92,1 SEMAINE
HANGES OF WEEKLY AND WEEKEND RETURNS BETWEEN 2016 AND 2017 91,4 WEEK
89,9
90% 89 88,7 89,3
TAUX D’OCCUPATION PRIX MOYEN HT (EN EUROS) REVPAR HT (EN EUROS) 87,3 TOTAL
OCCUPANCY RATE AVERAGE PRICE BEFORE TAX IN EUROS REVPAR BEFORE TAX IN EUROS 88,4
86,5 86,2
84,9 WE
Var.N-1 Var.N-1 Var.N-1 84,6 85,7
2017 2016 2017 2016 2017 2016 85%
(pts) (%) (%) 82,3
85,2
82,4 82,1
82 81
SEMAINE 72,4% 68,7% 3,7 84,75 89,83 -5,6% 61,34 61,73 -0,6% 80,5 80,2 79,6
WEEK 80,7
80% 78,2 81,8 78,8
79,5 79,5
77,4
77,9
WEEK-END 60,0% 57,1% 3,0 81,67 84,83 -3,7% 49,03 48,42 1,2% 77,8
WEEKEND 77,6 76,7
74,1
75%
GLOBAL 67,1% 63,7% 3,4 83,57 87,89 -4,9% 56,05 55,98 0,1%
OVERALL
SOURCE GROUPE MKG / OLAKALA_SUITE 70% 72,2
JAN FEV MAR AVR MAI JUI JUI AOU SEP OCT NOV DEC
LES ÉVÉNEMENTS LOISIRS ET AFFAIRES LEISURE AND BUSINESS EVENTS SOURCE GROUPE MKG / OLAKALA_SUITE
CONTRIBUENT À LA HAUSSE DES CONTRIBUTE TO THE RECORDED
PERFORMANCES ENREGISTRÉES INCREASE IN RETURNS
En 2017, 5 études quantitatives ont été me- In 2017, 5 quantitative studies were carried
nées, via l’administration de questionnaires out, by administering a questionnaire,
lors de diverses manifestations. Tous les throughout various events. All the studied
événements étudiés ont un impact positif events had a positive impact on the periodic
sur les per formances périodiques returns recorded, despite the sometimes
enregistrées, malgré des variations parfois significant variations between the different
importantes entre les différents événements. events. Hotels recorded their best returns
Les hôtels ont enregistré leurs meilleures during the semi-finals of the Top 14 and
©INTERCONTINENTAL HOTEL
performances durant la demi-finale du Top14 the European Group for Blood and Marrow
et l’European Group for Blood and Marrow Transplantation (EBMT) Annual Congress
Transplantation Annual Congress (EBMT) with a more than 70% increase in the
avec plus de 70% d’augmentation du RevPAR RevPAR and a occupancy rate greater than
et un taux d’occupation supérieur à 85%. 85%. HÔTEL INTERCONTINENTAL
20 21DES PERFORMANCES ISSUES D’UN RETURNS DERIVED FROM A MIXED
MARCHÉ MIXTE AFFAIRES/LOISIRS BUSINESS/LEISURE MARKET
SUIVANT LA SAISONNALITÉ ACCORDING TO SEASON
Le remplissage des établissements de The clientele occupancy establishments
janvier à juin puis de septembre à décembre between January and June, and from
est principalement le fait de la clientèle September through to December is mainly
d’affaires. Les taux d’occupation sont plus business clientele. Occupancy rates are higher
élevés en semaine, et les hébergements during the week, and the accommodation/
affichent un taux maximal lors de congrès lodgings show a maximum rate during
importants. Le calendrier MICE (Meetings major conferences. The MICE (Meetings
Incentive Conferences & Exhibitions) est Incentive Conferences & Exhibition) calendar
particulièrement chargé sur les mois d’avril is particularly full over the months of April
à juin, et en septembre/octobre (occupation through June, and in September/October
supérieure à 70%). Toutefois, les mois de (occupancy greater than 70%). Nevertheless,
juillet et août affichent les taux de remplissage the months of July and August show the
les plus élevés, avec respectivement highest occupancy rates, with 80.4% and
80,4% et 84,6% de taux d’occupation en 84.6% in 2017, respectively. Over these two
2017. Sur ces deux mois, le remplissage des months, the hotels are mainly filled with
hôtels est principalement dû à la présence leisure clientele on both weekdays and
de la clientèle d’agrément, tant sur les weekends.
semaines que sur les week-ends.
REVPAR HT HEBDOMADAIRE EN EUROS 2017
2017 WEEKLY REVPAR BEFORE TAX
©AC MARRIOTT
80%
SEMAINE
77,1
72,1
77,1 WEEK
70
69,2
70% 69 HÔTEL AC BY MARRIOTT MARSEILLE VÉLODROME
•69,7 67,9
TOTAL
61,9 67,1
61,1 •68,9 63,6
•63,6 •67,8
58,9 58,6
60% •63,3
•63,1
WE RÉPARTITION ANNUELLE DE LA CLIENTÈLE RÉPARTITION ANNUELLE DES CLIENTÈLES
54,3
56 57,3 PAR ORIGINE GÉOGRAPHIQUE DANS L’HÔTELLERIE GROUPES ET INDIVIDUELLES DANS L'HÔTELLERIE
50% 47,9
49,6 54,8
MARSEILLAISE EN 2017 MARSEILLAISE EN 2017
50,2 50,3 ANNUAL DISTRIBUTION OF THE CLIENTELE IN MARSEILLE HOTELS DISTRIBUTION OF GROUP AND INDIVIDUAL CLIENTELE IN
43,1 BY GEOGRAPHIC ORIGIN MARSEILLE HOTELS IN 2017
40% 43,7 GROUPES
41,2 41,9 38,4 GROUPS
37,7 ETRANGER 6,60%
33,4 ABROAD
30%
31,9 31,6 19,50%
20%
JAN FEV MAR AVR MAI JUI JUIL AOU SEP OCT NOV DEC
SOURCE GROUPE MKG / OLAKALA_SUITE
FRANCE INDIVIDUELS
INDIVIDUALS
80,50% 93,40%
SOURCE GROUPE MKG / OLAKALA_SUITE SOURCE GROUPE MKG / OLAKALA_SUITE
22 23Cap des 9 millions
de passagers
TRANSPORTS franchi
TRANSPORT Cap of 9 million
passengers
coming through
®CAMILLE MOIRENC
LE TRANSPORT AÉRIEN
AIR TRANSPORT AÉROPORT MARSEILLE PROVENCE (MP)-PARVIS
CARTE DU RÉSEAU 2018 - AÉROPORT MARSEILLE PROVENCE En 2017, l’Aéroport Marseille Provence a In 2017, the Marseille Provence Airport
2018 NETWORK CARD - MARSEILLE PROVENCE AIRPORT accueilli 9 002 086 passagers soit 526 277 received 9,002,086 passengers, 526,277
passagers supplémentaires par rapport à more passengers than in 2016 (+6.2%).
2016 (+6,2%). For long haul flights, the year 2017 was
Sur le long courrier, l’année 2017 a été marked by growth in traffic to and from
marquée par la progression du trafic avec Montreal (+80%) thanks to the arrival of Air
Montréal (+80%) grâce à l’arrivée d’Air Canada Canada Red and the continuous growth of
Rouge et la poursuite de la croissance d’Air Air Transat (8 direct flights per week in total),
Transat (8 vols directs au total par semaine) as well as by the return of Air Austral with 2
ainsi que par le retour d’Air Austral avec 2 vols weekly flights to and from Réunion.
hebdomadaires pour la Réunion. The traffic in Terminal 1 (Gates 1 to 4) and
Le trafic du Terminal 1 (ex Halls 1 à 4) et du in Terminal 2 (e.g. MP2) have progressively
Terminal 2 (ex mp²) ont respectivement grown by 4.1% and 12.8% between 2016 and
progressé de 4,1% et de 12,8% entre 2016 et 2017.
2017. In 2017, domestic traffic increased by 2.4%
Le trafic domestique a augmenté de 2,4% compared to 2016, reaching 3,560,634
en 2017 par rapport à 2016, pour atteindre passengers.
3 560 634 passagers. International traffic has driven the majority
Le trafic international a porté l’essentiel de of growth in 2017, with 5,361,235 passengers
la croissance 2017 avec 5 361 235 passagers (+9% compared to 2016), and now represents
(+9% par rapport à 2016) et représente 60% of total traffic, i.e. 1 percentage point
désormais 60% du trafic total soit 1 point more than in 2016. London continues to be
de plus qu’en 2016. Londres reste la première the number one international destination
destination internationale au départ de for flights departing from the airport and
l’aéroport et enregistre pour la 2ème année for the 2nd consecutive year, there has been
consécutive une croissance de près de 7% an increase of nearly 7%, which is 589,559
soit +589 559 passagers. passengers.
SOURCE : AÉROPORT MARSEILLE PROVENCE / MARSEILLE PROVENCE AIRPORT
La croissance du trafic sur le court et The traffic increase on short- and medium-
FRÉQUENTATION DE L’AÉROPORT MARSEILLE PROVENCE moyen-courrier s’explique principalement haul flights is mainly attributed to the low
MARSEILLE PROVENCE AIRPORT VISITATION
par l’activité des low cost Ryanair, EasyJet, cost airlines Ryanair, Easyjet, Vueling and
NOMBRE DE PASSAGERS NOMBRE DE PASSAGERS Vueling et Volotea. Volotea.
TRAFIC VARIATION / CHANGE
NUMBER OF PASSENGERS NUMBER OF PASSENGERS
TRAFFIC 2016/2017 Sur le plan de la qualité de service, l’aéroport In terms of the quality of service, the airport
2016 2017
a poursuivi à hauteur de 40 millions d’euros has pushed for over 40 million Euros for the
NATIONAL 3 475 694 3 560 634 +2,4%
les travaux d’investissement prévu dans son investment works planned in its “Cap 2025”
INTERNATIONAL 4 919 984 5 361 235 +9% plan stratégique « Cap 2025 » : réorganisation strategic plan: reorganizing the road network
TRANSIT 78 663 80 217 +2% des accès de voirie, nouvelle gare routière, access, a new bus terminal, landscaping a
aménagement d’un parvis piétonnier pedestrian concourse, works to improve
TOTAL 8 474 341 9 002 086 +6,2% paysager, travaux pour l’amélioration du passenger comfort.
SOURCE : AÉROPORT MARSEILLE PROVENCE / MARSEILLE PROVENCE AIRPORT confort des passagers.
24 25TOP 10 DES DESTINATIONS INTERNATIONALES EN 2017 RÉPARTITION DU TRAFIC AÉRIEN EN 2017
TOP 10 INTERNATIONAL DESTINATIONS IN 2017 DISTRIBUTION OF AIR TRAFFIC IN 2017
SOURCE : AÉROPORT MARSEILLE PROVENCE
/ MARSEILLE PROVENCE AIRPORT
ÉVOLUTION RANG PAR RESTE DU MONDE
REST OF THE WORLD
DESTINATIONS PASSAGERS RAPPORT À 2016
PASSENGERS 16/17 RANKING 2,6%
CHANGE 16/17 COMPARED TO 2016
LONDRES
1 LONDON
589 559 +7% =
AFRIQUE DU NORD PARIS
NORTH AFRICA
AMSTERDAM
2 AMSTERDAM
332 378 +8% = 18,5%
ALGER
17,5%
3 ALGIERS
327 615 +13,6% =
CORSE
BRUXELLES 7,3% CORSICA
4 BRUSSELS
287 156 +10,3% +1
LISBONNE
5 LISBON
225 459 +5,8% +1
14,3%
ROME 39,8%
6 ROME
222 611 -19,2% -2
AUTRES (FRANCE)
OTHER (FRANCE)
TUNIS
7 TUNIS
207 385 +9,3% +2
EUROPE
MUNICH
8 MUNICH
190 818 -2,5% =
®CAMILLE MOIRENC
MADRID
9 MADRID
186 826 -5,6% -2
ISTAMBUL ENTRÉE
10 ISTANBUL
179 998 +9,1% INCOMING Enquête auprès des touristes aériens SURVEY ON AIR TOURISTS
ELÉMENTS ISSUS DE L’ENQUÊTE PASSAGERS 2013 ET RÉACTUALISÉS EN 2017 ELEMENTS ARISING FROM THE PASSENGERS SURVEY CARRIED OUT IN 2013
AÉROPORT MP-PISTE AVIONS SOURCE : AÉROPORT MARSEILLE PROVENCE / MARSEILLE PROVENCE AIRPORT (SOURCE AÉROPORT MARSEILLE PROVENCE) AND AGAIN IN 2017. (SOURCE MARSEILLE PROVENCE AIRPORT)
PROVENANCE DES PASSAGERS ORIGIN OF PASSENGERS
En 2017, les passagers « import » (qui In 2017, the ‘import’ passengers holidaying
PASSAGERS ACCUEILLIS À L’AÉROPORT MARSEILLE PROVENCE DE 2007 À 2017 séjournent en Provence) représentent 32% in Provence represented 32% of the airport’s
PASSENGER ARRIVALS AT MARSEILLE PROVENCE AIRPORT BETWEEN 2007 AND 2017 du trafic total de l’aéroport soit 2 880 668 total traffic, or 2,880,668 passengers.
9 002 086
9 000 000 passagers. 47% of them came from French regions, 53%
8 474 341
8 285 374 8 260 359 8 182 237
8 261 733 47% d’entre eux proviennent de Paris et des from abroad, of which 30% from Europe and
autres régions françaises, 53% de l’étranger 23% from the rest of the world.
TOTAL
7 464 131
dont 30% d’Europe et 23% du reste du
SOURCE : AÉROPORT MARSEILLE PROVENCE / MARSEILLE PROVENCE AIRPORT
7 231 966 7 310 485
6 933 669 6 914 654
6 601 138 Monde). PASSENGERS’ HOLIDAY DESTINATIONS
6 750 000 6 473 758 6 329 129 6 342 659
Bouches-du-Rhône took first place for
5 998 808 5 852 269 5 935 423
6 179 163 6 057 909 LIEUX DE SÉJOUR DES PASSAGERS ‘import’ passengers’ destination with 73%
5 560 614 5 740 985 TERMINAL1
(HALL 1 À 4) Les Bouches-du-Rhône demeurent le of trips. The city of Marseille alone takes 44%
premier espace de séjour des passagers of ‘import’ passengers from the airport, being
« import » avec 73% des séjours. La seule ville about 1.28 million passengers in 2017.
4 500 000
de Marseille accueille 44% des passagers
« import » de l’aéroport soit environ REASONS
1,28 million de passagers en 2017. 31% of ‘import’ passengers came for
2 400 948
professional reasons.
2 250 000 1 931 230 2 003 074
2 203 824 2 131 682 MOTIFS 29% for visiting friends and family
1 671 352 1 723 146 1 811 616 31% des passagers « import » sont venus pour 35% for leisure and vacation
1 062 385
1 375 062
TERMINAL 2 des raisons professionnelles. 5% for other reasons
934 861
(MP2) 29% pour visite amis-famille.
35% pour loisirs et vacances.
0 5% autres motifs.
2007 2008 2009 2010 2011 2012 2013 2014 2015 2016 2017
26 27LE TRANSPORT FERROVIAIRE Nouvelle
RAIL TRANSPORT progressioni
CARTE DES DESTINATIONS TGV OUIGO - GARE SAINT-CHARLES New
TGV-OUIGO - SAINT-CHARLES STATION DESTINATION MAP growth
© PATRICK LEVEQUE
LA GARE SAINT-CHARLES
La gare Saint-Charles a accueilli 12 750 644 Saint-Charles station received 12,750,644
voyageurs en 2017 (toutes activités SNCF) passengers in 2017 (all SNCF activities)
contre 11 965 111 en 2016 soit + 6,5%. versus 11,965,111 in 2016 or + 6.5%.
ÉVOLUTION DU TRAFIC VOYAGEURS DE LA GARE SAINT-CHARLES DE 2007 À 2017
EVOLUTION OF PASSENGER TRAFFIC IN SAINT-CHARLES STATION BETWEEN 2007 AND 2017
12 750 644
12 000 000
11 518 840
11 425 015
11 300 000
11 965 111
10 980 000 10 900 000
10 885 000
11 000 000 10 780 000
10 180 000
10 000 000 9 813 000
9 000 000
2007 2008 2009 2010 2011 2012 2013 2014 2015 2016 2017
SOURCE SNCF-DIRECTION PACA – SNCF
SOURCE SNCF – DIRECTION COMMERCIALE – SNCF
28 29LE TRANSPORT MARITIME DE PASSAGERS Trafic passagers
MARITIME PASSENGER TRANSPORT en très légère baisse
Passenger traffic
has decreased very slightly
ÉVOLUTION DU TRAFIC
LIGNES RÉGULIÈRES ET CROISIÈRES
EVOLUTION OF TRAFFIC
REGULAR LINES AND CRUISE LINES
LE
En TRANSPORT MARITIME
2017, le Grand DE PASSAGERS
Port Maritime de In 2017, the Grand Port Maritime de Marseille
MARITIME PASSENGER TRANSPORT
Marseille (GPMM) a accueilli 2 683 623 (GPMM) received 2,683,623 passenger
passagers contre 2 713 850 en 2016 soit -1,1%. versus 2,713,850 in 2016, so -1.1%.
Par rapport à 2016, les lignes régulières In comparison to 2016, the regular lines
(Corse, Algérie, Tunisie et autres (Corsica, Algeria, Tunisia and other
destinations) enregistrent une hausse destinations) recorded an increase of 7.3%
de 7,3% de passagers et le nombre de of passengers and the number of cruise
croisiéristes une baisse de 7%. ship passengers fell by 7%.
Les croisiéristes représentent 55,2% du total Cruise ship passengers represent 55.2% of
de passagers 2017 du GPMM contre 73,3% GPMM’s total passengers in 2017, versus 73.3%
en 2016. in 2016.
ÉVOLUTION DU TRAFIC PASSAGERS DE 2007 À 2017
EVOLUTION OF PASSENGER TRAFFIC BETWEEN 2007 AND 2017
3 000 000
2 713 850 2 683 623 (*)
2 618 681
2 547 341
2 441 663 2 464 682
2 341 592
TOTAL (1)
2 250 000
2 107 285
2 037 782 2 047 608 2 068 814
CROISIÈRES
CRUISE SHIPS
1 595 007
1 455 363 1 482 666 (*)
1 500 000
1 302 976
SOURCE : GRAND PORT MARITIME DE MARSEILLE
1 166 690
993 072 1 022 714
965 293
860 978 874 161 869 394 CORSE
779 214 CORSICA
890 124 681 769 630 494 (*)
750 000 646 925 631 099 810 490 616 969
747 143 684 674
606 792 604 926 583 624 570 463 (*)
526 522 538 030 528 825 535 219
486 698 479 937 475 009
429 661
AUTRES LIGNES
OTHER LINES
0
2007 2008 2009 2010 2011 2012 2013 2014 2015 2016 2017
©GPMM
* Pour l’année 2017, il n’a pas été possible d’harmoniser le chiffre croisière * It wasn’t possible to reconcile the cruise ship figures with those of
avec celui du Club de la Croisière Marseille Provence. Marseille Provence Cruise Club for the year 2017.
MSC MÉRAVIGLIA
30 31Une activité FAITS MARQUANTS DE L’ACTIVITÉ KEY FACTS OF CRUISE SHIP ACTIVITY
CROISIÈRES À MARSEILLE EN 2017 IN MARSEILLE IN 2017
CROISIÈRES ET GRANDE PLAISANCE soutenue
> 9 escales inaugurales dont MSC Meraviglia, > 9 inaugural stopovers, including MSC
CRUISE SHIPS AND LARGE YACHTS A sustained fleuron de la flotte MSC Croisières. Meraviglia, the flagship of MSC Cruises.
activity
> Inauguration de la Forme 10, 1ère cale sèche > Inauguration of Forme 10, the Mediter-
en Méditerranée et 3ème plus importante au ranean’s 1st and the world’s 3rd largest dry dock.
monde. > TOP Cruise Business 2017: 130 professionals,
> TOP Cruise Business 2017 : 130 profession- including travel agents, company representa-
CHIFFRES CLÉS DE LA CROISIÈRE
®CMOIRENC
nels dont des agents de voyages, représen- tives, visitors/partners, 19 cruise companies
À MARSEILLE EN 2017 tants de compagnies, visiteurs/partenaires, represented and 280 participants in student
KEY FIGURES OF CRUISE SHIPS IN MARSEILLE IN 2017 19 de compagnies de croisières représentées sessions.
1 487 313 passagers
et 280 participants aux sessions étudiantes. > Overall strengthening of Costa Cruises’
444 escales > Renforcement global du positionnement ranking in terms of passengers and stopovers.
3 350 passagers en moyenne par escale de Costa Croisières en passagers et en escales. > Ranking of MSC Meraviglia, MSC Cruises’
30 compagnies de croisières > Positionnement du MSC Meraviglia, new flagship.
70 navires différents nouveau bateau amiral de MSC Croisières. > Repositioning of the ships of Royal Carib-
1,487,313 passengers > Repositionnement des navires des bean Cruise Lines with the more numerous
444 stopovers compagnies : stopovers by Freedom of the Seas (with a smal-
3,350 passengers on average per stopover -Royal Carribean Cruise Lines avec des escales ler capacity), which replaced Harmony of the
30 cruise companies plus nombreuses du Freedom of the Seas Seas, and Norwegian Cruise Line with Norwe-
70 different cruise ships (plus petite capacité) pour remplacer gian Spirit.
l’Harmony of the Seas : > Growth of the Thompson Cruises and
- Norwegian Cruise Line avec le Norwegian TUI UK stopovers with three berthed ships
Spirit. (Celebration, Discovery 2 and Majesty).
Avec 1 487 313 passagers et 444 escales en With 1,487,313 passengers and 444 stopo-
2017, Marseille, 1er port de croisière de France vers in 2017, Marseille, France’s largest cruise > Développement des escales de Thompson > Rich program of luxury cruise ship
enregistre une légère baisse du nombre de port, recorded a slight drop in the number of Cruises et de TUI UK avec trois navires position- stopovers, a sign of the destination’s attrac-
passagers (-6,8 % par rapport à 2016). Ceci passengers (-6.8 % when compared to 2016), nés (Celebration, Discovery 2 et Majesty). tiveness and that it is becoming upmarket
s’explique à la fois par l’arrêt de l’activité which can be explained by both the fact > Riche programme d’escales de navires de (ships received: Seven Seas Explorer, Seabourn
de la compagnie « Croisière de France » that the ‘Croisière de France’ company has croisière de luxe, signe de l’attractivité et de la Encore, Viking Ocean Cruises, etc.).
et le remplacement de navires de jauges stopped operating and that some ships have montée en gamme de la destination (navires > Return of the German company Aïda
inférieures. been replaced by smaller ships. accueillis : Seven Seas Explorer, Seabourn Cruises for its overnight stopovers.
Encore, Viking Ocean Cruises, etc.).
Comme en 2016, la répartition en volume The distribution of passenger volume > Retour de la compagnie allemande Aïda
passagers entre croisières en tête de ligne between head of the line cruises and transit Cruises pour ses escales overnight.
et croisière en transit reste équivalente, soit cruises remains equivalent to what it was in
respectivement 28 % et 72 %. 2016, being 28% and 72%, respectively.
®CMOIRENC
PAQUEBOT EN RADE DE MARSEILLE
32 33EVOLUTION DU NOMBRE DE CROISIÉRISTES ENTRE 1997 ET 2017 TOP 20 DES NATIONALITÉS DES CROISIÉRISTES
EVOLUTION OF THE NUMBER OF CRUISE SHIP PASSENGERS BETWEEN 1997 AND 2017 TOP 20 CRUISE SHIP PASSENGER NATIONALITIES
1 448 086 1 487 313
1 400 000
% SUR LE NOMBRE
TOTAL DE
CROISIERISTES
TOTAL GÉNÉRAL ACCUEILLIS (1 487 713)
GENERAL TOTAL % OF THE TOTAL
1 188 031 NUMBER OF CRUISE SHIP
1 072 433 PASSENGERS RECEIVED
1 050 000 (1,487,713)
945 370
FRANCE
810 490 806 713
1 FRANCE
336 107 25%
ITALIE
700 000
630 492 2 ITALY
277 228 20%
545 787
ESPAGNE
440 000
456 309 502 716 3 SPAIN
96 870 7%
414 880
360 000
355 887 ETATS-UNIS
350 000 381 318
4 UNITED STATES
96 119 7%
240 219
• 148 506
• 66 005 • 129 820 265 476 284 000
333 000
ALLEMAGNE
• 51 955 • 18 686 162 490 264 703 5 94 818 7%
• 14 050 GERMANY
76 000 174 183
ROYAUME-UNI
0 77 729 90 411 107 000 6 UNITED KINGDOM
79 616 6%
1997 1999 2001 2003 2005 2007 2009 2011 2013 2015 2017
SUISSE
SOURCE : CLUB DE LA CROISIÈRE MARSEILLE PROVENCE
7 SWITZERLAND
35 828 3%
PASSAGERS TRANSIT PASSAGERS TÊTE DE LIGNE TOTAL
CANADA
TRANSIT PASSENGERS
1 072 433
HEAD END PASSENGERS
414 880
1 487 313 8 CANADA
23 879 2%
AUTRICHE
9 AUSTRIA
22 660 2%
FRÉQUENTATION MENSUELLE DES CROISIÉRISTES EN 2017
BELGIQUE
MONTHLY VISITATION OF CRUISE SHIP PASSENGERS IN 2017 10 BELGIUM
22 391 2%
RUSSIE
234 474 TOTAL 11 RUSSIA 19 416 1%
225 000 ANGLETERRE
12 ENGLAND 17 262 1%
183 599 CHINE
180 000
168 416
13 CHINA 15 651 1%
157 070 157 135 153 085
AUSTRALIE
136 172 14 AUSTRALIA 14 711 1%
135 000
115 172 120 826 ISRAEL
115 975
112 860 113 605
105 008 103 897
15 ISRAEL 14 665 1%
90 000
PAYS-BAS
• 50 194 61 948 89 113 88 935
66 058 83 874 16 NETHERLANDS 14 601 1%
• 40 985 • 33 180
• 27 022 •17 014 67 624 49 188
•13 963 44 238 44 210 62 963 PORTUGAL
45 000
36 309
17 PORTUGAL 13 329 1%
17 710 31 164
24 492 26 237 20 911 BRÉSIL
18 BRAZIL 10 661 1%
0
JAN FEV MAR AVR MAI JUI JUI AOU SEP OCT NOV DEC
IRLANDE
SOURCE : CLUB DE LA CROISIÈRE MARSEILLE PROVENCE / MARSEILLE PROVENCE CRUISING CLUB
19 IRELAND 10 011 1%
®CMOIRENC
TOTAL JAPON
PASSAGERS TRANSIT
TRANSIT PASSENGERS
PASSAGERS TÊTE DE LIGNE
HEAD END PASSENGERS 1 487 313
20 JAPAN 9 356 1%
1 072 433 414 880
SOURCE : CLUB DE LA CROISIÈRE MARSEILLE PROVENCE / MARSEILLE PROVENCE CRUISING CLUB
34 35RETOMBÉES ÉCONOMIQUES ECONOMIC BENEFITS
DE LA CROISIÈRE OF CRUISES
EXTRAIT DE L’ÉTUDE 2016 SUR LES RETOMBÉES ÉCONOMIQUES DE LA EXTRACT FROM THE 2016 STUDY ON THE ECONOMIC BENEFITS OF CRUISES
CROISIÈRE (CCI MARSEILLE PROVENCE ET CLUB DE LA CROISIÈRE MARSEILLE
(CCI MARSEILLE PROVENCE AND MARSEILLE PROVENCE CRUISE CLUB)
PROVENCE)
La croisière représente environ 310 M€ et Cruises represent approximately €310M and
2 000 emplois par an à Marseille, soit : 2,000 jobs in Marseille per year, being:
- 40 M€ et 230 emplois en impacts directs - €40 M and 230 jobs in direct impact
- 70 M€ et 470 emplois en impacts indirects - €70 M and 470 jobs in indirect impact
- 200 M€ et 1 300 emplois en impacts induits - €200 M and 1,300 jobs in induced impact
IMPACT ÉCONOMIQUE ECONOMIC IMPACT
DES ÉQUIPAGES OF THE CREWS
DONNÉES 2017, CLUB DE LA CROISIÈRE MARSEILLE PROVENCE 2017 DATA, MARSEILLE PROVENCE CRUISE CLUB
En 2017, les membres d’équipage à bord des In 2017, the crew members on board cruise
navires de croisière ont représenté 455 500 ships comprised of 455,500 people, being
personnes, soit près d’un 1/3 des passagers nearly a third of the cruise passengers in
croisière à Marseille. Marseille.
Si ces membres d’équipage ne descendent Even if these crew members do not
pas systématiquement à chaque escale, systematically disembark at every port,
il s’agit bien d’une clientèle à part entière they are a clientele in their own right, as they
qui consomme sur le territoire Marseille consume in the Greater Marseille area.
Provence.
The technical ship stops in the Marseille
Les arrêts techniques des navires au Chantier shipyard also contribute to tourist
CMOIRENC
Naval de Marseille contribuent également à consumption.
la consommation touristique. PLATEFORME - CHANTIER NAVAL DE MARSEILLE
LA RÉPARATION NAVALE SHIP REPAIRS
Activités florissantes, les croisières et la Flourishing activities, cruises and large
GRANDE PLAISANCE - YACHTING grande plaisance favorisent l’activité de la yachts encourage ship repairs.
LARGE YACHTS réparation navale.
FRÉQUENTATION 2017 DES YACHTS (*)
2017 YACHT VISITATION (*) CHANTIER NAVAL DE MARSEILLE MARSEILLE SHIPYARD
NUITÉES NUITÉES Le chantier naval de Marseille (CNM) est un Marseille Shipyard (MS) is a ship repair
YACHTS >= 24 NOMBRE BASSE SAISON HAUTE SAISON TOTAL DES NUITÉES chantier de réparation navale, de «refitting» yard which specialises in refitting and ship
MÈTRES DE LONG OVERNIGHT OVERNIGHT TOTAL OVERNIGHT et de conversion de navires. conversion.
NUMBER
METERS LONG STOPOVERS STOPOVERS STOPOVERS
LOW SEASON HIGH SEASON Le CNM exploite les formes n°8 (320 m x 50 MS uses Docks no. 8 (320 m x 50 m), 9 (250 m
VIEUX-PORT
m), n°9 (250 m x 37 m) et n°10 (465 m x 85 m) x 37 m) and 10 (465 m x 85 m) of Marseille’s
OLD PORT 36 112 88 200 du port de Marseille et peut accueillir tous harbor and can house all types of ships.
types de navires. In 2017, MS operated on 28 ships, 10 of
SOURCE : AIX-MARSEILLE PROVENCE-MÉTROPOLE – DIRECTION DES PORTS
AIX-MARSEILLE PROVENCE METROPOLE HARBOUR MANAGEMENT En 2017, le CNM est intervenu sur 28 navires which were ocean liners.
dont 10 paquebots.
* ne sont comptabilisés que les postes à flot gérés en régie par * only floating posts managed by the governance of the Aix
Aix-Marseille Provence Métropole Marseille Provence Metropole are accounted for
Plus d’informations : cndm.eu More information: cndm.eu
36 37Vous pouvez aussi lire